Tähti Pohjanmies  ,
Sakina Elshibli,
Pertti Pulkkinen,
Mari Rusanen,
Pekka Vakkari,
Helena Korpelainen,
Tomas Roslin
,
Sakina Elshibli,
Pertti Pulkkinen,
Mari Rusanen,
Pekka Vakkari,
Helena Korpelainen,
Tomas Roslin
Fragmentation-related patterns of genetic differentiation in pedunculate oak (Quercus robur) at two hierarchical scales
Pohjanmies T., Elshibli S., Pulkkinen P., Rusanen M., Vakkari P., Korpelainen H., Roslin T. (2016). Fragmentation-related patterns of genetic differentiation in pedunculate oak (Quercus robur) at two hierarchical scales. Silva Fennica vol. 50 no. 2 article id 1510. https://doi.org/10.14214/sf.1510
Highlights
- While long-lived, widespread tree species should be resistant to genetic impoverishment, we detected high differentiation among populations and pronounced genetic structure within populations of Quercus robur in Finland
- These patterns seem indicative of population processes active at range margins, and of disequilibrium following historic habitat change
- Preservation of remaining genetic variation is thus important in the conservation of Q. robur.
Abstract
Populations at species’ range margins are expected to show lower genetic diversity than populations at the core of the range. Yet, long-lived, widespread tree species are expected to be resistant to genetic impoverishment, thus showing comparatively high genetic diversity within populations and low differentiation among populations. Here, we study the distribution of genetic variation in the pedunculate oak (Quercus robur L.) at its range margin in Finland at two hierarchical scales using 15 microsatellite loci. At a regional scale, we compared variation within versus among three oak populations. At a landscape scale, we examined genetic structuring within one of these populations, growing on an island of ca 5 km2. As expected, we found the majority of genetic variation in Q. robur to occur within populations. Nonetheless, differentiation among populations was markedly high (FST = 0.12) compared with values reported for populations of Q. robur closer to the core of its range. At the landscape level, some spatial and temporal sub-structuring was observed, likely explained by the history of land-use on the island. Overall, Q. robur fulfils the expectation of the central-marginal hypothesis of high differentiation among marginal populations, but the notable population differentiation has most likely been influenced also by the long, ongoing fragmentation of populations. Finnish oak populations may still be adjusting to the drastic habitat changes of the past centuries. Preservation of genetic variation within the remaining stands is thus an important factor in the conservation of Q. robur at its range margin.
Keywords
marginal populations;
Finland;
genetic diversity;
microsatellites
-
Pohjanmies,
University of Helsinki, Department of Agricultural Sciences, Spatial Foodweb Ecology Group, P.O. Box 27, FI-00014 University of Helsinki, Finland; University of Jyväskylä, Department of Biological and Environmental Sciences, P.O. Box 35, FI-40014 University of Jyväskylä, Finland
E-mail
tahti.t.pohjanmies@jyu.fi
- Elshibli, Natural Resources Institute Finland (Luke), Green technology, P.O. Box 18, FI-01301 Vantaa, Finland; University of Helsinki, Department of Agricultural Sciences, P.O. Box 27, FI-00014 University of Helsinki, Finland E-mail sakina.elshibli@helsinki.fi
- Pulkkinen, Natural Resources Institute Finland (Luke), Green technology, Haapastensyrjäntie 34, FI-12600 Läyliäinen, Finland E-mail pertti.pulkkinen@luke.fi
- Rusanen, Natural Resources Institute Finland (Luke), Green technology, P.O. Box 18, FI-01301 Vantaa, Finland E-mail mari.rusanen@luke.fi
- Vakkari, Natural Resources Institute Finland (Luke), Green technology, P.O. Box 18, FI-01301 Vantaa, Finland E-mail pekka.vakkari@luke.fi
- Korpelainen, University of Helsinki, Department of Agricultural Sciences, P.O. Box 27, FI-00014 University of Helsinki, Finland E-mail helena.korpelainen@helsinki.fi
- Roslin, University of Helsinki, Department of Agricultural Sciences, Spatial Foodweb Ecology Group, P.O. Box 27, FI-00014 University of Helsinki, Finland; Swedish University of Agricultural Sciences, Department of Ecology, P.O. Box 7044, SE-750 07 Uppsala, Sweden E-mail tomas.roslin@helsinki.fi
Received 9 October 2015 Accepted 30 December 2015 Published 20 January 2016
Views 164677
Available at https://doi.org/10.14214/sf.1510 | Download PDF

1 Introduction
Genetic variation is a prerequisite for the evolutionary adaptation of organisms and thereby an important factor in the preservation of populations (Allendorf and Luikart 2007). Higher levels of heterozygosity, a measure of genetic diversity, are typically associated with higher population fitness (Reed and Frankham 2003). Furthermore, genetic variation within a population of one species may influence the dynamics and diversity of associated species (Hersch-Green et al. 2011). If the genetic variation within a basal species significantly affects associated species diversity, its preservation becomes a factor in the conservation of all of those species (Wimp et al. 2004).
The amount of genetic variation within and among populations is shaped by population genetic processes, such as selection, random drift, and gene flow. The nature of these processes is determined by the life history traits of the species and the properties of the surrounding ecosystem. In small, isolated populations, genetic drift is strong and gene flow limited, which may lead to pronounced genetic differentiation of populations and loss of genetic variation (Allendorf and Luikart 2007). Populations at the margin of a species’ range are hypothesized to show lower genetic diversity and increased genetic differentiation as compared with populations at the core of the species’ range due to reduced gene flow and increased genetic drift and selection (Eckert et al. 2008). Besides factors related to populations being located either at the core or margin of the species’ distribution, population structuring is also affected by human land use. In fact, anthropogenic habitat fragmentation is currently one of the leading causes of biodiversity loss (Pimm and Raven 2000). At range margins where populations are typically small and isolated, anthropogenic habitat fragmentation can be expected to have particularly detrimental effects.
Oaks (Quercus L. spp.) may be considered foundation species in the temperate forests of the northern hemisphere. Therefore, the ongoing decline in their abundance in the region has caused concern for the preservation of associated species and ecosystem functions (Ellison et al. 2005; Lindbladh and Foster 2010). As a group, oaks are characterized by high levels of genetic variation both within and among species (Kremer and Petit 1993; Curtu et al. 2007), and higher genetic variation within than among populations has been observed in several Quercus taxa (Kremer and Petit 1993; Lind and Gailing 2013). High within-population genetic diversity and comparatively low among-population variation are typical patterns for long-lived woody species with large geographic ranges, outcrossing breeding systems, and wind-mediated pollination (Hamrick et al. 1992). As a consequence, these species may be relatively resilient to a loss of genetic variation even in fragmented habitats (Hamrick 2004). However, isolation and reduction in sources of gene flow may increase the level of inbreeding and the risk of future genetic bottlenecks also in fragmented tree populations (Honnay and Jacquemyn 2007).
The pedunculate oak (Quercus robur L.) reaches its northern distribution limit in south-western Finland. Here as elsewhere, it supports high levels of associated biodiversity (Southwood 1961), including several red-listed specialist species (Rassi et al. 2010; Hardwick et al. 2015). The distinctiveness of the fauna associated with Q. robur in Finland is accentuated by its taxonomic uniqueness, as Q. robur is the only oak species occurring naturally in Finland. Its current distribution in Finland is a result of climatic and geological changes after the last glacial period (Ferris et al. 1998) and, more recently, of human land and resource use. As a consequence, the present populations are relatively small and strongly fragmented (Ollinmaa 1952; Vakkari et al. 2006).
In this study, we use microsatellite markers to measure genetic variation in Finnish Quercus robur populations and examine the distribution of this variation at two hierarchical scales: 1) among three populations (henceforth referred to as the regional level), and 2) within one stand (henceforth referred to as the landscape level). In doing so, we ask: 1) Are Finnish oak populations more strongly differentiated than central European populations, as expected under the central-marginal hypothesis? 2) Do spatial and temporal patterns at the landscape level reflect landscape history, including past or present habitat fragmentation? To probe for such landscape-level effects, we specifically ask: 2A) Does the relatedness among individual trees decrease with increasing distance? 2B) Do spatially isolated individuals show increased levels of inbreeding? 2C) Are adult and juvenile cohorts among the population differentiated?
2 Materials and methods
2.1 Study populations
Three oak populations were chosen within south-western Finland: two on the mainland, in Inkoo and Salo, respectively, and one on Wattkast, an island in Korppoo (Fig. 1). The population in Inkoo is a scattered stand of some one hundred trees, covering an area of approximately 1000 m × 200 m. The Salo population is a stand of nearly 300 trees growing in an area of approximately 600 m × 50 m. The population on Wattkast consists of about 1900 trees, as widely scattered across the entire island of approximately 5 km2. In Wattkast and Salo, a random set of 194 and 35 trees, respectively, were sampled for genotyping. In Inkoo, all trees with a diameter at breast height (DBH) > 5 cm (n = 96) were sampled. In Inkoo and Salo, samples were collected in the autumn of 2004 and in Wattkast in September 2011.
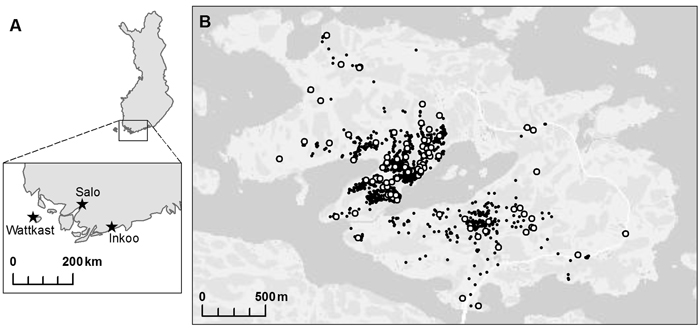
Fig. 1. A map of the populations of Quercus robur investigated at (A) the regional and (B) the landscape level. Within the island of Wattkast (B), each individual oak tree is indicated with a small black dot (N = 1900) and the trees sampled for the genetic analysis (n = 194) with large white dots.
2.2 Genotyping
Genotyping was performed as described in Pohjanmies et al. (2015). In brief, sampled individuals were genotyped using 15 nuclear microsatellite loci (Dow et al. 1995; Steinkellner et al. 1997; Kampfer et al. 1998), amplified from DNA extracted from leaf samples using the E.Z.N.A.™ extraction protocol (E.Z.N.A.™ SP Plant Mini Kit D5511-02; Omega Bio-Tek Inc., Norcross, GA, USA). Fifteen pairs of primers were used to amplify the 15 microsatellite loci. The PCR amplification reactions were performed in a volume of 13 µL. Four different multiplex reaction mixtures were made using QIAGEN Multiplex PCR Kit. Forward primers were fluorescently labeled with Beckman’s WeI1RED (Beckman Coulter Inc., Brea, CA, USA). Genotyping was carried out using a CEQ 8000 genetic analyzer (Beckman Coulter Inc.); 1 µl of amplified DNA and 24 µl of DNA Size Standard were loaded into 96-well plates. Allele visualization and scoring were performed using the fragment analysis module CEQ 8000 software (Beckman Coulter Inc.).
2.3 Analysis of genetic differentiation among populations
We recorded the levels of genetic diversity within the focal populations as the number of alleles detected (A), expected heterozygosity (He), and observed heterozygosity (Ho), which were calculated for each locus and each population using Arlequin v3.5.1.3 (Excoffier and Lischer 2010). Measures of allelic richness can be highly dependent of sample size, especially when using microsatellites (Leberg 2008). When the loci studied are highly polymorphic, fewer rare alleles are detected in small samples, and the estimated allelic richness is biased downward. For this reason, the estimates of allelic richness were corrected for unequal sample sizes by the rarefaction method of Hurlbert (1971). Because the sample size was smallest in the Salo population (n = 35), the method was used to calculate estimates of the expected number of alleles at each locus in a random sample of 35 individuals from the Wattkast and Inkoo populations.
We note that a partial analysis of genetic diversity using some of the current data (unrarefied values for 5 loci) was presented by Pohjanmies et al. (2015), who examined whether low genetic diversity within peripheral populations may reduce the impact of host genotype on associated herbivore communities. For further details, we refer the reader to the respective study.
Genetic differentiation between the three populations was quantified with a standard analysis of molecular variance (AMOVA; Excoffier et al. 1992) using Arlequin with default settings. The significance of the fixation index (FST) was tested by a comparison of the observed value to those generated by 10 000 permutations of individual genotypes among the populations. Ten percent missing data per locus was allowed.
Population differentiation was further examined with a population assignment analysis implemented in STRUCTURE 2.3.4 (Pritchard et al. 2000). This method detects genetic clusters in the data and determines the likely ancestry of each individual in these clusters as based on allele frequencies. To improve the detection of distinct clusters within potentially closely-related populations, we applied two methods: the correlated allele frequency model (Falush et al. 2007), which assumes that allele frequencies in different populations are correlated, and an admixture model, allowing for mixed ancestry among individuals. A LOCPRIOR model (Hubisz et al. 2009), which integrates informative data about sampling location (in this case the population of origin in the data set) into the clustering process, was also applied. The analysis was repeated for values of K (i.e. assumed number of clusters) ranging from 1 to 10 with a burn-in length of 10 000 and for 100 000 steps after the burn-in. The number of clusters (K) best fitting the data was determined based on the ∆K method as described by Evanno et al. (2005).
2.4 Analysis of the genetic structure of the Wattkast population
The location and size of all oak trees on the island of Wattkast have been mapped (for details, see Gripenberg and Roslin 2005). Using these data, we examined the spatial and temporal distribution of genetic variation within the population. The analyses targeted the three main questions using the following approaches:
To resolve whether the relatedness among individual trees decreases with increasing distance, or whether the population is admixed, we applied linear regressions of pairwise relatedness coefficients among trees on geographic distances computed with SPAGeDi v.1.4 (Hardy and Vekemans 2002). As the measure of genetic relatedness, we used the kinship coefficient specified by J. Nason (Loiselle et al. 1995). The significance of the regression was tested by comparing observed values to those expected based on 10 000 permutations of individual locations among all individuals. As a complementary approach, we also computed average pairwise kinship coefficients for 10 distance classes, with the maximal distance of each class defined so that the number of pairwise comparisons within each distance class was approximately constant. The upper limits of the distance classes ranged from 162 m to 2863 m, increasing by approximately 100–150 m for classes 1–8 and more steeply for the last two classes. For comparison, acorns from Q. robur have been observed to be commonly dispersed over distances of more than 500 m (Olrik et al. 2012). Observed averages were again compared to permuted values.
To examine whether spatial isolation within the landscape causes observable differences in the levels of inbreeding of individuals, we calculated correlation estimates between measures of individual inbreeding and connectivity. Individual connectivity was described by a simple sum of distances to all other oaks on the island, as well as with a connectivity metric adopted from Tack et al. (2010). Here, tree-level connectivity increases with decreasing distance to neighboring trees and with increasing neighbor size (for details, see Tack et al. 2010). Individual inbreeding was described by uncorrected homozygosity and internal relatedness (IR). Uncorrected homozygosity is simply the proportion of homozygous loci, whereas IR incorporates allele frequencies into the measure. IR was calculated as described by Aparicio et al. (2006), and the allele frequencies required for the calculation were calculated using GENEPOP 4.2 (Rousset 2008).
To test whether cohorts of juvenile and adult trees differ with respect to genetic diversity and identity – potentially indicating temporal changes in dispersal conditions or selection between age classes – we compared the levels of genetic variation (A, He, and Ho) in juvenile and adult cohorts, calculated correlations between tree size and the two measures of individual inbreeding (described above), and estimated the differentiation between juvenile and adult trees with an AMOVA. The partitioning of the trees into juveniles and adults was based on the size distribution of the trees to create two sets of approximately equal size, with the limit set at a circumference of 15 cm at the base of the trunk. This resulted in sample sizes of n = 103 for the juvenile trees and n = 91 for the adult trees. The analysis was implemented in Arlequin, and the significance of the fixation index was tested with 10 000 permutations of individual genotypes among populations. All correlations were calculated in R v.2.15.3 (R Core Team 2013).
3 Results
3.1 Genetic variation and differentiation among the three populations
The 15 microsatellite loci examined showed varying levels of polymorphism. The number of different alleles detected ranged from 3 (at locus ssrQpZAG15 in Salo) to 20.88 (at locus ssrQrZAG 11 in Inkoo after rarefaction; Table 1). Average allelic richness was highest within the Inkoo population, while the Wattkast and Salo populations showed comparable levels of genetic diversity. The average allelic richness varied between 9.37 in Wattkast and 13.44 in Inkoo, and the average expected heterozygosity over all loci between 0.72 in Salo and 0.82 in Inkoo (Table 1).
| Table 1. Genetic variation (number of alleles (Â35 or A), expected heterozygosity (He), and observed heterozygosity (Ho)) at 15 microsatellite loci in the populations of Wattkast, Inkoo and Salo. For the Salo population, data is missing for locus ssrQrZAG 108. For the Wattkast and Inkoo populations, Â35 refers to the expected number of alleles after rarefaction to a random sample of 35 individuals. | |||||||||
| Wattkast | Inkoo | Salo | |||||||
| Locus | Â35 | He | Ho | Â35 | He | Ho | A | He | Ho |
| ssrQpZAG1101 | 8.53 | 0.71 | 0.50 | 13.18 | 0.66 | 0.66 | 11 | 0.70 | 0.79 |
| ssrQpZAG151 | 6.08 | 0.68 | 0.60 | 8.38 | 0.52 | 0.53 | 3 | 0.25 | 0.09 |
| ssrQpZAG1/51 | 7.38 | 0.72 | 0.57 | 10.44 | 0.88 | 0.95 | 11 | 0.88 | 0.85 |
| ssrQpZAG161 | 11.64 | 0.78 | 0.72 | 15.56 | 0.91 | 0.89 | 13 | 0.86 | 1.00 |
| ssrQpZAG361 | 9.66 | 0.81 | 0.64 | 10.30 | 0.85 | 0.82 | 9 | 0.83 | 0.97 |
| ssrQpZAG91 | 9.39 | 0.81 | 0.75 | 9.95 | 0.87 | 0.77 | 11 | 0.73 | 0.74 |
| ssrQpZAG1041 | 11.43 | 0.83 | 0.80 | 18.92 | 0.90 | 0.88 | 14 | 0.90 | 0.90 |
| MSQ132 | 5.45 | 0.27 | 0.25 | 9.03 | 0.70 | 0.67 | 5 | 0.70 | 0.58 |
| MSQ42 | 8.07 | 0.74 | 0.31 | 7.76 | 0.83 | 0.62 | 5 | 0.75 | 0.72 |
| ssrQrZAG 1013 | 7.60 | 0.71 | 0.60 | 15.71 | 0.88 | 0.85 | 11 | 0.81 | 0.78 |
| ssrQrZAG 1083 | 8.51 | 0.70 | 0.65 | 13.34 | 0.74 | 0.60 | - | - | - |
| ssrQrZAG 113 | 13.34 | 0.88 | 0.75 | 20.88 | 0.91 | 0.88 | 15 | 0.90 | 0.91 |
| ssrQrZAG 1123 | 8.29 | 0.70 | 0.68 | 16.09 | 0.91 | 0.97 | 11 | 0.84 | 0.91 |
| ssrQrZAG 73 | 11.16 | 0.85 | 0.80 | 15.73 | 0.90 | 0.90 | 10 | 0.86 | 0.91 |
| ssrQrZAG 873 | 13.89 | 0.86 | 0.87 | 16.32 | 0.90 | 0.89 | 13 | 0.86 | 1.00 |
| Mean | 9.37 | 0.74 | 0.63 | 13.44 | 0.82 | 0.79 | 10.14 | 0.72 | 0.80 |
| s.d. | 2.50 | 0.15 | 0.17 | 4.00 | 0.12 | 0.14 | 3.55 | 0.26 | 0.24 |
| 1 Reference: Steinkellner et al. 1997. 2 Reference: Dow et al. 1995. 3 Reference: Kampfer et al. 1998. | |||||||||
Standard AMOVA showed that the majority of the variation occurred within populations (88.3%). Yet, significant genetic differentiation was found between populations (11.7%, or FST = 0.12, P < 0.001).
The STRUCTURE analysis showed a clear distinction between the Wattkast population and the other two populations when the number of clusters (K) was set at 2 (Fig. 2). This value of K = 2 was also identified as the optimal number of clusters by the ∆K method (Fig. 2). At K = 3, two clusters were identified within Wattkast, while Inkoo and Salo still appeared undifferentiated (Fig. 2). At K = 4, the analysis assigned most of the individual trees correctly into their original populations but still identified two distinct groups within the Wattkast population (Fig. 2).
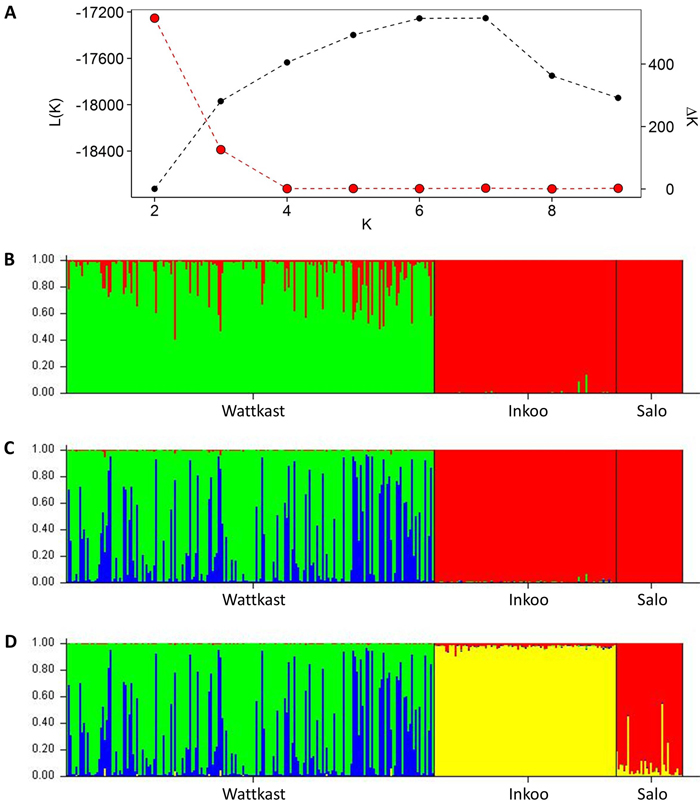
Fig. 2. Inference of genetic clusters within the populations of study based on the population assignment analysis implemented using the software STRUCTURE. Shown are the log-likelihood values of the data given a number of clusters (K) assumed (L(K); black dots in panel A) and the rate of change of L(K) (∆K; red dots in panel A). Bar plots in panels B–D show the results of the simulation for given value of K; (B) K = 2; (C) K = 3; (D) K = 4. Here, each vertical bar represents an individual, the different colors represent the genetic groups identified by the analysis, and the coloration of each bar indicates the probability with which an individual can be assigned to a particular ancestry. The three populations sampled are separated by black vertical lines.
3.2 Genetic structure of the Wattkast population
Within the Wattkast population, the correlation between the genetic relatedness and geographic distance among pairs of individuals was statistically significant (slope = −1.8E−05 ± 9.3E−07, P < 0.001), indicating that trees that grow close to each other are genetically more similar. The same pattern was suggested by the analysis performed over ten distance classes: as the upper limit of the distance class increased, the average pairwise relatedness within the class decreased (Fig. 3). Average values of the pairwise kinship coefficients were significantly greater than expected in a random population (P(obs > exp) < 0.05) in the first three distance classes (pairwise distances up to 371 m) and significantly smaller (P(obs < exp) < 0.05) in the last five classes (pairwise distances 625–2863 m).
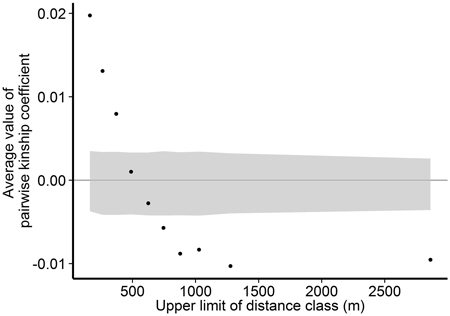
Fig. 3. Associations between genetic relatedness and geographic distance among pairs of individual trees on Wattkast. Black dots show average values of observed pairwise kinship coefficients within 10 distance classes, and grey area shows 95% confidence interval of values derived from permutations of individual locations among all individuals.
Spatial connectivity had no detectable effect on either measure of individual inbreeding (Fig. 4A–B and 4D–E), suggesting that the spatial arrangement of the landscape has not resulted in increased levels of inbreeding among individuals.
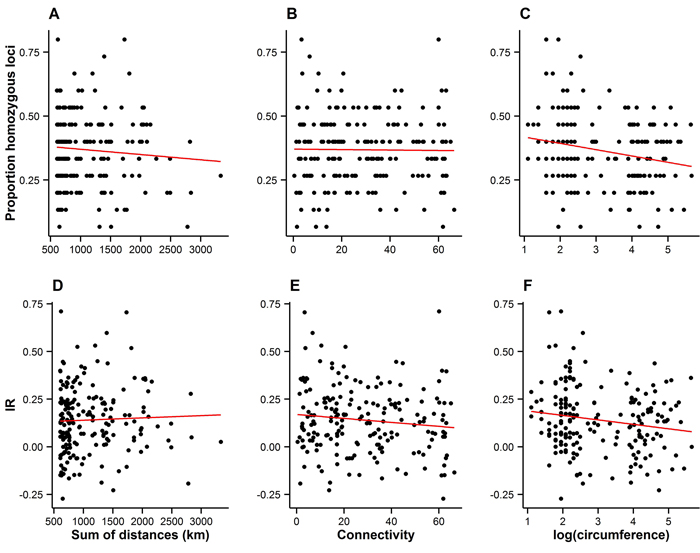
Fig. 4. Measures of individual inbreeding (proportion homozygous loci, A–C, and internal relatedness (IR), D–E) plotted against the connectivity (A–B and D–E), and the size of trees on Wattkast (natural logarithm of circumference; C and F). Red lines represent lines of best fit. Statistically significant associations were found between the proportion of homozygous loci and tree size (C; slope = −0.02 ± 0.008, P = 0.002) and between IR and tree size (F; slope = −0.02±0.01, P = 0.02).
Bigger trees were characterized by higher heterozygosity than smaller trees (Fig. 4C and 4F). A comparison of the average allelic richness and heterozygosity between the juvenile and adult trees also suggested some loss of genetic variation in the younger generation, although these patterns were not statistically significant (Fig. 5). However, an analysis of molecular variance confirmed a slight but statistically significant differentiation between the two age groups (FST = 0.004, P = 0.02).
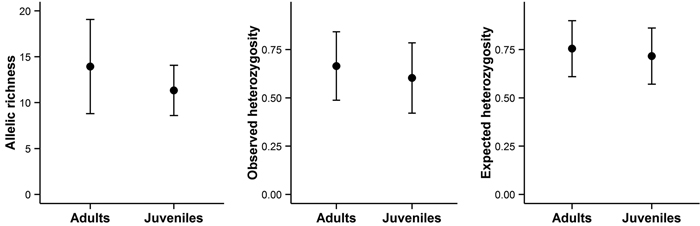
Fig. 5. Allelic richness, observed heterozygosity, and expected heterozygosity in adult and juvenile trees on Wattkast. Values represent the average across all loci ± s.d. Note that none of the differences was statistically significant (ANOVA, P > 0.05 for all panels A–C).
4 Discussion
In this study, we detected genetic differentiation within Finnish oaks at both regional and landscape scales. At the regional scale, we observed high variation within populations but also high differentiation among populations, compatible with the expectations for a long-lived tree species at its range margin. We also detected spatial and temporal differentiation within one population analyzed at the landscape scale, indicative of landscape-scale drivers of population genetic structure.
4.1 Regional differentiation among oak populations
Among Finnish oak populations, the majority of genetic variation (88.3%) occurred within populations, agreeing with patterns found among other Quercus species (Kremer and Petit 1993; Lind and Gailing 2013). However, the level of population differentiation we detected was statistically significant, and the three populations appeared distinct in the STRUCTURE analysis. In particular, Wattkast differed from the two mainland populations. Moreover, the level of genetic differentiation detected (FST = 0.12) is markedly high as compared to that observed in oak populations closer to the core of their distribution. For comparison, using 14 microsatellite loci, Neophytou et al. (2010) observed a notably lower FST of 0.04 among three Q. robur populations located in Germany, Greece and Bulgaria, respectively, i.e. across a geographic range much larger than the one covered by the present study. FST-values lower or only slightly higher than the one observed here have in fact been recorded at the level of different species, e.g. FST of 0.10, 0.11, and 0.17 between Q. robur and Q. petraea (Matt) Liebl., Q. pubescens Willd., and Q. frainetto Ten., respectively, in Romania as based on six microsatellite loci (Curtu et al. 2007).
The patterns observed here for nuclear microsatellite loci seem largely consistent with those previously reported for chloroplast DNA: differentiation among Q. robur populations in northern Europe is on average higher than in central Europe (Petit et al. 2002b; Vakkari et al. 2006). Together with these earlier findings, our results support the theory of higher genetic differentiation among populations at species’ geographic range margins (Eckert et al. 2008). Consistent with this theory, the amount of genetic variation within Finnish oak populations has also been found to be lower than that of central populations (Vakkari et al. 2006; Pohjanmies et al. 2015). Congruous patterns have also been reported for other tree species in Finland, e.g. European white elm (Vakkari et al. 2009).
Beyond geographic marginality, the comparatively high differentiation among Q. robur populations in northern Europe may to some extent be attributable to the absence of Q. petraea and consequent interspecific gene flow as well as to the extensive fragmentation of oak forests in the region (Petit et al. 2002b; Vakkari et al. 2006; Gugerli et al. 2007). Due to their biology, phylogeography, and large range, Quercus species may be relatively resistant to fragmentation. For example, (Petit et al. 2002a) detected no significant effect of fragmentation on the chloroplast DNA diversity of four different Quercus species in France. Similarly, Gerber et al. (2014) found outside gene flow to be high even in geographically isolated stands of Q. robur and Q. petraea in Europe. However, Ortego et al. (2015) found high differentiation (pairwise FST values of up to 0.27) among populations of Q. segoviensis Liebm. at its southern range margin in Nicaragua, and identified geographic isolation of the populations as the main factor explaining the observed genetic structure. As suggested by Ortego et al. (2015), it is possible that the effects of habitat fragmentation are accentuated in oak populations at the range margin of the species. In Scandinavia, Quercus species have declined in abundance considerably over the last 4000 years and, with the expansion of forestry and agriculture, the decline has been particularly rapid since the 18th century (Lindbladh and Foster 2010). The location of the remaining populations at the margin of the species’ range may magnify the effects of habitat fragmentation and loss of gene flow, resulting in the erosion of genetic diversity in Finnish oak populations (Vakkari et al. 2006).
4.2 Landscape-level differentiation within an oak population
We observed some spatial and temporal differentiation within the oak population on Wattkast. While the spatial isolation of individual trees had no detectable effect on individual-level inbreeding, the genetic relatedness among pairs of individuals showed a clearly decreasing pattern with increasing geographic distance. This isolation by distance identifies the population as not being completely admixed, which was also suggested by the results of the population assignment analysis. Genetic relatedness among individuals became lower than expected with distances of ca 600 m or more, corresponding to the scale of commonly observed acorn dispersal distances of 500 m (Olrik et al. 2012). Over short distances, genetic relatedness among individuals was actually higher than expected, and this effect was somewhat stronger than anticipated on the basis of the dispersal and colonization ability of Q. robur (Ducousso et al. 1993). For example, Streiff et al. (1998) found no detectable spatial genetic structure in a natural Q. robur stand in France. However, patterns similar to the ones uncovered by us were found by Cottrell et al. (2003) in oak woods in Britain, and these authors suggested that they may be the result of historic human-influenced colonization dynamics (e.g. clustered planting of related seed material), the traces of which may still be observable today due to the slow generation turnover in oaks.
In addition to the spatial structuring, we observed differentiation between the adult and juvenile trees and a loss of genetic variation in the juvenile cohort. The differentiation between the two cohorts and the higher genetic richness in adults may indicate that selection favors certain genotypes and/or heterozygotes, the relative frequency of which is thereby increased among adult trees. However, the loss of genetic variation in the juvenile trees as compared with adult trees may also be explained by reduced gene flow, either from outside the population (as due to regional-level fragmentation), or within the population (as due to uneven dispersal from adult trees). There is a large cluster of trees on the north-western side of the small bay cutting into the island (cf. Fig. 1B), and the activity of seed-dispersing animals may also be centered on this part of the island. Movement patterns of seed-dispersing animals have been found to be an important factor structuring the distribution of Q. robur (Frost and Rydin 2000). Indeed, Kettunen (2010) used a transplant experiment to demonstrate that oaks are absent from several inherently suitable habitats within the island of Wattkast, and inferred that the distribution of oaks within the landscape is limited by the trees’ dispersal ability. The movements of seed-dispersing animals, as combined with human-induced disturbances in both past and present time, may thus be the main factors behind the current distribution of oaks within the island (Kettunen 2010).
Overall, it is likely that the sub-structuring of the Wattkast oak population is due to dispersal patterns combined with influences of human activities on the island. The landscape of Wattkast has experienced intensifying human disturbance since the 15th century up to recent decades, when human land use on the island has again become less extensive (Zilliacus 2001). In the past, the island has been inhabited by more than 80 people with agriculture as their main source of livelihood. When the human population was growing, arable land on the island was scarce and even small and scattered patches of land suitable for farming were cleared. The remaining woods and reeds were grazed by livestock, and small-scale forestry was also practiced. Today, the population of Wattkast is less than 30 people, and agriculture and forestry are considerably less extensive (Zilliacus 2001). In conclusion, the observed population sub-structuring of the Wattkast oak population should not be assumed to reflect long-term processes in equilibrium, but also disequilibrium following past and present landscape dynamics. The current oak population may still be recovering from the previously more extensive land use.
Taken together, the results of this study indicate that Q. robur fulfils the expectation of the central-marginal hypothesis of high differentiation among marginal populations. Thus, even long-lived, outcrossing tree species may be vulnerable to genetic impoverishment at their range margins – and given their long generation time, Finnish oak populations may still be adjusting to the drastic habitat changes of the past centuries. Preservation of genetic variation within the remaining stands is thus an important factor in the conservation of Q. robur at its northern range margin – and the many taxa associated with it (Pohjanmies et al. 2015).
Acknowledgements
The study was supported by the Academy of Finland (grant number 138346 to T. Roslin).
References
Allendorf F., Luikart G. (2007). Conservation and the genetics of populations. Blackwell Publishing, Oxford, UK. 642 p.
Aparicio J.M., Ortego J., Cordero P.J. (2006). What should we weigh to estimate heterozygosity, alleles or loci? Molecular Ecology 15: 4659–4665. http://dx.doi.org/10.1111/j.1365-294X.2006.03111.x.
Cottrell J., Munro R.C., Tabbener H.E., Milner A.D., Forrest G.I., Lowe A.J. (2003). Comparison of fine-scale genetic structure using nuclear microsatellites within two British oakwoods differing in population history. Forest Ecology and Management 176: 287–303. http://dx.doi.org/10.1016/S0378-1127(02)00289-X.
Curtu A.L., Gailing O., Leinemann L, Finkeldey R. (2007). Genetic variation and differentiation within a natural community of five oak species (Quercus spp.). Plant Biology 9: 116–126. http://dx.doi.org/10.1055/s-2006-924542.
Dow B.D., Ashley M.V., Howe H.F. (1995). Characterization of highly variable (GA/CT)n microsatellites in the bur oak, Quercus macrocarpa. Theoretical and Applied Genetics 91: 137–141. http://dx.doi.org/10.1007/BF00220870.
Ducousso A., Michaud H., Lumaret R. (1993). Reproduction and gene flow in the genus Quercus L. Annals of Forest Science 50: 91–106. http://dx.doi.org/10.1051/forest:19930708.
Eckert C.G., Samis K.E., Lougheed S.C. (2008). Genetic variation across species’ geographical ranges: the central-marginal hypothesis and beyond. Molecular Ecology 17: 1170–1188. http://dx.doi.org/10.1111/j.1365-294X.2007.03659.x.
Ellison A.M., Bank M.S., Clinton B.D., Colburn E.A., Elliott K., Ford C.R., Foster D.R., Kloeppel B.D., Knoepp J.D., Lovett G.M., Mohan J., Orwig D.A., Rodenhouse N.L., Sobczak W.V., Stinson K.A., Stone J.K., Swan C.M., Thompson J., Von Holle B., Webster J.R. (2005). Loss of foundation species: consequences for the structure and dynamics of forested ecosystems. Frontiers in Ecology and the Environment 3: 479–486. http://dx.doi.org/10.1890/1540-9295(2005)003[0479:LOFSCF]2.0.CO;2.
Evanno G., Regnaut S., Goudet J. (2005). Detecting the number of clusters of individuals using the software Structure: a simulation study. Molecular Ecology 14: 2611–2620. http://dx.doi.org/10.1111/j.1365-294X.2005.02553.x.
Excoffier L., Lischer H.E.L. (2010). Arlequin suite ver 3.5: a new series of programs to perform population genetics analyses under Linux and Windows. Molecular Ecology Resources 10: 564–567. http://dx.doi.org/10.1111/j.1755-0998.2010.02847.x.
Excoffier L., Smouse P.E., Quattro J.M. (1992). Analysis of molecular variance inferred from metric distances among DNA haplotypes: application to human mitochondrial DNA. Genetics 131: 479–491.
Falush D., Stephens M., Pritchard J.K. (2007). Inference of population structure using multilocus genotype data: dominant markers and null alleles. Molecular Ecology Notes 7: 574–578. http://dx.doi.org/10.1111/j.1471-8286.2007.01758.x.
Ferris C., King R.A., Väinölä R., Hewitt G.M. (1998). Chloroplast DNA recognizes three refugial sources of European oaks and suggests independent eastern and western immigrations to Finland. Heredity 80: 584–593. http://dx.doi.org/10.1046/j.1365-2540.1998.00342.x.
Frost I., Rydin H. (2000). Spatial pattern and size distribution of the animal-dispersed tree Quercus robur in two spruce-dominated forests. Écoscience 7 :38–44.
Gerber S., Chadœuf J., Gugerli F., Lascoux M., Buiteveld J., Cottrell J., Dounavi A., Fineschi S., Forrest L.L., Fogelqvist J., Goicoechea P.G., Jensen J.S., Salvini D., Vendramin G.G., Kremer A. (2014). High rates of gene flow by pollen and seed in oak populations across Europe. PLoS ONE 9: e85130. http://dx.doi.org/10.1371/journal.pone.0085130.
Gripenberg S., Roslin T. (2005). Host plants as islands: resource quality and spatial setting as determinants of insect distribution. Annales Zoologici Fennici 42: 335–345. http://dx.doi.org/10.1111/j.1461-0248.2009.01433.x.
Gugerli F., Walser J.C., Dounavi K., Holderegger R., Finkeldey R. (2007). Coincidence of small-scale spatial discontinuities in leaf morphology and nuclear microsatellite variation of Quercus petraea and Q. robur in a mixed forest. Annals of Botany 99: 713–722. http://dx.doi.org/10.1093/aob/mcm006.
Hamrick J.L. (2004). Response of forest trees to global environmental changes. Forest Ecology and Management 197: 323–335. http://dx.doi.org/10.1016/j.foreco.2004.05.023.
Hamrick J.L., Godt M.J.W., Sherman-Broyles S.L. (1992). Factors influencing levels of genetic diversity in woody plant species. New Forests 6: 95–124. http://dx.doi.org/10.1007/BF00120641.
Hardwick B., Kaartinen R., Koponen M., Roslin T. (2015). A rapid assessment of a poorly known insect group. Insect Conservation and Diversity 9(1): 49–62. http://dx.doi.org/10.1111/icad.12142.
Hardy O.J., Vekemans X. (2002). SPAGeDi: a versatile computer program to analyse spatial genetic structure at the individual or population levels. Molecular Ecology Notes 2: 618–620. http://dx.doi.org/10.1046/j.1471-8286.2002.00305.x.
Hersch-Green E.I., Turley N.E., Johnson M.T.J. (2011). Community genetics: what have we accomplished and where should we be going? Philosophical Transactions of the Royal Society of London. Series B: Biological Sciences 366: 1453–1460. http://dx.doi.org/10.1098/rstb.2010.0331.
Honnay O., Jacquemyn H. (2007). Susceptibility of common and rare plant species to the genetic consequences of habitat fragmentation. Conservation Biology 21: 823–831. http://dx.doi.org/10.1111/j.1523-1739.2006.00646.x.
Hubisz M.J., Falush D., Stephens M., Pritchard J.K. (2009). Inferring weak population structure with the assistance of sample group information. Molecular Ecology Resources 9: 1322–1332. http://dx.doi.org/10.1111/j.1755-0998.2009.02591.x.
Hurlbert S.H. (1971). The nonconcept of species diversity: a critique and alternative parameters. Ecology 52: 577–586. http://dx.doi.org/10.2307/1934145.
Kampfer S., Lexer C., Glössl J., Steinkellner H. (1998). Characterization of (GA)n Microsatellite loci from Quercus Robur. Hereditas 129: 183–186. http://dx.doi.org/10.1111/j.1601-5223.1998.00183.x.
Kettunen H. (2010). Tammen alueellisen levinneisyyden rajoitteet: tapaustutkimus Länsi-Turunmaalla. [Constraints to the regional distribution of oak: a case study in south-western Finland]. University of Helsinki, Helsinki, Finland. 37 p.
Kremer A., Petit R.J. (1993). Gene diversity in natural populations of oak species. Annals of Forest Science 50: 186–202. http://dx.doi.org/10.1051/forest:19930717.
Leberg P.L. (2008). Estimating allelic richness: effects of sample size and bottlenecks. Molecular Ecology 11: 2445–2449. http://dx.doi.org/10.1046/j.1365-294X.2002.01612.x.
Lind J.F., Gailing O. (2013). Genetic structure of Quercus rubra L. and Quercus ellipsoidalis E.J. Hill populations at gene-based EST-SSR and nuclear SSR markers. Tree Genetics & Genomes 9: 707–722. http://dx.doi.org/10.1007/s11295-012-0586-4.
Lindbladh M., Foster D.R. (2010). Dynamics of long-lived foundation species: the history of Quercus in southern Scandinavia. Journal of Ecology 98: 1330–1345. http://dx.doi.org/10.1111/j.1365-2745.2010.01733.x.
Loiselle B.A., Sork V.L., Nason J., Graham C. (1995). Spatial genetic structure of a tropical understory shrub, Psychotria officinalis (Rubiaceae). American Journal of Botany 82: 1420–1425.
Neophytou C., Aravanopoulos F.A. S. Fink, Dounavi A. (2010). Detecting interspecific and geographic differentiation patterns in two interfertile oak species (Quercus petraea (Matt.) Liebl. and Q. robur L.) using small sets of microsatellite markers. Forest Ecology and Management 259: 2026–2035. http://dx.doi.org/10.1016/j.foreco.2010.02.013.
Ollinmaa P.J. (1952). Jalot lehtipuumme luontaisina ja viljeltyinä. [Natural and cultivated hardwood trees in Finland]. Silva Fennica 77: 1–73. http://dx.doi.org/10.14214/sf.a9099.
Olrik D.C., Hauser T.P., Kjaer E.D. (2012). Natural colonisation of an open area by Quercus robur L. – From where did the vectors disperse the seed? Scandinavian Journal of Forest Research 27: 350–360. http://dx.doi.org/10.1080/02827581.2011.644318.
Ortego J., Bonal R., Muñoz A., Espelta J.M. (2015). Living on the edge: the role of geography and environment in structuring genetic variation in the southernmost populations of a tropical oak. Plant Biology 17: 676–683. http://dx.doi.org/10.1111/plb.12272.
Petit R.J., Latouche-Hallé C., Pemonge M.-H., Kremer A. (2002a). Chloroplast DNA variation of oaks in France and the influence of forest fragmentation on genetic diversity. Forest Ecology and Management 156: 115–129. http://dx.doi.org/10.1016/S0378-1127(01)00638-7.
Petit R.J., Csaikl U.M., Bordács S., Burg K., Coart E., Cottrell J., van Dam B., Deans J.D., Dumolin-Lapègue S., Fineschi S., Finkeldey R., Gillies A., Glaz I., Goicoechea P.G., Jensen J.S., König A.O., Lowe A.J., Madsen S.F., Mátyás G., Munro R.C., Olalde M., Pemonge M.-H., Popescu F., Slade D., Tabbener H., Taurchini D., de Vries S.G.M., Ziegenhagen B., Kremer A. (2002b). Chloroplast DNA variation in European white oaks: phylogeography and patterns of diversity based on data from over 2600 populations. Forest Ecology and Management 156: 5–26. http://dx.doi.org/10.1016/S0378-1127(01)00645-4.
Pimm S.L., Raven P. (2000). Biodiversity. Extinction by numbers. Nature 403: 843–845. http://dx.doi.org/10.1038/35002708.
Pohjanmies T., Tack A.J.M., Pulkkinen P., Elshibli S., Vakkari P., Roslin T. (2015). Genetic diversity and connectivity shape herbivore load within an oak population at its range limit. Ecosphere 6: art 101. http://dx.doi.org/10.1890/ES14-00549.1.
Pritchard J.K., Stephens M., Donnelly P. (2000). Inference of population structure using multilocus genotype data. Genetics 155: 945–959.
R Core Team. (2013). R: a language and environment for statistical computing. R Foundation for Statistical Computing, Vienna, Austria.
Rassi P., Hyvärinen E., Juslén A., Mannerkoski I. (ed.) (2010). The 2010 red list of Finnish species. Ympäristöministeriö & Suomen ympäristökeskus, Helsinki, Finland. 685 p.
Reed D.H., Frankham R. (2003). Correlation between fitness and genetic diversity. Conservation Biology 17: 230–237. http://dx.doi.org/10.1046/j.1523-1739.2003.01236.x.
Rousset F. (2008). GENEPOP’007: a complete re-implementation of the Genepop software for Windows and Linux. Molecular Ecology Resources 8: 103–106. http://dx.doi.org/10.1111/j.1471-8286.2007.01931.x.
Southwood T.R.E. (1961). The number of species of insect associated with various trees. The Journal of Animal Ecology 30: 1–8.
Steinkellner H., Fluch S., Turetschek E., Lexer C., Streiff R., Kremer A., Burg K., Glössl J. (1997). Identification and characterization of (GA/CT)n-microsatellite loci from Quercus petraea. Plant Molecular Biology 33: 1093–1096. http://dx.doi.org/10.1023/A:1005736722794.
Streiff R., Labbe T., Bacilieri R., Steinkellner H., Glössl J., Kremer A. (1998). Within-population genetic structure in Quercus robur L. and Quercus petraea (Matt.) Liebl. assessed with isozymes and microsatellites. Molecular Ecology 7: 317–328. http://dx.doi.org/10.1046/j.1365-294x.1998.00360.x.
Tack A.J.M., Ovaskainen O., Pulkkinen P., Roslin T. (2010). Spatial location dominates over host plant genotype in structuring an herbivore community. Ecology 91: 2660–2672. http://dx.doi.org/10.1890/09-1027.1.
Vakkari P., Blom A., Rusanen M., Raisio J., Toivonen H. (2006). Genetic variability of fragmented stands of pedunculate oak (Quercus robur) in Finland. Genetica 127: 231–241. http://dx.doi.org/10.1007/s10709-005-4014-7.
Vakkari P., Rusanen M., Kärkkäinen K. (2009). High genetic differentiation in marginal populations of European white elm (Ulmus laevis). Silva Fennica 43(2): 185–196. http://dx.doi.org/10.14214/sf.205.
Wimp G.M., Young W.P., Woolbright S.A., Martinsen G.D., Keim P., Whitham T.G. (2004). Conserving plant genetic diversity for dependent animal communities. Ecology Letters 7: 776–780. http://dx.doi.org/10.1111/j.1461-0248.2004.00635.x.
Zilliacus L. (2001). Visst om Wattkast. [Wattkast described]. Unpublished manuscript.
Total of 53 references.
