Marjut Turtiainen  ,
Jari Miina,
Kauko Salo,
Juha-Pekka Hotanen
,
Jari Miina,
Kauko Salo,
Juha-Pekka Hotanen
Modelling the coverage and annual variation in bilberry yield in Finland
Turtiainen M., Miina J., Salo K., Hotanen J.-P. (2016). Modelling the coverage and annual variation in bilberry yield in Finland. Silva Fennica vol. 50 no. 4 article id 1573. https://doi.org/10.14214/sf.1573
Highlights
- The highest bilberry coverage was found in mesic heath forests and fell forests
- On peatlands the coverage was, on average, lower than on mineral soil sites
- The approach introduced in this study to calculating annual berry yield indices is a promising way for estimating total annual bilberry yields over a given period of time.
Abstract
The coverage of bilberry (Vaccinium myrtillus L.) was modelled as a function of site and stand characteristics using the permanent sample plots of the National Forest Inventory (NFI) (Model 1). The sample sites consisted of mineral soil forests as well as fells and peatland sites. Annual variation in the bilberry yield (Model 2) was analysed based on measurements over 2001–2014 in the permanent sample plots (so-called MASI plots) in various areas of Finland. We derived annual bilberry yield indices from the year effects of Model 2 and investigated whether these indices could be used to estimate annual variation in bilberry crops in Finland. The highest bilberry coverage was found in mesic heath forests and fell forests. On peatlands the coverage was, on average, lower than on mineral soil sites; the peatland sites with most bilberry coverage were meso-oligotrophic and oligotrophic spruce mires and oligotrophic pine mires. Our bilberry yield indices showed similar variation to those derived from the mean annual berry yields reported and calculated earlier using the MASI plots; the correlation between the indices was 0.795. This approach to calculating annual berry yield indices is a promising way for estimating total annual bilberry yields over a given period of time. Models 1 and 2 can be used in conjunction with the Miina et al.’s (2009) bilberry yield model when bilberry coverage, average annual yield and annual variation in the yield are to be predicted in forest planning.
Keywords
abundance;
berry yield;
generalised linear mixed model;
Vaccinium myrtillus L.
-
Turtiainen,
University of Eastern Finland, School of Forest Sciences, P.O. Box 111, FI-80101 Joensuu, Finland
E-mail
marjut.turtiainen@uef.fi
- Miina, Natural Resources Institute Finland (Luke), Management and Production of Renewable Resources, Box 68, FI-80101 Joensuu, Finland E-mail jari.miina@luke.fi
- Salo, Natural Resources Institute Finland (Luke), Bio-based Business and Industry, Box 68, FI-80101 Joensuu, Finland E-mail kauko.salo@luke.fi
- Hotanen, Natural Resources Institute Finland (Luke), Management and Production of Renewable Resources, Box 68, FI-80101 Joensuu, Finland E-mail juha-pekka.hotanen@luke.fi
Received 25 February 2016 Accepted 1 September 2016 Published 8 September 2016
Views 114077
Available at https://doi.org/10.14214/sf.1573 | Download PDF

Supplementary Files
1 Introduction
Bilberry (Vaccinium myrtillus L.) is one of the most abundant wild berry species in Finland (Salemaa 2000). It has adapted to a wide range of different site and land types in coniferous ecosystems and, as a result, is widely distributed across different parts of Europe and northern Asia (Ritchie 1956; Coudun and Gégout 2007). In North America, there are several species closely related to V. myrtillus (Ritchie 1956).
In Finland, bilberry is typical and abundant especially in conifer heath forests of medium fertility (Laakso et al. 1990; Salemaa 2000). It is also present and producing crops in many marginal forest types (e.g. fell forests), and on pristine and drained peatland sites (Sarasto 1961; Salemaa 2000). It has been estimated that Finnish forests and peatlands could produce an average of about 184 million kg of bilberries annually (Turtiainen et al. 2005, 2007), however wild berry yields vary greatly from year to year due to e.g. frost, pollination success and variation in precipitation and temperature (Raatikainen 1993; Wallenius 1999).
Turtiainen et al. (2011) calibrated the total bilberry yield in an average crop year for different crop years using the inventory data on wild berries (referred to as MASI data; Salo 1999) which was collected from permanent berry sample plots in 1997–2008. The calibration was a two-stage process. First, mean annual national bilberry yields (kg ha–1) were calculated from the numbers of bilberries counted annually on the MASI sample plots and site-specific figures for the fresh weight of a bilberry. The arithmetical mean berry yield was calculated on the basis of mean annual berry yields. Second, the minimum and maximum values from the series of mean annual berry yields for the study period (1997–2008) were divided by the arithmetical mean berry yield and multiplied by 184 million kg (i.e. total berry yield during an average crop year). Turtiainen et al. (2011) thus calculated that total annual bilberry yields in Finland would vary between approximately 90 and 310 million kg.
Picking wild berries is an important forest custom in the northern hemisphere, particularly in the Nordic countries and former territories of the USSR (Lee et al. 2007; Turtiainen and Nuutinen 2012). It is also so that today both the public and private forest landowners place a high value on the multiple-use aspects of forests and objectives other than wood production have got increasing weight in forestry decision-making (Kangas 1998; Rämö et al. 2013; Filyushkina et al. 2016). Consequently, production functions are needed for non-wood forest products and services so that the various aspects of forest use – both timber and non-timber – can be integrated into forest planning calculations (Borges et al. 2014). In these functions, site type and stand characteristics are the most reasonable predictors as they are known in forest planning systems.
A number of models for the species Vaccinium have been developed in different countries. For example, Coudun and Gégout (2007) used climatic and edaphic factors to help predicting the abundance of bilberry in French’s forests. In Canada, models for lowbush blueberries (Hall et al. 1982) and Vaccinium vitis-idaea L. (Krebs et al. 2009) were developed to predict the yield using climatic variables. In Sweden, various ecosystem services (including bilberry production) were modelled using both stand characteristics and climatic and edaphic factors as predictors (Gamfeldt et al. 2013). However, none of the models mentioned above are suitable for forest planning calculations because of the predictors they employ.
In Finland, several models for the yields of bilberry and cowberry (V. vitis-idaea L.) have been developed (Ihalainen and Pukkala 2001; Ihalainen et al. 2002, 2003, 2005; Miina et al. 2009; Turtiainen et al. 2013). All these models have been prepared for forest planning purposes. So far only Miina et al. (2009) have taken into account the annual variation in bilberry yields using the MASI sample plot measurements from 2001–2007. The models of Miina et al. (2009) predicted bilberry coverage as a function of site fertility and stand characteristics, and used these results to predict berry yield and annual variation in berry yield as a function of bilberry coverage and stand characteristics. The coverage model can be applied to mineral soil sites throughout the country but the yield model is based on regional data from North Karelia, Finland.
In this study, the work of Miina et al. (2009) was continued so that the model for the coverage of bilberry considers not only mineral soil sites but also peatland sites and fells (Model 1). Further, the annual variation in bilberry yield during 2001–2014 (Model 2) was modelled using a considerably longer time series of data from the MASI sample plots than in the earlier study by Miina et al. (2009). Finally, we investigated whether the annual yield indices derived from Model 2 could be used to estimate total annual bilberry crops in Finland for the 2001–2014 period.
2 Materials and methods
2.1 Materials
Data were collected for the percentage coverage of bilberry on the permanent sample plots (300 m2) of the Finnish National Forest Inventory (NFI) in 1995 (so-called PSP3000 data) (Finnish Forest Research Institute 1995). Miina et al. (2009) and Turtiainen et al. (2013) used the same data in their studies and have described the inventory method in detail. Sample plots representing seven different categories (a–g) were used in this study. The categories were initially developed for modelling the coverage of cowberry and were selected on the basis that cowberry occurs frequently and abundantly on all of them (Turtiainen et al. 2013). As bilberry and cowberry very often grow side by side, at the same sites, it seemed reasonable to use the same categories in this study.
Categories (a–e) pertained to forest land and were as follows: a) mineral soils, b) spruce mires – transforming phase, c) spruce mires – transformed phase, d) pine mires – transforming phase, and e) pine mires – transformed phase. In the case of poorly productive land and unproductive (waste) land, only fell forests (f) and summits (g) (i.e. site quality class VIII; Finnish Forest Research Institute 1995; Tomppo et al. 2011) were considered in the modelling (Supplementary file 1). It is worth noting that when talking briefly about fells, both fell forests and summits are meant.
A total of 2515 sample plots from the PSP3000 data were included in the dataset for this study. For all sample plots bilberry coverage was estimated from four 2 m2 quadrates; the averages were used as the sample plot-wise (stand-wise) estimates of abundance. Due to the heterogeneity of the sample plot, 11% of the plots were divided into two or three stands. As a result, 2801 stands were included in the analyses (Suppl. file 1). The stand characteristics and mean bilberry coverage were calculated for all stands and used in the modelling. A description of stand characteristics by categories is given by Turtiainen et al. (2013, p. 6). The data had a hierarchical structure because the sample plots were located in 983 clusters, which in turn were located in 367 municipalities and 14 forestry centre regions.
The annual variation in bilberry yield was analysed using MASI data for the 2001–2014 period (Salo 1999). The MASI inventory reports annual counts of ripe bilberries on five permanent 1 m2 quadrates located in forest stands which had been found to be good growing sites for the species. The mean annual number of ripe bilberries and the mean bilberry coverage for these quadrates were used in modelling. The dataset included 306 observations of mean annual bilberry numbers in 50 stands (Supplementary file 2). Stands were characterised in terms of site type, dominant tree species, stand age and basal area. The majority (60%) of stands in the dataset were dominated by pine (Pinus sylvestris L.), 32% were dominated by spruce (Picea abies (L.) Karst.) and the rest by deciduous tree species, mainly birches (Betula pendula Roth, B. pubescens Ehrh.). The stands were located in 29 municipalities and in 13 forestry centre regions.
2.2 Statistical modelling
Models were prepared for the mean percentage bilberry coverage (Model 1) and the mean number of bilberries in the stand (Model 2) using generalised linear mixed models (GLMMs) (Supplementary file 3). Model 1 was expressed using a logit-link function with a binomial response, and Model 2 using a log-link function with a Poisson response.
In Model 1 all the continuous predictors (e.g. stand age and basal area) and categorical predictors (e.g. site quality classes in different categories a–e) had to be logical and statistically significant at the 0.05 level, with no systematic errors in residuals. The coverage was modelled and the categories were combined as described by Turtiainen et al. (2013) and hence categories (b) and (c) were combined and are later jointly described as ‘spruce mires’; similarly categories (d) and (e) were combined and are jointly described as ‘pine mires’.
In Model 2, bilberry coverage, altitude and mean effective temperature sum were used as potential fixed predictors. The year effects in 2001–2014 were considered using indicator variables as fixed predictors.
We adjusted for the multi-level hierarchy and unbalanced structure of the datasets by including random effects at different levels. We adjusted for over-dispersion in the response variables by adding an additional random term at the bottom level (‘pseudo’ level). The GLMMs were estimated using the glmmPQL function of the R software (R Development Core Team 2012).
2.3 Simulations
The performance of Model 1 was illustrated by predicting the bilberry coverage in various stands whose initial characteristics, development and management were simulated using the Motti stand simulator (Hynynen et al. 2005). The simulated stands were located in southern Finland, with the temperature sum and altitude set at 1200 dd. and 100 m, respectively. We used the same pine and spruce stands representing several site types on mineral soils as Miina et al. (2009), and the same pine stands on pine mires as Turtiainen et al. (2013). We also simulated spruce stands on spruce mires (sites II and III) using the Motti simulator.
2.4 Berry yield indices
Bilberry yield indices were calculated from the year effects in Model 2. The year effects were transformed into exponential form, multiplied by one hundred and scaled to have a mean of 100. The indices obtained in this study were compared with berry yield indices derived from the mean annual berry yields presented by Salo (2015). Salo (2015) calculated a series of mean annual bilberry yields for 1997–2013 using MASI data and the method described by Turtiainen et al. (2011). For the purpose of comparison we also scaled Salo’s (2015) mean annual berry yields to have a mean of 100.
3 Results
3.1 Model for bilberry coverage
In the case of mineral soils, Model 1 for bilberry coverage produced results very similar to those described by Miina et al. (2009); the highest coverage was found on mesic heath forests (site III, Table 1). On sub-xeric heath forests (site IV) and herb-rich heath forests (site II), the coverage was 63% and 57% of that on site III respectively. On rocky and sandy soils (VII) and xeric heath forests (V) the coverage was considerably lower, and on herb-rich forests (I), it was scarce.
| Table 1. The multi-level binomial model (Model 1) estimated for the mean percentage coverage of bilberry on the 2 m2 quadrates in the stands of the PSP3000 data. Sites I–V and VII–VIII refer to different site quality classes (see Suppl. file 1). Mineral soils, spruce mires and pine mires pertain to forest land, i.e. categories (a–e) of this study. | |||||
| Variable | Estimate | Std error | t-value | Odds ratio | p-value |
| Intercept | –4.3356 | 0.0934 | –46.44 | 0.013 | < 0.001 |
| Site (ref. III, mineral soils) a | |||||
| site I, mineral soils | –2.4140 | 0.1708 | –14.14 | 0.089 | < 0.001 |
| site II, mineral soils | –0.5627 | 0.0630 | –8.93 | 0.570 | < 0.001 |
| site IV, mineral soils | –0.4702 | 0.0513 | –9.17 | 0.625 | < 0.001 |
| site V, mineral soils | –1.6286 | 0.1085 | –15.01 | 0.196 | < 0.001 |
| site VII, mineral soils | –1.3500 | 0.2149 | –6.28 | 0.259 | < 0.001 |
| sites ≤ II, spruce mires | –1.1044 | 0.1173 | –9.41 | 0.331 | < 0.001 |
| sites ≤ III, pine mires | –0.4081 | 0.1220 | –3.35 | 0.665 | 0.001 |
| site IV, pine mires | –0.2592 | 0.0812 | –3.19 | 0.772 | 0.002 |
| site V, pine mires | –1.0210 | 0.0922 | –11.08 | 0.360 | < 0.001 |
| site VIII, poorly productive land | 1.1348 | 0.1893 | 6.00 | 3.111 | < 0.001 |
| ArtificialRegen b, mineral soils | –0.2713 | 0.0500 | –5.42 | 0.762 | < 0.001 |
| FormerAgrLand c, mineral soils | –1.7342 | 0.1468 | –11.81 | 0.177 | < 0.001 |
| Spruce d, mineral soils | –0.1196 | 0.0522 | –2.29 | 0.887 | 0.023 |
| Deciduous trees d on sites I and II, mineral soils | –0.7146 | 0.1123 | –6.37 | 0.489 | < 0.001 |
| Deciduous trees d, spruce mires | –0.7355 | 0.1246 | –5.90 | 0.479 | < 0.001 |
| Altitude (m) | 0.0040 | 0.0005 | 8.06 | 1.004 | < 0.001 |
| Altitude2/100 (m), poorly productive and waste land | –0.0004 | 0.0001 | –3.97 | 0.999 | < 0.001 |
| Stand age (a), mineral soils | 0.0094 | 0.0011 | 8.43 | 1.009 | < 0.001 |
| Stand age2/100 (a), mineral soils | –0.0027 | 0.0005 | –5.32 | 0.997 | < 0.001 |
| Stand basal area (m2 ha–1), forest land e | 0.1071 | 0.0055 | 19.35 | 1.113 | < 0.001 |
| Stand basal area2/100 (m2 ha–1), forest land e | –0.2050 | 0.0151 | –13.59 | 0.815 | < 0.001 |
| Variance components at f | |||||
| forestry centre region level | 0.0187 | (14) | |||
| municipality level | 0.1279 | (367) | |||
| cluster level | 0.1328 | (983) | |||
| sample plot level | 0.1585 | (2515) | |||
| stand level (‘pseudo’ level) | 0.4913 | (2801) | |||
| a The parameter estimates of site variables “site III, spruce mires”, “site IV, spruce mires” and “site VIII, waste land” were not statistically significant. b ArtificialRegen (artificial regeneration) is an indicator variable for the regeneration method (ref. natural regeneration). c FormerAgrLand (former agricultural land) is an indicator variable for stand history (ref. former forest). d An indicator variable for the dominant tree species (the reference is other tree species). e In this context, forest land refers to categories (a–e) of this study. f The number of observations at each level is given in parentheses. A random term at ‘pseudo’ level accounts for the overdispersion. | |||||
On mineral soils bilberry coverage increased with stand age and stand basal area up to the age of 175 years and a density of 26 m2 ha–1, after which coverage gradually decreased. It is worth noting that stand basal area was a significant predictor not only on mineral soils but also on spruce and pine mires. On mineral soils and spruce mires, the dominant tree species was also a significant predictor of bilberry abundance. The coverage was lower in spruce-dominated mineral soil forests than pine-dominated forests. The negative effect of deciduous trees on bilberry coverage applied on mineral soils (sites I and II) and spruce mires.
Meso-oligotrophic (III) and oligotrophic spruce mires (IV) did not differ significantly from mesic heath forests with respect to bilberry abundance (Table 1). Coverage at the other sites (I–II) on spruce mires was, on average, one third of the coverage on site III, which is on mineral soils (the reference in Model 1). Of the pine mire sites, site IV had the highest bilberry coverage, although not as high as site III (on mineral soils) and sites III and IV (on spruce mires). At the sites on meso-oligotrophic and more fertile pine mires (I–III), the coverage was two thirds of that on site III (mineral soils), whilst on poor oligo-ombrotrophic pine mires (V), it remained considerably lower.
Model 1 indicated that coverage on poorly productive land, i.e. on fell forests at high altitude, was higher than on site III, on mineral soils (Table 1). In addition altitude had a positive effect on bilberry coverage in all categories (a–g), suggesting that coverage is, on average, higher in eastern and northern Finland than in western and southern Finland. However, both altitude and stand age and basal area are factors in the largescale variation in bilberry coverage in Model 1.
In the simulated stands the effect of site fertility on predicted coverage was clear and the coverage increased with stand age and basal area (Fig. 1). In most cases coverage was temporarily affected by thinnings, but always decreased significantly following regeneration felling. On average, coverage was higher on mineral soils than on pine and spruce mires.
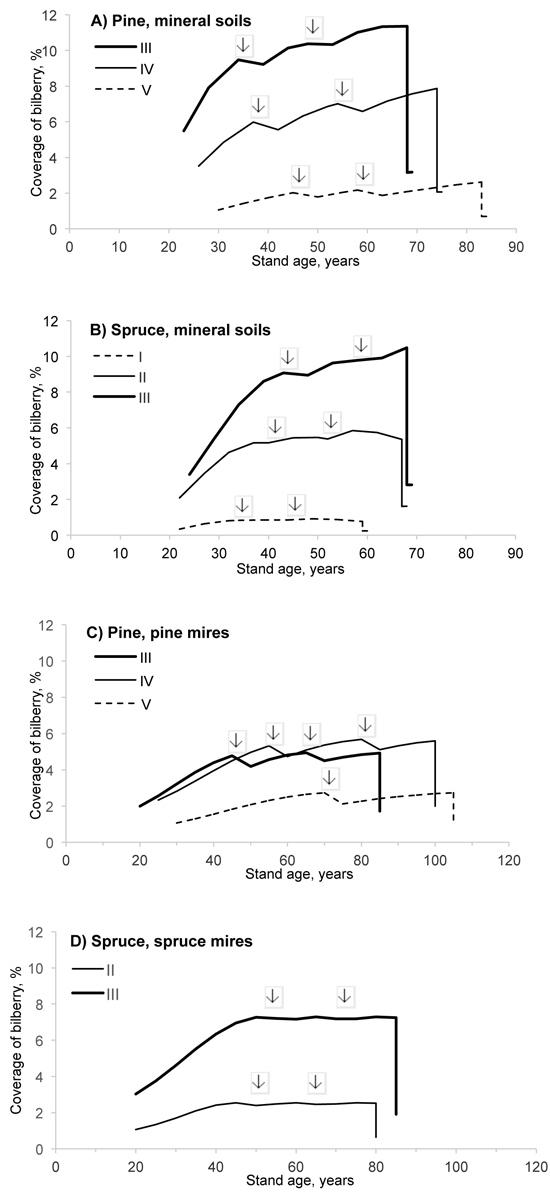
Fig. 1. Predicted coverage of bilberry in pine and spruce stands of different site fertilities (i.e. sites I–V; see the definitions in Suppl. file 1). The development of stands, representing mineral soils (A, B), pine mires (C) and spruce mires (D) in southern Finland, was simulated using the Motti simulator (arrows indicate thinnings).
3.2 Annual variation in bilberry yields
During the study period of 2001–2014, predicted year effect in Model 2 for the number of bilberries was highest in 2005 and 2012, and lowest in 2002 and 2010 (Fig. 2, Table 2). The sample mean and variance for the fixed year effects of Model 2 were 0.1374 and 0.0367 respectively.
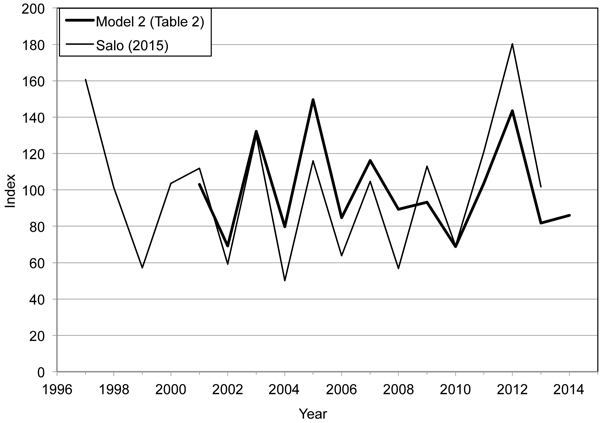
Fig. 2. Bilberry yield indices calculated on the basis of Model 2 (Table 2) and mean annual bilberry yields (kg ha–1) presented by Salo (2015). The former index series covers years 2001–2014 and the latter one years 1997–2013. In both series, the mean value of the indices is 100.
| Table 2. The multi-level Poisson model (Model 2) estimated for the mean number of bilberries on five 1 m2 quadrates in MASI stands, measured in 2001–2014. | ||||
| Variable | Estimate | Std error | t-value | p-value |
| Intercept | 4.4549 | 0.7005 | 6.36 | <0.001 |
| Year effect (ref. 2006) | ||||
| 2001 | 0.1960 | 0.1719 | 1.14 | 0.256 |
| 2002 | –0.2007 | 0.1806 | –1.11 | 0.268 |
| 2003 | 0.4469 | 0.1708 | 2.62 | 0.009 |
| 2004 | –0.0602 | 0.1681 | –0.36 | 0.721 |
| 2005 | 0.5694 | 0.1622 | 3.51 | 0.001 |
| 2007 | 0.3161 | 0.1708 | 1.85 | 0.066 |
| 2008 | 0.0533 | 0.1647 | 0.32 | 0.747 |
| 2009 | 0.0960 | 0.1598 | 0.60 | 0.549 |
| 2010 | –0.2072 | 0.1612 | –1.29 | 0.200 |
| 2011 | 0.2025 | 0.1569 | 1.29 | 0.198 |
| 2012 | 0.5280 | 0.1632 | 3.24 | 0.001 |
| 2013 | –0.0334 | 0.1723 | –0.19 | 0.846 |
| 2014 | 0.0164 | 0.1788 | 0.09 | 0.927 |
| Coverage of bilberry, % | 0.0135 | 0.0057 | 2.38 | 0.028 |
| 1000/Temperature sum (dd) | –1.0888 | 0.5101 | –2.13 | 0.050 |
| Variance components at a | ||||
| forestry centre region level | <0.0001 | (13) | ||
| municipality level | 0.1235 | (29) | ||
| stand level | 0.1132 | (50) | ||
| stand × year level (‘pseudo’ level) | 0.2656 | (306) | ||
| a The number of observations at each level is given in parentheses. A random term at ‘pseudo’ level accounts for the overdispersion. | ||||
The bilberry yield indices in this study show similar variation to those derived from Salo’s (2015) study; the correlation between the indices in the two studies was 0.795. According to Salo (2015), the best and worst bilberry crops were obtained in 2012 and 2004 respectively. For the 2001–2013 period there is agreement between the index series on the above- and below-average years, with the exception of 2009. However, the range of the indices calculated in this study was smaller than that in Salo’s (2015) study (69–150 and 50–180 respectively).
4 Discussion
This study represents a continuation of work by Miina et al. (2009) and Turtiainen et al. (2011). Our model of bilberry coverage (Model 1) considered a wider range of sites, including other sites where bilberry occurs in the field layer (categories b–g) as well as the mineral soil forests (category a) considered by Miina et al. (2009). Covering a wider range of sites was needed, because one third of forestry land in Finland is growing on peatlands (Natural Resources Institute Finland (Luke) 2015) which are not considered by the earlier model of Miina et al. (2009). Model 1 was prepared for forest planning purposes and it can be used together with the yield model of Miina et al. (2009: Table 3).
In the case of mineral soil forests (category a), our results on bilberry coverage were very similar to those of Miina et al. (2009). Miina et al. (2009) considered their results in the context of earlier empirical findings and concluded that they were consistent with these findings (see also Gamfeldt et al. 2013; Hedwall et al. 2013). It follows that our results are also consistent with the empirical findings.
Bilberry coverage on peatlands was, on average, lower than on mineral soil sites (Salemaa 2000). Of the peatland sites, sites III and IV on spruce mires and site IV on pine mires had the highest bilberry coverage. These findings are in line with earlier studies (Sarasto 1961; Salemaa 2000). According to Model 1, deciduous trees decreased bilberry coverage on both spruce mires and the most fertile mineral soil sites. To the best of our knowledge this is the first study to consider the effects of tree species on bilberry coverage on peatlands.
Bilberry was highly abundant on fell forests, and altitude also had a positive effect on bilberry coverage. In northern Finland bilberry grows on poorer sites than in southern Finland owing to the higher relative humidity and higher soil moisture in the north. Bilberry is widespread on the lower slopes of fells and mountains, but it does not occur at such high altitudes as Vaccinium vitis-idaea L. or Empetrum nigrum L. (Salemaa 2000).
Our modelling of bilberry coverage was based on an extensive dataset collected from the permanent sample plots of the Finnish NFI in 1995 (Suppl. file 1). The MASI dataset was considerably smaller (Suppl. file 2) and comprised mainly data from mature stands of medium site fertility which had been found to be good for bilberry. Therefore, it was unfeasible to fit a new yield model in this study, and, although it is based on regionally limited data, we recommend the bilberry yield model of Miina et al. (2009) for future use (Kilpeläinen et al. 2016). We used the MASI data from 2001–2014 to model annual variation in bilberry yields (Model 2). Our Model 2 is based on data from twice as many years as the model by Miina et al. (2009) and we therefore recommend that it is used in conjunction with the Miina et al.’s (2009) bilberry yield model when both average annual yield and annual variation in the yield are to be predicted.
In this study, we first derived annual bilberry yield indices from the year effects of Model 2 and then investigated whether these indices could be used to estimate annual variation in bilberry crops in Finland. The bilberry yield indices varied quite similarly with those of Salo (2015) (Fig. 2). There are several possible reasons for the differences between these two index series. Firstly, we used, on average, fewer MASI stands per year than Salo (2015) (22 vs. 69 stands per year). We used only those MASI stands for which data on stand characteristics and bilberry coverage were available in addition to data on bilberry numbers and site fertility. Secondly, by using a mixed modelling approach we were able to adjust for the unbalanced, cross-correlated structure of the MASI data. Data were not available for all sample plots for every year and observations from a given year were cross-correlated due to annual variation in conditions. Thirdly, Turtiainen et al. (2011) and Salo (2015) calculated mean annual bilberry yields (kg ha–1) using the method described by Turtiainen et al. (2011), which used average weights of ripe bilberries on different site fertilities. The weights were obtained from earlier studies by Kuchko (1988) and Ihalainen et al. (2003). However, one can question whether the weights used were accurate enough (cf. Eronen 2004). It should also be noted that Turtiainen et al. (2011) did not consider annual variation in bilberry weight. In this study we derived bilberry yield indices directly from the number of bilberries without converting berry counts into fresh weights.
In conclusion, the modelling approach introduced in this study is a promising way for estimating total annual bilberry yields over a given period of time. The approach can also be applied to cowberry. However, models of annual variation in berry yield should be based on more comprehensive data than were used in this study. Access to a comprehensive dataset is required to determine how to adjust berry yields for an average crop year to predict total yield in a given year. The results of this study suggest that a very simple calibration method will suffice: the berry yield index for the year in question is divided by 100 and multiplied by the total yield for an average crop year (cf. Turtiainen et al. 2011: Eq. 2); however, this must be verified in future studies.
Acknowledgements
This study was funded partly by the European project StarTree – Multipurpose trees and non-wood forest products: a challenge and opportunity. The project has received funding from the European Union’s Seventh Programme for research, technological development and demonstration under grant agreement No. 311919.
References
Borges J.G., Garcia-Gonzalo J., Bushenkov V., McDill M.E., Marques S, Oliveira M.M. (2014). Addressing multicriteria forest management with Pareto frontier methods: an application in Portugal. Forest Science 60: 63–72. http://dx.doi.org/10.5849/forsci.12-100.
Coudun C., Gégout J.-C. (2007). Quantitative prediction of the distribution and abundance of Vaccinium myrtillus with climatic and edaphic factors. Journal of Vegetation Science 18: 517–524. http://dx.doi.org/10.1111/j.1654-1103.2007.tb02566.x.
Eronen S. (2004). Mustikan ja puolukan kukinta ja marjasadot vuosina 1997–2003. [Flowering and berry crops of bilberry and cowberry in 1997–2003]. Thesis for degree programme in forestry. North Karelia Polytechnic, Joensuu. 64 p.
Filyushkina A., Strange N., Löf M., Ezebilo E.E., Boman M. (2016). Non-market forest ecosystem services and decision support in Nordic countries. Scandinavian Journal of Forest Research 31: 99–110. http://dx.doi.org/10.1080/02827581.2015.1079643.
Finnish Forest Research Institute (1995). Pysyvien koealojen 3. mittaus 1995. Maastotyön ohjeet. [Field instructions for the 3rd measurement of the permanent sample plots in 1995]. The Finnish Forest Research Institute, Helsinki. The National Forest Inventory. 104 p. + appendices.
Gamfeldt L., Snäll T., Bagchi R., Jonsson M., Gustafsson L., Kjellander P., Ruiz-Jaen M.C., Fröberg M., Stendahl J., Philipson C.D., Mikusinski G., Andersson E., Westerlund B., Andrén H., Moberg F., Moen J., Bengtsson J. (2013). Higher levels of multiple ecosystem services are found in forests with more tree species. Nature Communications 4(1340). http://dx.doi.org/10.1038/ncomms2328.
Hall I.V., Aalders L.E., McRae K.B. (1982). Lowbush blueberry production in eastern Canada as related to certain weather data. Canadian Journal of Plant Science 62(3): 809–812.
Hedwall P.-O., Brunet J., Nordin A., Bergh J. (2013). Changes in the abundance of keystone forest floor species in response to changes of forest structure. Journal of Vegetation Science 24: 296–306. http://dx.doi.org/10.1111/j.1654-1103.2012.01457.x.
Hynynen J., Ahtikoski A., Siitonen J., Sievänen R., Liski J. (2005). Applying the MOTTI simulator to analyse the effects of alternative management schedules on timber and non-timber production. Forest Ecology and Management 207: 5–18. http://dx.doi.org/10.1016/j.foreco.2004.10.015.
Ihalainen M., Pukkala T. (2001). Modelling cowberry (Vaccinium vitis-idaea) and bilberry (Vaccinium myrtillus) yields from mineral soils and peatlands on the basis of visual field estimates. Silva Fennica 35(3): 329–340. http://dx.doi.org/10.14214/sf.588.
Ihalainen M., Alho J., Kolehmainen O., Pukkala T. (2002). Expert models for bilberry and cowberry yields in Finnish forests. Forest Ecology and Management 157: 15–22. http://dx.doi.org/10.1016/S0378-1127(00)00653-8.
Ihalainen M., Salo K., Pukkala T. (2003). Empirical prediction models for Vaccinium myrtillus and V. vitis-idaea berry yields in North Karelia, Finland. Silva Fennica 37(1): 95–108. http://dx.doi.org/10.14214/sf.513.
Ihalainen M., Pukkala T., Saastamoinen O. (2005). Regional expert models for bilberry and cowberry yields in Finland. Boreal Environment Research 10: 145–158.
Kangas J. (1998). Non-wood forest goods and benefits and the choice of forest management practices. In: Lund H.G., Pajari B., Korhonen M. (eds.). Sustainable development of non-wood goods and benefits from boreal and cold temperate forests. EFI Proceedings No. 23. p. 203–210.
Kilpeläinen H., Miina J., Store R., Kurttila M., Salo K. (2016). Evaluation of bilberry and cowberry yield models by comparing model predictions with field measurements from North Karelia, Finland. Forest Ecology and Management 363: 120–129. http://dx.doi.org/10.1016/j.foreco.2015.12.034.
Krebs C.J., Boonstra R., Cowcill K., Kenney A.J. (2009). Climatic determinants of berry crops in the boreal forest of the southwestern Yukon. Botany 87: 401–408. http://dx.doi.org/10.1139/B09-013.
Kuchko A.A. (1988). Bilberry and cowberry yields and the factors controlling them in the forests of Karelia, USSR. Acta Botanica Fennica 136: 23–25.
Laakso S., Lehtinen P., Raatikainen M. (1990). Kuusen ja männyn vaikutus mustikan esiintymiseen, kukintaan ja marjasatoon. [The influence of spruce and pine on the cover values, flowering and berry yields of the bilberry (Vaccinium myrtillus L.)]. Memoranda Societatis pro Fauna et Flora Fennica 66: 47–53.
Lee S.-S., Salo K., Alexander S. (2007). The state of global research concerning edible forest products. In: Chamberlain J.L. (ed.). Non-timber forest products – traditional products and technologies. Proceedings from IUFRO World Forest Congress, Research Group 5.11. CD-rom. Asia Pacific Association of Forestry Research Institutes, FRIM, Kepong, Kuala Lumpur, Malaysia. p. 52–74.
Miina J., Hotanen J.-P., Salo K. (2009). Modelling the abundance and temporal variation in the production of bilberry (Vaccinium myrtillus L.) in Finnish mineral soil forests. Silva Fennica 43(4): 577–593. http://dx.doi.org/10.14214/sf.181.
Natural Resources Institute Finland (Luke) (2015). E-yearbook of food and natural resource statistics for 2015. http://stat.luke.fi/sites/default/files/e-yearbook-foodandnaturalsource-2015_1.pdf. [Cited 17 Aug 2016].
Raatikainen M. (1993). Vaccinium myrtillus yields and environmental factors. Aquilo Series Botanica 31: 21–26.
Rämö A.-K., Horne P., Primmer E. (2013). Yksityismetsänomistajien näkemykset metsistä saatavista hyödyistä. [Finnish private forest owners’ (NIPFs’) perceptions of forest ecosystem services]. PTT reports 241. 107 p.
R Development Core Team. (2012). R: a language and environment for statistical computing. R Foundation for Statistical Computing, Vienna, Austria. http://www.R-project.org/. [Cited 21 June 2012].
Ritchie J.C. (1956). Biological flora of the British Isles: Vaccinium myrtillus L. Journal of Ecology 44: 291–299. http://dx.doi.org/10.2307/2257181.
Salemaa M. (2000). Vaccinium myrtillus. Mustikka. [Bilberry]. In: Reinikainen A., Mäkipää R., Vanha-Majamaa I., Hotanen J.-P. (eds.). Kasvit muuttuvassa metsäluonnossa. [Changes in the frequency and abundance of forest and mire plants in Finland since 1950]. Tammi, Helsinki. p. 128–130.
Salo K. (1999). Principles and design of a prognosis system for an annual forecast of non-wood forest products. In: Niskanen A., Demidova N. (eds.). Research approaches to support non-wood forest products sector development: case of Arkhangelsk region, Russia. EFI Proceedings No. 29. p. 35–44.
Salo K. (2015). Valtakunnalliset marja- ja sienisatoennusteet. [National berry and mushroom yield forecasts]. In: Salo K. (ed.). Metsä. Monikäyttö ja ekosysteemipalvelut. [Forest. Multiple use and ecosystem services]. Luonnonvarakeskus (Luke), Helsinki. p. 128–130.
Sarasto J. (1961). Über die Klassifizierung der für Walderziehung entwässerten Moore. [Classification of peatlands drained for forestry]. Acta Forestalia Fennica 74(5): 1–47.
Tomppo E., Heikkinen J., Henttonen H.M., Ihalainen A., Katila M., Mäkelä H., Tuomainen T., Vainikainen N. (2011). Designing and conducting a forest inventory – case: 9th National Forest Inventory of Finland. Managing Forest Ecosystems 21. http://dx.doi.org/10.1007/978-94-007-1652-0.
Turtiainen M., Nuutinen T. (2012). Evaluation of information on wild berry and mushroom markets in European countries. Small-scale Forestry 11(1): 131–145. http://dx.doi.org/10.1007/s11842-011-9173-z.
Turtiainen M., Salo K., Saastamoinen O. (2005). Satomalleilla lasketut Suomen kangasmetsien alueelliset ja valtakunnalliset mustikka- ja puolukkasadot. [Model-based estimates of regional and national bilberry and lingonberry yields on mineral soils in Finland]. University of Joensuu, Faculty of Forestry. Research Notes 167. 44 p.
Turtiainen M., Salo K., Saastamoinen O. (2007). Mustikan ja puolukan marjasatojen valtakunnalliset ja alueelliset kokonaisestimaatit Suomen suometsissä. [National and regional estimates of blueberry (Vaccinium myrtillus L.) and lingonberry (V. vitis-idaea L.) yields on peatlands in Finland]. Suo 58(3–4): 87–98.
Turtiainen M., Salo K., Saastamoinen O. (2011). Variations of yield and utilisation of bilberries (Vaccinium myrtillus L.) and cowberries (V. vitis-idaea L.) in Finland. Silva Fennica 45(2): 237–251. http://dx.doi.org/10.14214/sf.115.
Turtiainen M., Miina J., Salo K., Hotanen J.-P. (2013). Empirical prediction models for the coverage and yields of cowberry in Finland. Silva Fennica 47(3) article 1005. http://dx.doi.org/10.14214/sf.1005.
Wallenius T.H. (1999). Yield variations of some common wild berries in Finland in 1956–1996. Annales Botanici Fennici 36: 299–314.
Total of 36 references.
