Eirik Ogner Jåstad  ,
Niels Oliver Nagel,
Junhui Hu,
Per Kristian Rørstad
,
Niels Oliver Nagel,
Junhui Hu,
Per Kristian Rørstad
The location and capacity-dependent price impacts of biofuel production and its effect on the forest industry
Jåstad E. O., Nagel N. O., Hu J., Rørstad P. K. (2023). The location and capacity-dependent price impacts of biofuel production and its effect on the forest industry. Silva Fennica vol. 57 no. 1 article id 23001. https://doi.org/10.14214/sf.23001
Highlights
- Large biofuel units prefer regions close to transportation facilities
- Forest owners are the main winners if large-scale biofuel production is established
- The first production units reduce export, hence should be located at an exporting hub
- Biofuel production will reduce the Norwegian export of roundwood to Sweden
- Biofuel production increases the local demand and pulpwood prices.
Abstract
Forest-based biofuel stands out as a promising solution to avoid fossil emissions in parts of the transport sector. Biofuel production will need large amounts of forest biomass, collected from a large area. Roundwood is costly to transport compared with other goods. Therefore, the location of forest-based biofuel production is a crucial part of an investment decision. This study analyses the optimal location of biofuel plants in Norway and the implications for the traditional forest sector in the Nordic countries. We test different numbers of production units, different sizes of the units, and various raw materials. The study applies a partial equilibrium model that covers the Norwegian and Nordic forest sectors, with 356 regions in Norway. The results indicate that small biofuel plants have the potential to turn exporting regions into importing regions. Larger biofuel plants are suitable for areas with large harvest activity today or regions with access to harbour or timber terminals along railways. We find that forest owners close to a biofuel plant will profit the most from biofuel production. Policymakers and investors should take into account that different locations and production capacities have different impacts on the forest sectors.
Keywords
partial equilibrium model;
biofuel location policy;
biomass supply;
forest-based biofuel;
nordic forest sector
-
Jåstad,
Faculty of Environmental Sciences and Natural Resource Management, Norwegian University of Life Sciences, P.O. Box 5003, NO-1432 Ås, Norway
 https://orcid.org/0000-0002-1089-0284
E-mail
eirik.jastad@nmbu.no
https://orcid.org/0000-0002-1089-0284
E-mail
eirik.jastad@nmbu.no
-
Nagel,
Faculty of Environmental Sciences and Natural Resource Management, Norwegian University of Life Sciences, P.O. Box 5003, NO-1432 Ås, Norway
https://orcid.org/0000-0002-3171-0262
E-mail
niels.oliver.nagel@nmbu.no
-
Hu,
Faculty of Environmental Sciences and Natural Resource Management, Norwegian University of Life Sciences, P.O. Box 5003, NO-1432 Ås, Norway
https://orcid.org/0000-0003-0001-5993
E-mail
junhui.hu@nmbu.no
- Rørstad, Faculty of Environmental Sciences and Natural Resource Management, Norwegian University of Life Sciences, P.O. Box 5003, NO-1432 Ås, Norway E-mail per.kristian.rorstad@nmbu.no
Received 9 January 2023 Accepted 25 April 2023 Published 28 April 2023
Views 39198
Available at https://doi.org/10.14214/sf.23001 | Download PDF

1 Introduction
The European Union (EU) proposes biofuels to be one of several building blocks to achieve its renewable energy target of 45% of total energy consumption in 2030 across all sectors (European Commission 2022). Biofuels enable reduced use of fossil fuels within the heating, industry processes, road transport, shipping, and aviation. Recent amendments to the renewable energy directive (RED) (European Commission 2022), however, propose to restrict the use of primary woody biomass (European Commission 2021) used towards the EU renewable energy target. Additionally, planned revisions before 2030 might impose further restrictions. However, secondary woody biomass is not affected by these new policies, which are regarded as a sustainable alternative by EU policymakers (European Parliament 2022). The Joint Research Centre (JRC) of the EU finds secondary woody biomass to be used for 49% of current bioenergy production, with another 14% not categorized (Camia et al. 2021). Thus, under current EU regulation, the large potential for biofuels to contribute to the EU’s renewable energy targets in future years remains and will likely impact the Nordic forest sector.
To produce enough forest-based biofuels, new plants should consider a capacity and location depending on the local biomass market, to generate the highest returns. No studies in the Nordics have assessed the optimal location of forest biofuel plants in relation to plant size and location at a detailed spatial level and their effects on the forest value chain. However, related studies have been done in an international context, often focusing on optimal plant size concerning other parameters and variables. Jenkins et al. (2020) study the relationship between harvest region, biomass yield, and plant location on optimal biofuel facility size in Michigan. They find that using spatially detailed modelling with realistic transportation distances can lead to smaller optimal plant sizes and higher unit costs for biofuels. The method applied is a discrete cost model with assumptions on biomass costs being exogenously determined parameters not affected by new biomass demands from biofuel production facilities. Zhang et al. (2017) combine Geographic Information Systems (GIS) analysis with optimization modelling designed to minimize the total bioethanol feedstock supply chain system cost and find that feedstock availability, transportation costs, and bioethanol demand impact the optimal amount, location, and size of bioethanol facilities. While Schröder et al. (2019) combined strategic planning and GIS analysis to determine the optimal location and configuration of a biorefinery in western Canada. They found that a biofuel plant demanding 500 000 dry tonnes of biomass may have a cost-efficient procurement area, while the location of such a plant is not crucial for the profitability within the analysed area of Western Canada.
The Nordic forest sector is in a transitional period characterized by challenges and opportunities shaped by EU policy, industry trends, demand development, and the development of new products such as biofuels. For example, digitalization has contributed to lower paper demand in European markets in recent years (Bolkesjø et al. 2003; Hämäläinen and Hilmola 2017). In the same period, the global competition for Nordic forest industry products from Asia and South America has increased (Hetemäki and Hurmekoski 2016). In total, this has significantly reduced the production from the traditional forest sector in Norway in the last decades (Rørstad et al. 2019). New products designed to reduce greenhouse gas (GHG) emissions across sectors, such as biofuels, provide opportunities for new revenue streams and increase demand for woody biomass as feedstock (Jåstad et al. 2019). Several studies focus on the impact of biofuel production on the forest value chain in the Nordics. Lundmark et al. (2018) find that biofuel production in Sweden will have limited price impacts on feedstock markets, but if additional biomass is not available from fast-growing plantations, it will lead to higher demand for roundwood. They also find large-scale biofuel production facilities to be more economical as economies of scale outweigh transportation costs, particularly when competition for biomass is limited. Using a partial equilibrium model, Kallio et al. (2018) find biofuel production to compete with bioenergy use for heat and power production. They find feedstock demand to be affected by bioenergy policy targets in Europe and sunk investments in biorefineries affecting long-term demand for forest products. Pulpwood and forest chips prices are found to be highly sensitive to increased biofuel production in Europe. They apply a partial equilibrium global forest sector model where most European countries are modelled as one region, allowing them to endogenously calculate production, consumption, forest product prices, and trade between regions. Jåstad et al. (2019) find forest-based biofuel production to increase revenues for forest owners due to higher feedstock prices and increased use of harvest residues. Relevant to policy decisions, however, is that large-scale biofuel production also creates spillover effects along the value chain, for example, to the pulp and paper industries that are negatively affected by increased feedstock prices. Like in this study, the Nordic Forest Sector Model (NFSM) is applied, a partial equilibrium model covering forestry, forest industry, and bioenergy in the Nordic region. It is, however, compared to this study, applied with a coarser geographical setup. For the Swedish geographical scope de Jong et al. (2017) investigate how scale, integration, transport, and supply chain configurations affect the cost of biofuel production. They find economies of scale to be particularly important in reducing costs, followed by integration benefits, referring to making use of low-cost by-products of biofuel production such as steam sales. This, however, entails colocations with industries or demand centres. They apply a Mixed Integer Linear Program (MILP) optimization model where system costs from feedstock, transport, capital, and operating costs are minimized to serve a given biofuel demand. Some studies investigate the economic impacts biofuels have on major stakeholders in the forest sector value chain with the use of models with a detailed spatial representation of the Nordic forestry sector (Mustapha et al. 2017; Jåstad et al. 2021), however, none are found to have a spatial representation detailed to a municipality level.
Previous research papers show that factors such as economies of scale, integration, transportation costs and different logistic problems with handling the biomass affect the optimal size and location of biofuel plants (de Jong et al. 2017; Malladi and Sowlati 2018; Jenkins et al. 2020). The field of logistic problems has not taken the synergic effects with the forest industry into account (Malladi and Sowlati 2018) but the size and location of biofuel plants will impact the prices of forest products along the value chain. More research on the optimal location and size of biofuel plants with granular geographic representation in a Nordic forestry sector is needed. The novelty in this study is that we let a forest sector model endogenously define the optimal location across a model with a high geographical resolution, i.e., we estimate the least-cost location for biofuel production in Norway from a feedstock viewpoint and not only focus on the effect of a specific location. We find that an updated version of the Nordic Forest Sector Model (NFSM) is suited to address the above-stated research gap. In this study, NFSM is further developed to represent Norway spatially at a municipal level. This allows us to understand complex interactions between prices, biomass availability, transport characteristics, and existing industry. A major difference to previous approaches analysing optimal plant sizes and locations of biofuel plants is that we apply a model where prices and quantities in the market are endogenous. The role of location and capacity-dependent biofuel production in the Norwegian forest sector has not been previously researched, the research gap is addressed here. We furthermore investigate how feedstock prices along the value chain of biofuels could be affected. Findings relevant to regions outside of Norway, concerning the location and size of biofuel plants in connection to resource availability, are included as well. Further sensitivity scenarios give insight into how assumptions on the availability of certain raw material impact our results.
2 Method
2.1 Nordic forest sector model – NFSM
The Nordic Forest Sector Model (NFSM) is a spatial partial equilibrium model covering the Nordic forest sector. The model was built on the framework of the Norwegian Trade Model (NTM) (Trømborg and Solberg 1995), which only covered Norway, and was further expanded to cover Sweden, Finland, and Denmark by Mustapha (2016). In this study, the geographical model focus is on the Nordics (Norway, Sweden, Finland, and Denmark) and the Baltics (Lithuania, Latvia, and Estonia) forest sectors. The current model version has a detailed spatial resolution in Norway, which is increased from originally 10 regions to 356 regions that represent the Norwegian municipalities. In addition, the model is further extended with the 3 Baltic countries Lithuania, Latvia, and Estonia, each represented as one region. The rest of the world is represented by four regions that cover different trade routes to and from the Nordic countries. Together with 10 regions in Sweden and Finland respectively, and one region in Denmark, the model has 384 regions in total (Nordics and Baltics represented in Fig. 1).
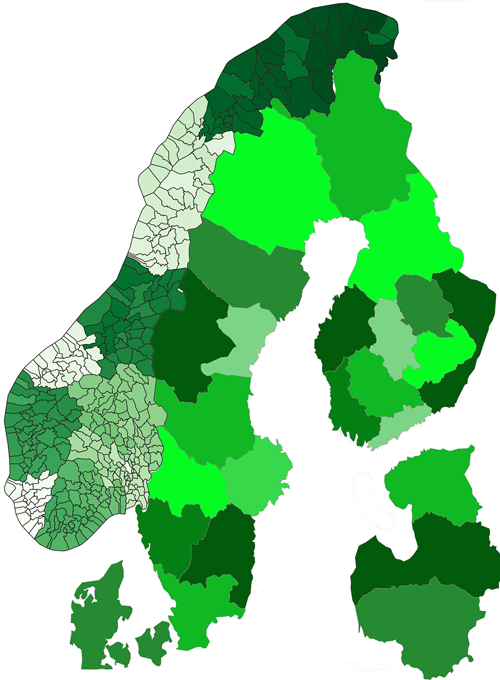
Fig. 1. The modelled regions in the Nordic Forest Sector Model (NFSM). Where Norway is refined into 356 municipalities, Sweden and Finland are divided into 10 regions, respectively, while Denmark and the Baltic countries are modelled as one region each. In total are 380 regions modelled detailed and 4 abroad importing and exporting region is included as well (not shown).
The model is solved as a mixed integer linear programming (MILP) problem, with the aim of maximising the welfare of the included markets. The objective function contains the sum of the consumer and producer’s surplus under different constraints which ensures that production, harvest, and consumption stay within reasonable limits. The main target variables in the model are production, harvest, and consumption levels, as well as commodity prices which are endogenously defined as the shadow price of the material balance in the model. A full mathematical description of the core model is found in Jåstad et al. (2019). The optimal solution equates supply and demand, where prices and production of final products, roundwood supply, and trade between regions are endogenously solved. Demand and supply equilibrium is achieved within the forest sector, while the modelling of other sectors, such as the labour market, electricity, and fuels are simplified as static prices of the goods. The model covers the main actors and biomass flows in the forest sector, from the supply of roundwood and industrial production to the demand for final products. The mass flow of the intermediate products from the production processes, such as sawdust, wood chips, bark, etc., flows from one industry to another. In total, NFSM has 6 types of roundwood assortments (sawlogs and pulpwood from Norway spruce (Picea abies (L.) H. Karst.), Scots pine (Pinus sylvestris L.), and non-coniferous (other species mainly birch (Betula spp.)), scientific names are from Tropicos.org (2023)), 13 final products (3 sawnwood grades, 3 board grades, 4 paper grades, firewood, pellets, and district heating), and 9 types of intermediate products (including pulp and industrial residues), as illustrated in the flowchart Fig. 2. The reference data for industrial production, roundwood harvest of each species, harvest residues, and the growing stock of each species in NFSM are shown in Table 1 and Table 2. Those numbers are used as the starting point in the model.
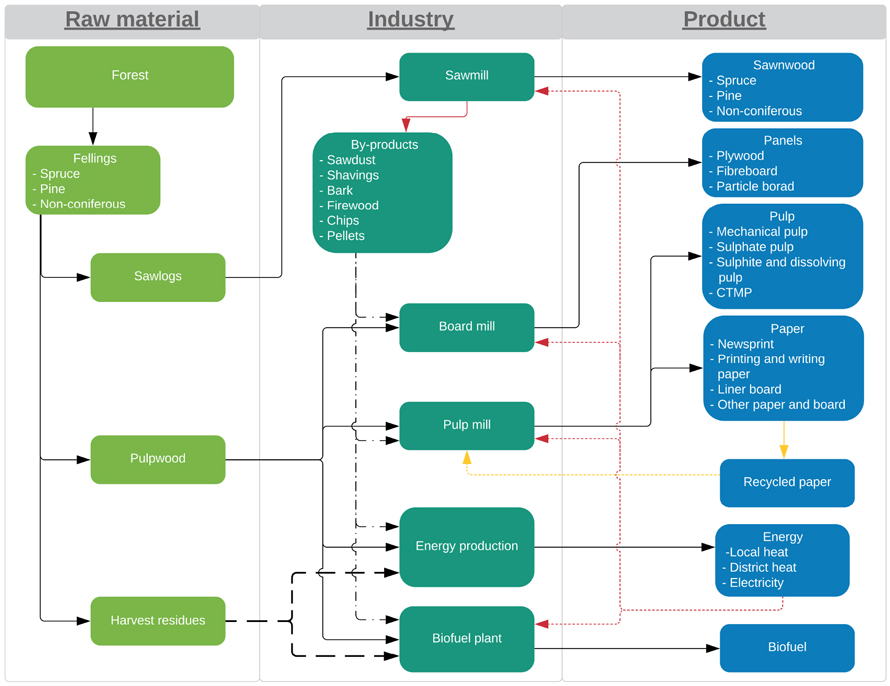
Fig. 2. Flowchart of the mass flow in the Nordic Forest Sector Model (NFSM) with raw materials, main industrial processes, intermediate biomass flow, and final products. View larger in new window/tab.
| Table 1. Reference data for the Nordic forest sector used in the Nordic Forest Sector Model (NFSM). The table shows aggregated number used for calibrating the model and representing the initial production without biofuel production in Norway. | |||||||
| Norway | Sweden | Finland | Denmark | Baltics | |||
| Industrial production | Bioheat | TWh | 8.4 | 104.9 | 71.1 | 20.8 | 33.6 |
| Board | million m3 | 0.7 | 1.0 | 1.2 | 0.4 | 3.1 | |
| Sawn wood | million m3 | 3.4 | 21.1 | 13.3 | 0.4 | 5.5 | |
| Firewood | million m3 | 2.4 | 5.1 | 4.8 | 2.3 | 7.4 | |
| Charcoal and pellets | million tonnes | 0.1 | 2.0 | 0.8 | 0.1 | 4.0 | |
| Paper | million tonnes | 1.2 | 9.8 | 8.2 | 0.4 | 0.5 | |
| Pulp production | million tonnes | 0.4 | 13.0 | 11.1 | 0.0 | 0.3 | |
| Table 2. Reference growing stock, harvest, roundwood prices, and the price elasticity of roundwood supply used in the Nordic Forest Sector Model. Sources: (FAOSTAT 2022; Landbruksdirektoratet 2022; Luke 2022a,b; Rørstad et al. 2022; Skogstyrelsen 2022; Statistics Denmark 2022). | ||||||
| Norway | Sweden | Finland | Denmark | Baltics | ||
| Price elasticity of roundwood supply | Sawlogs | 0.73–1.67 | 1.39 | 1.39 | 1.28 | 1.28 |
| Pulpwood | 0.69–1.67 | 0.78 | 0.78 | 0.72 | 0.72 | |
| Roundwood prices [€/m3 ub.] | Spruce sawlogs | 66 | 70 | 66 | 69 | 68 |
| Spruce pulpwood | 30 | 33 | 33 | 32 | 32 | |
| Pine sawlogs | 61 | 64 | 66 | 68 | 62 | |
| Pine pulpwood | 24 | 29 | 32 | 32 | 28 | |
| Non-coniferous sawlogs | 67 | 69 | 77 | 66 | 65 | |
| Non-coniferous pulpwood | 42 | 36 | 41 | 36 | 35 | |
| Harvest [million m3 ub.] | Spruce (Picea abies) | 9 | 42 | 23 | 3 | 9 |
| Pine (Pinus sylvestris) | 3 | 26 | 27 | 1 | 8 | |
| Non-coniferous/other | 2 | 16 | 12 | 3 | 19 | |
| Sawlogs share of the total harvest | 59% | 55% | 50% | 25% | 56% | |
| Growing stock [million m3 ub.] | Spruce (Picea abies) | 406 | 1210 | 630 | 42 | 340 |
| Pine (Pinus sylvestris) | 258 | 1204 | 1040 | 13 | 552 | |
| Non-coniferous/other | 209 | 551 | 364 | 77 | 739 | |
The regional timber supply is modelled with a piecewise linearized function connecting the timber price supply elasticity (Table 2) and harvest level in each region. The harvest level is constrained by the standing stock. The demand for final products is a function of demand elasticity and consumption in the reference year, see Table 3 for the different price elasticity in the model. The available volume of harvest residues is constrained to be a maximum of 40% of the total volume of harvested roundwood in each region and period. Industrial production is determined by exogenous input-output coefficients, endogenous production capacities, and prices of intermediate products. The input-output coefficients specify the required feedstocks and other cost-related inputs. The trade between regions happens if the price difference between the two regions exceeds the transport cost. The latter is estimated by a fixed and variable per-kilometre cost between regions, based on Grønland (2018). The transportation options include trucks, trains, and ships, and the model can freely select the least-cost option based on the available infrastructure, see Table 4 for a representation of the different transportation costs used in the model. The model is solved with the CPLEX solver (IBM 2020) using the General Algebraic Modelling System (GAMS Development Corporation 2021). A full mathematical description of the objective function and the constraints as well as all assumptions can be found in Jåstad et al. (2019) and Jåstad (2020).
| Table 3. The assumed price elasticity for the main product categories, as well as the reference base price for the different product categories. The prices are shown with the maximal variation in prices. The prices variating between the different products that are within each product group as well as between the region, based on the different transport distances. Based on own assumption and FAOSTAT (2022) and Buongiorno (2015). | |||||||
| Price elasticity | Reference prices | ||||||
| Norway | Sweden | Finland | Denmark | Baltics | Unit | ||
| Sawnwood | –0.17 | 171–486 | 165–440 | 164–421 | 183–440 | 179–421 | €/m3 |
| Fibreboard | –0.54 | 337–428 | 362–411 | 362–403 | 377 | 383–386 | €/tonne |
| Plywood | –0.61 | 501–535 | 499 | 469–488 | 490 | 486–504 | €/m3 |
| Particle board | –0.51 | 233–271 | 247–260 | 246–263 | 258 | 248–259 | €/m3 |
| Newspaper | –0.04 | 459 | 480 | 457 | 490 | 504–506 | €/tonne |
| Printing and writing paper | –0.53 | 817–870 | 833–848 | 775–826 | 845 | 830–851 | €/tonne |
| Linerboard | –0.45 | 350–418 | 325–376 | 292–352 | 368 | 373–387 | €/tonne |
| Other paper and paper board | –0.45 | 762–837 | 739–803 | 737–775 | 811 | 764–788 | €/tonne |
| Table 4. Assumed cost for transporting roundwood between the different modelled regions. The transport cost is assumed independent of quantities, but varies with distance, based on a fixed terminal cost and a variable distance cost. The costs are based on the road, rail, or marine distances between the regional centres calculated in GIS and with official Norwegian road, rail, and harbour data provided by Kartverket (2022) and own estimated cost based on Grønland (2018). It is assumed that the model selects the least-cost transport method available between regions. | ||
| Distance dependent cost [€/km/m3] | Fixed terminal costs [€/m3] | |
| Road | 0.0457 | 1.43 |
| Rail | 0.0119 | 3.93 |
| Marin | 0.0037 | 4.22 |
2.2 Biofuel production scenarios
To investigate the economic effects of different scales of biomass demand for biofuel production in Norway, various setups are created. In total, eight scenarios of biomass demand are created that combine three production sizes with a varying number of plants, as illustrated in Table 5. The smallest production size has an input capacity of 100 000 m3 pulpwood. This plant size is relatively small and represents a distributed biofuel production structure, where biofuel production facilities may be located close to the resources, allowing short transportation distances for the feedstock. The largest plant size is ten times the size of the smallest and has an input capacity of 1 000 000 m3 per year, approximately the same as the largest pulp and paper producers in Norway. Plants with this capacity must rely on biomass from a large purchasing area than the smaller size and would likely compete more with existing domestic and international biomass users. We also include a medium production size with an input capacity of 500 000 m3 per year.
The numbers of plants vary in the range of 1–30 for creating the biomass demand that varies from 0.1 million m3 to 5 million m3. In total, 17 setups are designed with different combinations of plant size and numbers (Table 5), and these setups are simulated independently in the model. In addition, it is constrained that each region can host a maximum of one biofuel plant, and biofuel production can use both spruce and pine pulpwood, the model freely selects the least-cost combination of them. It is important to notice that we focus on the optimal locations of the biofuel plants when it comes to biomass supply, based on the given input capacity, the total number of the plants, the techno-economic feasibility, and competition of production relating to, e.g., conversion efficiencies, operation cost, investment cost, and the selling price of biofuel are out of scope of this study.
| Table 5. The 17 included combination of numbers of plants and input sizes for the studied biofuel production. The different sizes of the production unit are 0.1 million m3, 0.5 million m3, and 1 million m3 input of biomass in each biofuel plant, in total forming these 8 different scenarios of biomass demand ranging from 0.1 million m3 to 5 million m3. | ||||||||
| Input capacity (million m3) | Number of biofuel plants | |||||||
| 0.1 | 1 | 2 | 5 | 10 | 20 | 30 | - | - |
| 0.5 | - | - | 1 | 2 | 4 | 6 | 8 | 10 |
| 1 | - | - | - | 1 | 2 | 3 | 4 | 5 |
| Total biomass demand in each scenario (million m3) | 0.1 | 0.2 | 0.5 | 1 | 2 | 3 | 4 | 5 |
To test how sensitive the optimal location of biofuel plants and mass balance are to different raw materials availabilities, the biofuel feedstock is changed to 1) harvest residues only, 2) spruce pulpwood only, 3) pine pulpwood only, 4) by-products from the sawmills only, and 5) all raw materials mentioned in 1) – 4). In cases where more than one raw material is allowed, the model estimates the optimal amount of each raw material, but the total input (given in m3 solid) is constant.
3 Result
3.1 Optimal location
The estimated optimal location for the biofuel plants for the 17 different combinations mentioned in Table 5 regarding plant size and total input usage is shown in Fig. 3. The first and smallest units (100 000 m3/unit) are located in regions with currently low activity in the forest sector. These regions are also inland regions with long distances to existing industries and railroads. This implies that a small biofuel production unit may be suitable for a region where the traditional forest industry is not profitable. Production of biofuel in these regions will significantly raise the roundwood prices by up to 83% (Fig. 4). It would also make these regions high-price regions, with the need to import a large amount of biomass from nearby regions. Price increases in regions at the coast or in the southern part of the county Innlandet (former county Oppland and Hedemark) are less affected. If the number of small plants increases, more of the plants will be located closer to existing industries and other trade facilities, hence, having a larger consequence for the existing industry. For medium or large biofuel plant sizes (500 000 m3/unit and 1 000 000 m3/unit), we find that most of the plants are located in regions with intensive harvest activities (Fig. 3). When the total biomass input for biofuel production exceeds 3 million m3, most of the new biofuel plants are located at the coast with the marginally lowest import cost. This is because most of the domestic biomass available at a competitive price is used for industrial purposes, and therefore the least-cost solution is to base biofuel production mainly on imported biomass. These results are also relevant to other parts of the world since all regions have some limitations on how much biomass can be delivered domestically. When all the domestic biomass is used, a country will start to import biomass instead of using more expensive biomass. This may bring the risk of carbon leakage, especially for larger biofuel plants with limited domestic supply.
The pulpwood prices (Fig. 4) increase the most in the regions investing in biofuel plants, but also in neighbouring regions if the biofuel plant is located in a region with a limited forest sector. The reason for this is that regions with a limited forest sector typically have long transportation distances to existing industries or trading hubs. This makes it more economically attractive to increase the harvest on marginal land before transporting the biomass over longer distances. Moreover, the region goes from exporting to importing, which impacts the prices significantly. Consequently, the forest owners in these regions will gain the most from biofuel production as both the increased demand for biomass, which leads to higher harvest levels and dramatically increased pulpwood prices will lead to higher income. However, the price increase in the region close to current forest industries is less evident. On average, the regional pulpwood prices increase most when a small-scale biofuel plant is built in a region. The first five production unit with a size of 100 000 m3/unit increases the average pulpwood price by 26–69% in a region, while for the two other sizes, the increase is 12–36%. For the national average price, the effects are smaller: the five first units with a plant size of 100 000 m3/unit only increase the price by 1–2%, with 500 000 m3/unit the increase is 1–9%, and with 1 000 000 m3/unit it is 2–10%. The explanation is that the small plants are in regions with initially low timber prices and due to the long transportation distance, it mainly increases the local prices. While larger production units are located close to the high-price regions where it is easier to trade timber over longer distances, hence, the local prices are not increased much, but the prices are increased over larger surrounding regions. For a biofuel plant located on the coast, the prices of pulpwood will only increase until it covers the importing cost. As a result, prices in surrounding areas increase only marginally, even for the largest production units.
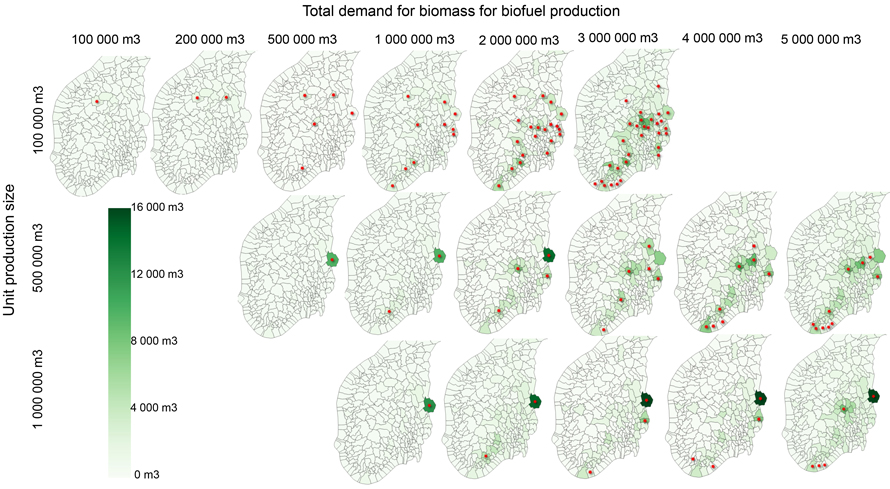
Fig. 3. Modelled location (red star) for biofuel plants using spruce or pine pulpwood. The different plant sizes are shown on different rows, while the different input of biomass is shown on different column. The colours represent changes in harvest from the base scenario without biofuel production in Norway. Light colours mean no change, while dark means an increased harvest of 16 000 m3. View larger in new window/tab.
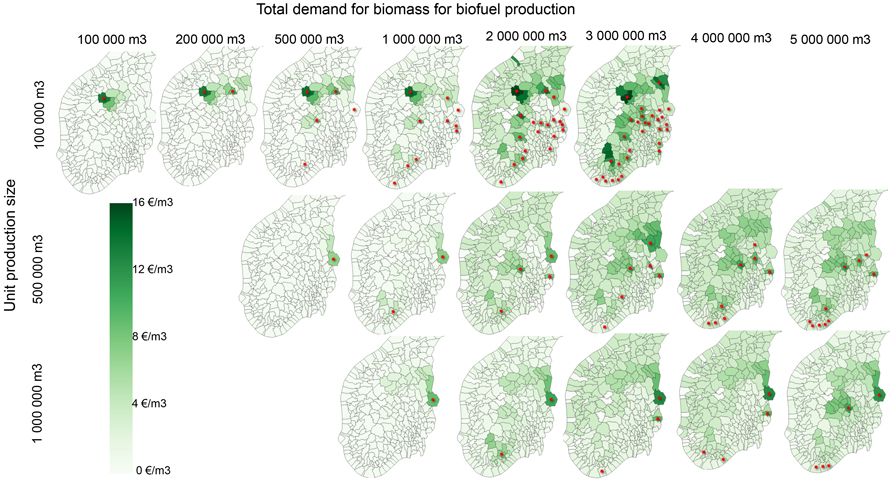
Fig. 4. Modelled change in pulpwood prices for the different scenarios and estimated location (red star) for biofuel plants using spruce or pine pulpwood. The different plant sizes are shown on different rows, while the different input of biomass is shown on different column. The colours represent changes in pulpwood prices from the base scenario without biofuel production in Norway. Light colours mean no change, while dark means an increased price of 16 €/m3. View larger in new window/tab.
3.2 Mass balance and optimal use of raw material
Changes in biomass prices and biomass supply in Norway for the different biofuel production setups are shown in Fig. 5. From a national perspective, most of the increased demand for biomass is covered by increased imports or decreased exports. Increased domestic harvest accounts for 4–26% of the total demand, highest for the small production unit (100 000 m3) and lowest for the largest production unit (1 000 000 m3). Reduced consumption in existing industries and collection of harvest residues are only marginally affected. The main source of increased biomass is increased imports and decreased export. The export of pulpwood is 1.8 million m3 in the reference where no biofuel production is included. The number is reduced to 0.1 million m3 when biofuel production consumes more than 2 million m3. This is a turning point where Norway changes from exporting to importing pulpwood to maintain the initial industrial production and supply the biofuel production. The trade of sawlogs and by-products from sawmills as well as broadleaf timber is at the initial value for all biofuel setups since those categories are not directly used for biofuel production. This implies that sawmills maintain their production of sawnwood independent of the biofuel production level. Therefore, biofuel production in Norway will only change the trade structure of pulpwood with neighbouring countries and Norway goes from being a net exporter of pulpwood to a net importer. This will especially impact the Swedish industry and their forest sector because Sweden is the main importer of pulpwood from Norway in the reference.
The domestic pulpwood prices (Fig. 5) increase with increasing biofuel production due to increased domestic demand. The domestic pulpwood prices increase the most, with increasing overall demand, for the smallest production units. For example, the volume-weighted pulpwood prices for the smallest production size increased by 13% for a total demand of 3 million m3 compared to the reference scenario without biofuel production, for the largest production unit is the same increase of only 11%. This reflects that a small production size but an overall large production will impact a large part of the country, while fewer and larger production units will mainly be impacting the biomass market at a more local level. The exact increase is dependent on the specific location and if the biofuel production is mainly supplied by imported or domestic biomasses. For example, the decrease in domestic pulpwood prices for 5 units with 500 000 m3/unit compared to 4 units is due to the 5th plant being located in a region that only imports biomass. Hence, the prices are not increasing significantly compared to those without additional biofuel production. For all production sizes, the biofuel gate price for the first plant is above the average domestic price, thus implying that the production plant will significantly increase the local prices in the surrounding regions. For the smallest production sizes, the average biofuel gate price will be equal to the domestic pulpwood prices for 5 or more production units, which shows that for the smallest production sizes, the biofuel plant will be spread out and raise the domestic price equally in all regions. However, for the smallest production size, the biofuel gate prices vary by as much as 9 €/m3. For the medium and large production sizes is the spread in biofuel gate prices less evident, but the prices are in general higher than for the smallest production sizes, showing that larger production units will impact the local prices more than smaller production units.
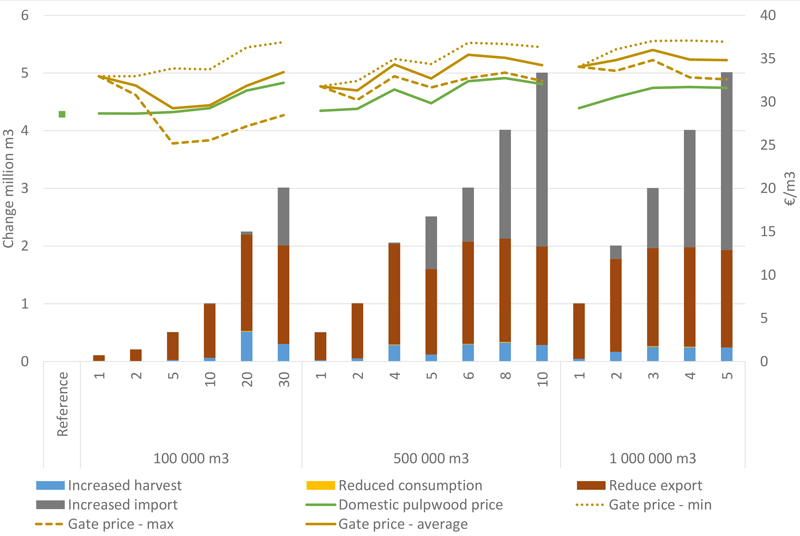
Fig. 5. Modelled biomass supply in Norway for different biofuel production scenarios with the use of pulpwood as raw material. The figure includes increased harvest, increased collection of harvest residues, reduced consumption in the existing industry, reduced export, and increased import of biomass (right axis), domestic pulpwood price, and the minimum, maximum, and average gate prices for the biofuel plant (right axis).
3.3 Where does the biomass come from?
Since none of the Norwegian regions is large enough for supplying a single biofuel plant with pulpwood, trade with other parts of Norway and other countries is important. Fig. 6 shows changes in the sourcing of biomass for the different biofuel production setups. Only 1–7% of the total demand is from increased harvest within the same region, and this increase is highest for small production units. Since many of the biofuel production units are in regions that are exporters today, they would reduce the export first before increasing the harvest. The amount of local supply, which is defined as harvest and reduced export in the specific region, is highest for the smallest production sizes (61–72%), while the largest production size only gets 8–21% of the biomass from local sources, of which 27–99% is redirected from nearby regions within the same county where the biofuel production unit is located, while 0–50% of the biomass is directly or indirectly from other parts of Norway. Most of this is transported by railroads or roads, while only up to 25% is transported by boat. When the production of biofuel uses more than 3 million m3 of biomass, an increasing amount of biomass is supplied by boat from countries outside the Nordic and Baltic countries, particularly for the biofuel plants located on the coast.
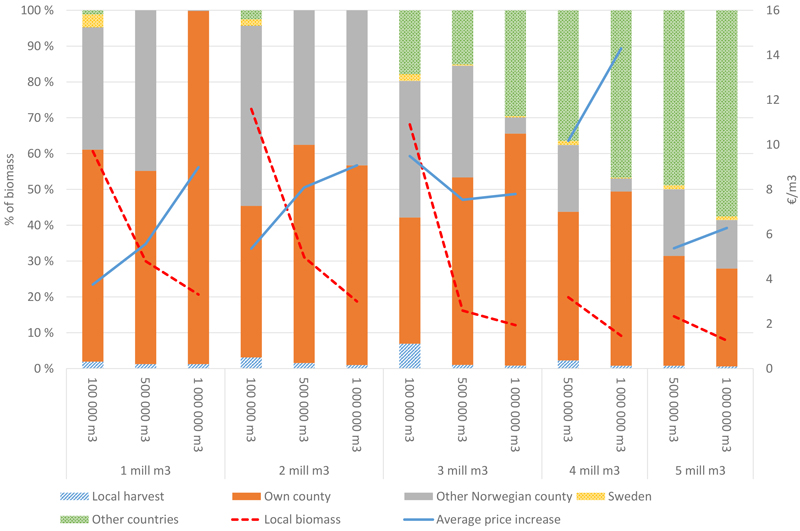
Fig. 6. Modelled proportion of the biomass that is sourced from own regions, own county, other counties in Norway, Sweden, and other countries (ROW) for the biofuel production, for the different unit sizes and total biomass demand scenarios, ranging from 1–5 million m3. The stippled line is the total biomass supplied from the local forest, defined as increased harvest and reduced export. The solid line is the increased average local price for pulpwood compared to the reference case without biofuel.
3.4 Industrial effects
The effect of biofuel production in Norway on the Norwegian forest industry is limited (Fig. 5), while the effects in other places in the world are more significant (Fig. 7). For all sizes of biofuel production units, the main source of the raw material for biofuel production is a change in net import. For small biofuel plants, the increased harvest in the other Nordic countries is the most important biomass change, since they have to increase their harvest in order to compensate for lower Norwegian export. For larger units, the Baltic forest is an important supplier. When the total biomass demand increase, the Swedish forest becomes more important and the Swedish industrial sector reduces the production volumes. The reduced industrial activity in Sweden is due to changes in the trade of final products with the rest of the world because higher pulpwood prices reduce the profitability of the Swedish pulp and paper sector, but this is most evident for plants that rely on imported Norwegian biomass. As a result, in some regions and for some products in Sweden and Baltic countries, the production increases slightly with biofuel production in Norway. It is mainly the use of by-products from sawmills that are increasing due to a small increase in sawnwood production. Most of the reduced consumption in existing industries is within pulp and paper production in Sweden and Finland. The reason for this is that pulp and paper production is the largest consumer of pulpwood, which is demanded from the biofuel plant. The effect on non-Norwegian countries is moderately dependent on the biofuel production sizes, and the effect is relatively higher for the biofuel plants located on the coast.
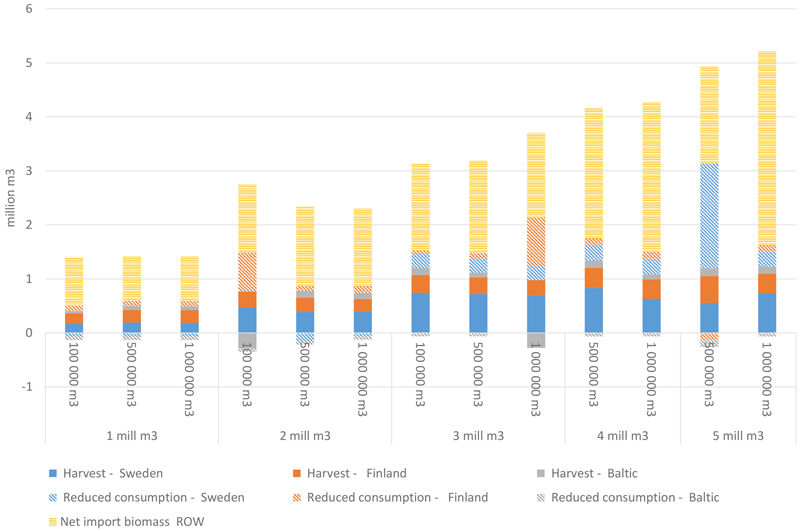
Fig. 7. Modelled effect of Norwegian biofuel production (x-axis) has on the other modelled countries. The figure includes harvest increase and change in industrial consumption (reduced consumption is a positive number) for pulpwood and by-products and net import of roundwood to a Nordic country from an import/export region for selected total biomass demand groups and biofuel production setups. The shown effects are mainly the indirect effect of change in net export as shown in Fig. 5.
A conclusion from the base scenarios is that for small to medium size production units, domestic feedstocks will be used first, mostly for decreasing the export. And, with increasing production volumes, biofuel producers will start to be importers of raw materials. Furthermore, even small biofuel plants will reduce the export from Norway and therefore impact the forest sector in other countries as well. In the next section, we look at the effect if we change the feedstock to other forest biomass grades.
3.5 Sensitivity of alternative raw materials
In this section, we look at the effects of the consumption for biofuel production only can use 1) harvest residues, 2) spruce pulpwood, 3) pine pulpwood, 4) by-products from the sawmills, and 5) all raw materials mentioned in 1) – 4). Fig. 8 shows the optimal proportion of biofuel plants that are located at the coast or by railways divided into three main categories for 10, 20, and 30 biofuel plants, each with an input capacity of 100 000 m3 per year and for the different feedstock scenarios. When the raw materials for biofuel production are spruce and pine pulpwood, most of the biofuel plants (80–100%) are located in regions without access to railways or far from the coast for the smallest total production size (1 million m3, i.e., 10 plants), while with the increased number of plants, this share reduces (33–73%). This shows that a large share of biofuel plants will most likely be located in regions less suitable for direct import. This is especially relevant if the raw material is spruce pulpwood which is the main species (over 70%) of pulpwood in Norway. The ten first biofuel plants will all be located neither close to the railway nor the coast if only allowed to use spruce pulpwood as the only raw material. However, when the raw material changes to pine pulpwood only, more biofuel production units will be located in regions that are suitable for biomass import. If the raw material is harvest residues only, the sum of the share of biofuel plants located at the coast and by railways is almost constant at 50%, so the import of harvest residues is likely to be necessary. This is, however, an uncertain result since harvest residues are barely traded long-distance today. Sawmill residues are the raw material that will be mainly dependent on importing by boat since most Norwegian sawmills are too small to supply a biofuel plant of 100 000 m3 demand per year. Hence, trade between different regions is needed and importing via shipping and railways is the lowest-cost solution.
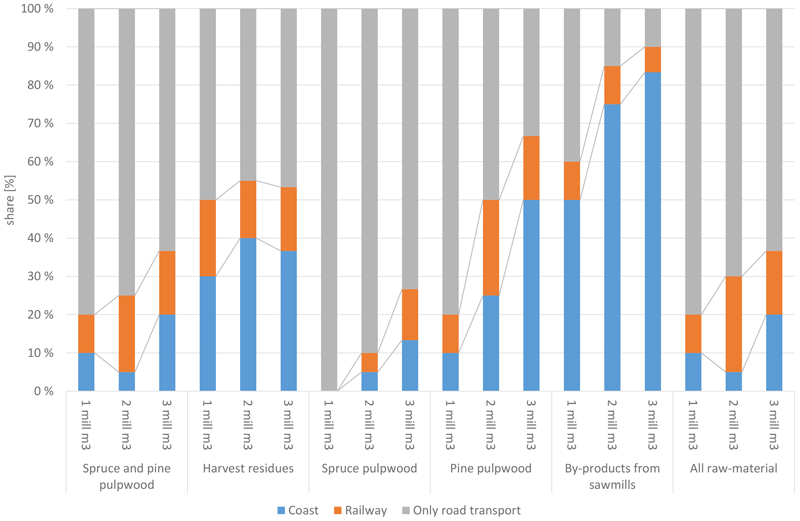
Fig. 8. Modelled optimal location for biofuel plants with input size of 100 000 m3 and total demand of 1–3 million m3 for the different scenarios. The blue bar represents the share of biofuel plant located in a municipality with a harbour, the orange bar is the share of biofuel plants that are located at a timber terminal along a railway and the grey bar represent locations that have eighter harbour or timber terminal within the same municipality.
In the following, we focus on the impact of the raw materials on pulpwood price, as well as on biomass supply and trading patterns. As Fig. 9 shows, the pulpwood price heavily depends on the raw materials used for biofuel production and total production. With biofuel production from spruce and pine pulpwood, the pulpwood prices increase by up to 15%. The same increase is found in the scenario that allows for the use of all raw materials since pulpwood is the most used feedstock. The pulpwood price increases the most when only using spruce pulpwood as raw material, and the increase is as high as 30% when the total demand is 5 million m3. This occurs since spruce pulpwood accounts for approximately two third of the total pulpwood harvest. Regarding the scenario with biofuel production only from pine pulpwood, the price increase is lower than 10%, but the increased pine pulpwood prices are 31%. If the material for biofuel production is purely harvest residues or sawmill residues, the effect on pulpwood price is limited due to no direct connection between the pulpwood prices and consumption of harvest residues or sawmill residues. The prices for spruce and pine pulpwood and all raw materials peak at a total consumption of 4 million m3 because more of the biomass is allocated to importing regions. Hence, a lower price increase in the main forestry regions in Norway (inland area) is observed.
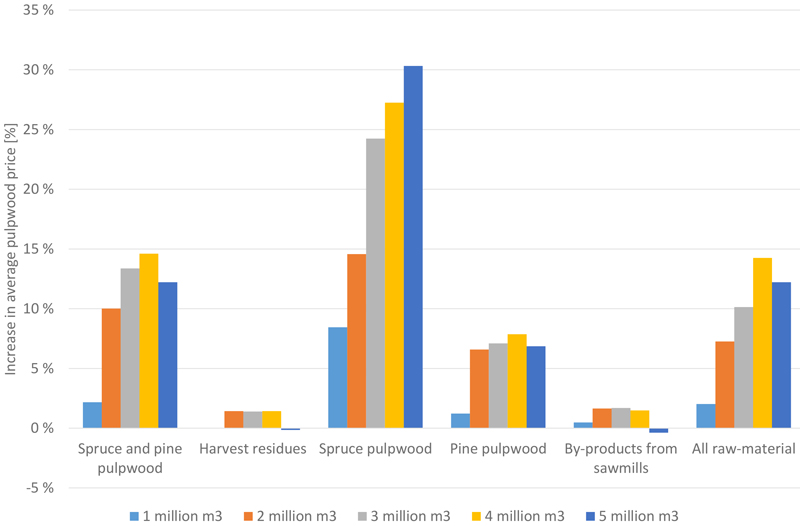
Fig. 9. Modelled increase in average pulpwood prices as a share of the reference pulpwood prices in Norway for the different scenarios, all scenarios are based on unit production size 500 000 m3. The scenario “Spruce and pine pulpwood” is the base scenario and allows the production of biofuel from spruce and pine pulpwood only, “Harvest residues” allow biofuel production from harvest residues, “Spruce pulpwood” allow biofuel production from spruce pulpwood, “Pine pulpwood” allow biofuel production from pine pulpwood, “By-products from sawmills” allow biofuel production from by-products from sawmilling, and finally, “All raw-materials” allow biofuel production from spruce, pine, and non-coniferous pulpwood, harvest residues, and by-products from sawn mills.
The changes in the domestic forest sector differ substantially between the different raw materials for biofuel production. In the case of the use of spruce and pine pulpwood, the model starts to reduce the export out of Norway and redirect the biomass to biofuel production. When the total demanded biomass exceeds 3 million m3, the import becomes the main source of biomass. In addition, no matter the raw material used, the least cost solution is to first reduce the export of pulpwood and then start importing. When all the export is used, the location of the next biofuel plant will be on the coast since it reduces the importing cost. In the case of using harvest residues only, the demand for local biomass collection is the highest. All scenarios assume some increase in roundwood harvest, but the highest increase in the use of local biomass is in the scenario which uses harvest residues. This is because there is no use of harvest residues in Norway today and that international transportation of harvest residues is assumed not to be economically attractive before most of the local harvest residues are utilized. As a result, up to 63% of the techno-economical potential of harvest residues is collected domestically. In the regions close to the biofuel plant, the entire local potential is used. The use of harvest residues will mainly impact the local biomass market, while other feedstocks will have a greater impact outside the Norwegian borders. The reason is that the available biomass exceeds the demand for biofuel production when harvest residues are used. Using harvest residues increases the value of harvest residues, which will increase the profit of harvesting roundwood and hence increase the roundwood harvest. Since, in this scenario, only harvest residues are a possible source for biofuel production, the increased roundwood harvest cannot be used for biofuel production and there is therefore an upward shift in the local supply of roundwood. In the scenario with the use of by-products from sawmills, most of the needed biomass is imported directly. Norway does not have enough by-products to supply the consumption of one single biofuel plant with an input size of 500 000 m3. Biofuel producers from by-products that only want to use domestic biomasses should have small factory sizes or use a combination of by-products and pulpwood.
4 Discussion and conclusion
This study focuses on optimal location and implication on the existing forest industry if large-scale biofuel plants are located in Norway. As a distinction from previous studies, we find the endogenous location of biofuel plants for different sizes and numbers of plants. We find that the model favours regions with non-existing forest industries for small biofuel production units. It should be noted that there is a reason why the traditional forest industry is not profitable in these regions. For this reason, the model may overestimate the availability of forest biomass or underestimate the logging costs. Since those regions are characterized by steep hills, few forest roads, and low site index. In addition, another conclusion of the profitability in those regions might be obtained if a longer period had been considered than one year.
As is the case with all model studies, this study, too, has some limitations and simplifications that may impact the results. One of the main simplifications is that the model assumes that transportation of biomass has to go through the regional centre and the transportation cost per m3 is constant per km transported independently of the quantities for both domestic and international trade. Further, it is assumed that trade happens frictionless and with fixed costs. This may overestimate the trade possibilities and underestimate the price difference between regions. It is assumed that all market actors can adapt to every change immediately, hence a truly competitive market is presumed. Furthermore, only short-term shock effects are included. The optimal location of the biofuel plant may be different from a long-term perspective since the model does not consider that the forest increment will be distinct over time in different regions. This neglects cases where the net growth becomes negative (annual harvest exceeds the increment), and the increase in the roundwood price is hence underestimated. The known or expected biofuel production in other Nordic countries is not included. This is a simplification that may overestimate the availability of low-quality feedstock in the combined Nordic timber market. If we had included biofuel production in other countries, the difference would likely be higher prices for pulpwood and sawmill residues in the Nordic countries, which may reduce the import of biomass in Norway or at least increase the importing prices. This could affect the allocation, but since we exogenously set the biofuel demand, the effect will be limited.
Future studies may focus on some of the simplifications mentioned above in section 2. The insights could be improved by a study focusing on long-term rather than short-term shock effects which the present study focuses on. Another topic for further work may be to include existing and planned biofuel plants in other countries and to include sales of final products in the optimisation procedure.
This study focuses on the optimal location of biofuel production units based on the unit size and total biomass demand scenarios. The study uses Norway as a case study, but the findings are relevant to other parts of the world. We conclude that the optimal location for small-scale biofuel producers is in the regions that initially have low pulpwood prices, are far from existing industries, and have poor trading facilities. The optimal location for small-scale production is explained by the fact that producers can get most of the raw material from a relatively small area, and for the first production unit, with a lower gate price than the average national prices. However, with the increase in unit size and/or number of facilities, biofuel production will increase the local demand and pulpwood prices more significantly. Hence, locating the plant in regions closer to the trading ports becomes more attractive in these cases. In the Norwegian case, this means locating the plants close to railways or the coast. In most cases, the national export is reduced before other changes happen. After the export is reduced to zero, the biofuel plant starts to import biomass from other Nordic countries or the world market, and therefore, a location close to a harbour is preferable. Consequently, small biofuel plants will increase the value in exporting areas that are far from existing industries today, and forest owners close to a biofuel plant will profit both through the increased roundwood prices and harvest levels. Larger biofuel plants tend to impact the current markets more due to their location in regions with high harvest and industry activities. However, the regions close to a harbour or railway are comparatively less impacted because they can import relatively low-cost biomass from other places.
Biofuel production in Norway will reduce the export of timber to Sweden and may turn Norway from a net exporter into a net importer of roundwood. This may affect the biomass supply pattern and industry activities in Sweden. The biofuel production, however, is expected to only have a marginal effect on existing Norwegian industrial production. The sawnwood producers both in Norway and other countries are likely to get slightly increased revenues from selling by-products such as wood chips and sawdust to producers that must buy pulpwood at higher prices.
The optimal location of biofuel plants is highly related to their raw material demand, due to the different supply sources. If the sourcing of the feedstock relies more on imports, such as sawmill residues, then the optimal location will be close to the coast. This will be the case with the expansion of the biofuel production scale. However, if the raw material is more locally sufficient, like spruce pulpwood, most of the biofuel plants will be located in the regions that neither have access to the railway nor to the harbours since most of the biomass will be supplied from local sources.
Funding
Funding for this study was provided by the Research Council of Norway through the scheme ‘Enabling the green transition in Norway’ [NRF-308789], ‘Norwegian Centre for Sustainable Bio-based Fuels and energy (Bio4Fuels)’ [NRF-255265], and ‘Circular use of wood in Norway for improved sustainability and innovation – CircWOOD’ [NRF-328698].
Data availability
All data and the model code used in this paper will be available upon request to the correspondence author.
Authors’ contributions
Eirik Ogner Jåstad: Conceptualization; Data curation; Formal analysis; Funding acquisition; Investigation; Methodology; Project administration; Resources; Software; Validation; Visualization; Roles/Writing - original draft; Writing - review & editing.
Niels Oliver Nagel: Conceptualization; Validation; Roles/Writing - original draft; Writing - review & editing.
Junhui Hu: Conceptualization; Validation; Roles/Writing - original draft; Writing - review & editing.
Per Kristian Rørstad: Conceptualization; Project administration; Funding acquisition; Supervision; Validation; Writing - review & editing.
References
Bolkesjø TF, Obersteiner M, Solberg B (2003) Information technology and the newsprint demand in Western Europe: a Bayesian approach. Can J For Res 33: 1644–1652. https://doi.org/10.1139/x03-083.
Buongiorno J (2015) Income and time dependence of forest product demand elasticities and implications for forecasting. Silva Fenn 49, article id 1395. https://doi.org/10.14214/sf.1395.
Camia A, Giuntoli J, Jonsson R, Robert N, Cazzaniga NE, Jasinevičius G, Avitabile V, Grassi G, Barredo JI, Mubareka S (2021) The use of woody biomass for energy purposes in the EU. EUR 30548 EN, Publications Office of the European Union, Luxembourg, JRC122719. https://doi.org/10.2760/831621.
de Jong S, Hoefnagels R, Wetterlund E, Pettersson K, Faaij A, Junginger M (2017) Cost optimization of biofuel production – the impact of scale, integration, transport and supply chain configurations. Appl Energ 195: 1055–1070. https://doi.org/10.1016/j.apenergy.2017.03.109.
European Commission (2021) Primary woody biomass. https://knowledge4policy.ec.europa.eu/glossary-item/primary-woody-biomass_en. Accessed 25 November 2022.
European Commission (2022) Renewable energy directive. https://ec.europa.eu/energy/en/topics/renewable-energy/renewable-energy-directive. Accessed 15 November 2022.
European Parliament (2022) Renewable energy directive ***I P9_TA(2022)0317. https://www.europarl.europa.eu/doceo/document/TA-9-2022-0317_EN.html#title2. Accessed 14 September 2022.
FAOSTAT (2022) Forestry production and trade. http://www.fao.org/faostat/en/#data/FO. Accessed 8 February 2022.
GAMS Development Corporation (2021) General Algebraic Modeling System (GAMS) release 30.3. Washington, DC, USA. https://www.gams.com/. Accessed 5 May2017.
Grønland SE (2018) Kostnadsmodeller for transport og logistikk – basisår 2016. [Cost models for transport and logistics – base year 2016]. Institute of Transport Economics, Report 1638/2018. ISBN 978-82-480-2150-6.
Hämäläinen E, Hilmola O-P (2017) Energy efficiency at the paper mill – dilemma of improvement. Energ Effic 10: 809–821. https://doi.org/10.1007/s12053-016-9490-3.
Hetemäki L, Hurmekoski E (2016) Forest products markets under change: review and research implications. Curr For Rep 2: 177–188. https://doi.org/10.1007/s40725-016-0042-z.
IBM (2020) CPLEX Optimizer. https://www.ibm.com/analytics/cplex-optimizer. Accessed 25 March 2020.
Jåstad EO, Bolkesjø TF, Trømborg E, Rørstad PK (2019) Large-scale forest-based biofuel production in the Nordic forest sector: effects on the economics of forestry and forest industries. Energ Convers Manage 184: 374–388. https://doi.org/10.1016/j.enconman.2019.01.065.
Jåstad EO (2020) Assessments of the future role of bioenergy in the Nordic energy and forest sectors. Doctoral thesis. Norwegian University of Life Sciences (NMBU), Ås. https://hdl.handle.net/11250/3053968.
Jåstad EO, Bolkesjø TF, Rørstad PK, Midttun A, Sandquist J, Trømborg E (2021) The future role of forest-based biofuels: industrial impacts in the Nordic countries. Energies 14, article id 2073. https://doi.org/10.3390/en14082073.
Jenkins TL, Jin E, Sutherland JW (2020) Effect of harvest region shape, biomass yield, and plant location on optimal biofuel facility size. Forest Policy Econ 111, article id 102053. https://doi.org/10.1016/j.forpol.2019.102053.
Kallio AMI, Chudy R, Solberg B (2018) Prospects for producing liquid wood-based biofuels and impacts in the wood using sectors in Europe. Biomass Bioenergy 108: 415–425. https://doi.org/10.1016/j.biombioe.2017.11.022.
Kartverket (2022) GeoNorge. https://www.geonorge.no/. Accessed 23 February 2022.
Landbruksdirektoratet (2022) Avvirkningsstatistikk - innmålt - hele landet. Periode: 2021. [Deforestation statistics - measured - the whole country. Period: 2021]. https://www.landbruksdirektoratet.no/no/statistikk/skogbruk/tommeravvirkning. Accessed 6 July 2022.
Luke (2022a) Harvesting volumes of energy wood per region (1000 m³). https://statdb.luke.fi/PxWeb/pxweb/en/LUKE/LUKE__04%20Metsa__02%20Rakenne%20ja%20tuotanto__06%20Puun%20markkinahakkuut__04%20Vuositilastot/04_Energiapuun_korjuu_v.px/table/tableViewLayout2/?loadedQueryId=a0e20d18-6d2e-466a-82c4-85bfafac4f23&timeType=top&timeValue=1. Accessed 6 July 2022.
Luke (2022b) Roadside prices of roundwood by year and by region. http://statdb.luke.fi/PXWeb/pxweb/en/LUKE/LUKE__04%20Metsa__04%20Talous__02%20Teollisuuspuun%20kauppa__04%20Vuositilastot/04_Hankintahinnat_v_maakunnittain.px/table/tableViewLayout1/?rxid=e24139b3-1c30-4106-9e4d-6c586c17086e. Accessed 3 July 2022.
Lundmark R, Forsell N, Leduc S, Lundgren J, Ouraich I, Pettersson K, Wetterlund E (2018) Large-scale implementation of biorefineries: new value chains, products and efficient biomass feedstock utilisation. http://pure.iiasa.ac.at/15350.
Malladi KT, Sowlati T (2018) Biomass logistics: a review of important features, optimization modeling and the new trends. Renewable Sustainable Energy Rev 94: 587–599. https://doi.org/10.1016/j.rser.2018.06.052.
Mustapha W (2016) The Nordic Forest Sector Model (NFSM): data and model structure. Norway Norwegian University of Life Sciences, Department of Ecology and Natural Resource Management, Ås, INA fagrapport. https://static02.nmbu.no/mina/publikasjoner/mina_fagrapport/mif.php.
Mustapha WF, Trømborg E, Bolkesjø TF (2017) Forest-based biofuel production in the Nordic countries: modelling of optimal allocation. For Policy Econ 103: 45-54. https://doi.org/10.1016/j.forpol.2017.07.004.
Rørstad P, Solberg B, Trømborg E (2022) Can we detect regional differences in econometric analyses of the Norwegian timber supply? Silva Fenn 56, article id 10326. https://doi.org/10.14214/sf.10326.
Rørstad PK, Bolkesjø TF, Trømborg E (2019) Nordic energy and forest products market review and outlook. Faculty of Environmental Sciences and Natural Resource Management, Norwegian University of Life Sciences, Ås, Norway. MINA fagrapport 56. https://static02.nmbu.no/mina/publikasjoner/mina_fagrapport/mif.php.
Schröder T, Lauven LP, Sowlati T, Geldermann J (2019) Strategic planning of a multi-product wood-biorefinery production system. J Clean Prod 211: 1502–1516. https://doi.org/10.1016/j.jclepro.2018.12.004.
Skogstyrelsen (2022) 01. Gross felling (million m3) by assortment of stemwood. Year 1942–2021 Forecast. https://pxweb.skogsstyrelsen.se/pxweb/en/Skogsstyrelsens%20statistikdatabas/Skogsstyrelsens%20statistikdatabas__Avverkning/JO0312_01.px/. Accessed 6 July 2022.
Statistics Denmark (2022) Felling in forests and plantation in Denmark. https://m.statbank.dk/TableInfo/SKOV6#. Accessed 6 July 2022.
Trømborg E, Solberg B (1995) Beskrivelse av en partiell likevektsmodell anvendt i prosjektet ”Modellanalyse av norsk skogsektor”. [Description of a partial equilibrium model applied in the project ”Modelling the Norwegian Forest Sector”]. Skogforsk, Ås, Report 14/95.
Tropicos.org (2023) Missouri Botanical Garden. https://tropicos.org/. Accessed 22 Feb 2023.
Zhang F, Wang J, Liu S, Zhang S, Sutherland JW (2017) Integrating GIS with optimization method for a biofuel feedstock supply chain. Biomass Bioenergy 98: 194–205. https://doi.org/10.1016/j.biombioe.2017.01.004.
Total of 34 references.
