Virpi Stenman  ,
Annika Kangas,
Markus Holopainen
,
Annika Kangas,
Markus Holopainen
Upper stem diameter and volume prediction strategies in the National Forest Inventory of Finland
Stenman V., Kangas A., Holopainen M. (2023). Upper stem diameter and volume prediction strategies in the National Forest Inventory of Finland. Silva Fennica vol. 57 no. 3 article id 23021. https://doi.org/10.14214/sf.23021
Highlights
- National Forest Inventory specific methods were applied with a number of measurement instruments, including a laser-based dendrometer, to collect tree stem diameter measurements
- Bland-Altman plots and measurement error variances were used to determine measurement precision and accuracy
- The laser-based dendrometer did not perform better than the other instruments in the study.
Abstract
In forest inventories, field data are needed for the prediction of tree volumes. However, gathering field data requires resources, such as labour, equipment, and data management operations. This means that time and budget, as well as quality, must be carefully considered when National Forest Inventory (NFI) field measurement activities are planned. Therefore, the development of cost efficient, simple, safe and reliable measurement methods and tools are of great interest. To date, upper stem diameter (d6), which provides a more reliable estimation of tree stem volume, has typically been measured with a parabolic calliper. In this study, the performance of the Criterion laser-based dendrometer was examined for d6 measurements. A total of 326 sample trees were measured multiple times with three different measurement instruments. These instruments were used to measure diameter at breast height (dbh) as well as d6 measurements. Bland-Altman plots and measurement error variances were used to determine measurement instrument reliability. For all trees, the standard deviation for the laser based dendrometer was 18.73 mm at dbh and 15.36 mm for the d6 measurements. When the performance of Criterion was analysed with reference to the mean value of repeated measurements, the standard deviation in the dbh measurements was 12.21 mm, and 8.88 mm in the d6 measurements.
Keywords
forest inventory;
measurement errors;
accuracy;
Bland-Altman plot
-
Stenman,
University of Helsinki, Department of Forest Resource Management, P.O. Box 27, FI-00014 University of Helsinki, Finland
 https://orcid.org/0000-0003-1176-7840
E-mail
virpi.stenman@helsinki.fi
https://orcid.org/0000-0003-1176-7840
E-mail
virpi.stenman@helsinki.fi
-
Kangas,
Natural Resources Institute Finland (Luke), Bioeconomy and Environment, P.O. Box 68, FI-80101 Joensuu, Finland
https://orcid.org/0000-0002-8637-5668
E-mail
annika.kangas@luke.fi
- Holopainen, University of Helsinki, Department of Forest Resource Management, P.O. Box 27, FI-00014 University of Helsinki, Finland E-mail markus.holopainen@helsinki.fi
Received 3 April 2023 Accepted 21 September 2023 Published 28 September 2023
Views 31228
Available at https://doi.org/10.14214/sf.23021 | Download PDF

1 Introduction
The purpose of national level forest data is to provide comprehensive and reliable information of forest resources (Tomppo et al. 2011). This information can be used for an estimation of the status and change in forests, and as an input data in future scenarios. Several international entities, such as European environmental information systems use forest resource information as inputs in their decision-making processes and this information also provides data for several global reporting requirements (Chirici et al. 2011). Therefore, there is an increasing need for more accurate and reliable information of forest resources at all scales from local to global (Haakana et al. 2008).
In Finland, the first national forest inventory (NFI) was carried out in the early 1920s, and since then, inventory updates have been repeated in 5 to 10-year cycles so that the collected data forms a 100-year time series (Haapanen 2014). Data for the most recently published forest resource information in Finland was gathered in the 12th NFI (2015–2018), so the current (and ongoing) inventory rotation is the 13th NFI.
As forest resource information is used in decision-making activities, the inventory methods should be reliable and efficient (Tomppo et al. 2014). Common challenges regarding inventory related field measurements have been to achieve a high degree of accuracy, unbiasedness, and cost-efficiency. For practical reasons, it is not possible to measure every tree in the forest or all the required variables in large area inventories, such as NFI. This means that sampling methods need to be applied and field measurements must be efficient so that the number of the most expensive measurements, such as tree height and upper stem diameter (d6) are optimised. Therefore, in the Finnish NFI, these characteristics are measured only for a subset of sample trees (Tomppo et al. 2014).
Volume estimates of the growing stock and increments are based on detailed measurements of the sample trees, the use of existing allometric volume models and the generalisation of the sample tree measurements to tallied trees. Based on field measurements, estimates of the volume of the growing stock, for instance, can then be made for the entire country (Metsäntutkimuslaitos 2015). However, NFI methods are under continuous development, and changes are implemented, for instance, due to new demands or due to technological developments.
During earlier NFI rotations and for instance in the 11th NFI, d6 was included in the field measurements and was measured for standing sample trees and over bark at a height of 6 meters above ground level. This measurement was taken in 1-cm increment classes for trees > 8.1 meters in height, using a parabolic calliper attached to a 5-meter aluminium rod.
The upper diameter measurements have been used in the NFI, as volume estimates are more accurate when d6 is also used as an explanatory variable in addition to diameter at breast height (dbh) and height (h) (Laasasenaho 1982). However, as the trunk shape of a tree changes in response to forest management practices and environmental conditions (Kangas et al. 2020), volume estimates that are obtained by only using diameter (d) and height (h) tend to be biased (Korhonen 1992). Therefore, stem volume models need to be calibrated, and the measurement of d6 is of critical importance in that process. In addition, field data that includes d6 measurements, for instance, has considerable potential to improve the results of the automatised terrestrial laser scanner (TLS) analysis for the prediction of tree stem volumes (Pitkänen et al. 2021).
The measurement of d6 is time consuming, expensive and is prone to measurement errors (Korhonen 1992). Tree characteristics, such as the shape of the stem, the density of branches and tree species influence the accuracy of the d6 measurement (Metsäntutkimuslaitos 2009). Errors in d6 measurements can be identified as recording errors or as instrument placement errors. The former can be caused by poor visibility, and incorrect reading or recording of the measurement, while the latter can be caused by incorrect measurement height or incorrect angle of the measuring instrument. Additional issues are related to the impracticality of carrying the calliper and the 5-meter rod, as the number and size of measurement instruments has an impact on the efficiency of field work.
The objective of this study was to compare several instruments for the field measurement of dbh and d6. Bland-Altman plots and measurement error variances were applied to determine measurement-related uncertainties. To assess its potential in NFI field measurements, the accuracy and precision of the laser-based dendrometer, Criterion, were examined regarding d6 measurements. This study is based on a Master thesis (Stenman 2019).
2 Materials
2.1 Study area
Field data for this study were gathered during summer 2016 in the Lapinjärvi research forest located in southern Finland (60°42´N, 26°06´E), which is within the southern boreal forest zone. The research forest includes a wide variety of management regimes and many forest types within a small area. Tree measurements were carried out in 18 sample plots by the crew of two persons (Fig. 1).
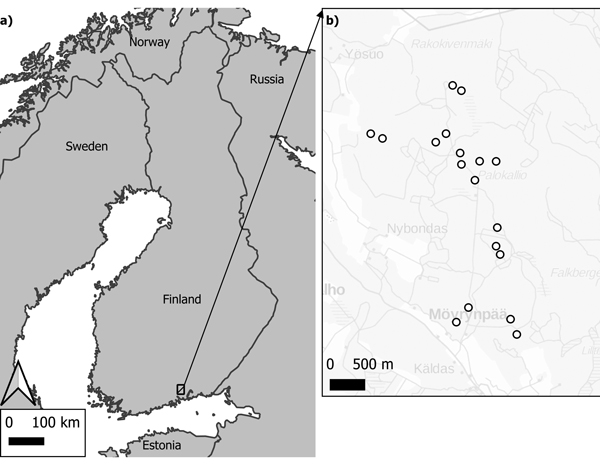
Fig. 1. Study area of Lapinjärvi research forest, located in southern Finland. Map derived for countries 1:1 M (a)/© QGIS; Back-ground map for sample plot area of interest 1:1 M (b)/© National Land Survey of Finland/ WMS open data licensed under a CC 4.0 license.
2.2 Tree measurements
Tree measurements followed the guidance outlined in the 12th NFI, and all field data was stored on a field computer. A total of 326 sample trees were measured in the field. Upper stem diameter was measured at a height of 6 meters perpendicular to the radius to of the plot centre. Traditionally, d6 measurements have been taken with a parabolic calliper but a dendrometer device, such as Criterion RD 1000 (Laser Technology 2006) has also been used. In this study, d6 was repeatedly measured in 250 sample trees with the Criterion laser dendrometer by both observers. Additionally, the same trees were measured with a parabolic calliper either by observer 1 or 2 (Table 1).
The Criterion instrument was also used for dbh measurements, which was measured twice for the same 250 sample trees. In addition, dbh measurements for the same sample trees were taken with a Sonar calliper instrument. However, observer information was not recorded for the Sonar calliper dbh measurements. Therefore, the specific Sonar calliper observer is either 1 or 2 in Table 1. The need for Sonar calliper dbh measurements in this study was based solely on the use of dbh measurement errors as a reference point for the measurement errors associated with the d6 measurements.
In the precision and variance analyses of the two measurement instruments, the Criterion measurements were compared with the Sonar calliper-specific dbh and the calliper-specific d6 measurements. A steel calliper was not used in this study, and the measurement accuracy data from earlier research conducted by Hyppönen et al. (1978) were used to describe the accuracy of the Sonar calliper measurement. Note: The operating principle for a steel calliper and the Sonar calliper is the same.
The field data contained a few outliers where the difference between the evaluated and referenced observations was >10 cm. These outliers were removed from the data. For instance, three observations identified as outliers in the dbh standard error analysis were removed due to incorrect marking or reading of the measurement. All observations with >10 cm difference between the observation and the reference data were removed from the variance analysis. These types of measurement errors were typically caused by incorrect reading or input during data gathering.
Measurements of deciduous trees were managed as one group, which consisted of silver (Betula pubescens Roth) and downy (Betula pendula Ehrh.) birches, aspen (Populus tremula L.) and grey alder (Alnus incana (L.) Moench). Scots pine (Pinus sylvestris L.) and Norway spruce (Picea abies (L.) H. Karst.) were in their own groups (Table 1).
| Table 1. Quantity of measured sample trees by measurement instrument, measured variable, observer, and tree species. Measured variables are diameter at breast height (dbh) and upper stem diameter (d6). | |||||||
| Instrument | Sonar | Criterion | Calliper | ||||
| Variable | dbh | dbh | d6 | d6 | |||
| Observer | 1 or 2 | 1 | 2 | 1 | 2 | 1 | 2 |
| Scots pine | 112 | 108 | 107 | 108 | 107 | 59 | 49 |
| Norway spruce | 142 | 130 | 101 | 130 | 101 | 52 | 78 |
| Birch | 64 | 61 | 35 | 61 | 35 | 25 | 35 |
| Aspen | 4 | 4 | 4 | 4 | 4 | 3 | 1 |
| Grey alder | 4 | 3 | 3 | 3 | 3 | 1 | 2 |
| Sample trees total | 326 | 306 | 250 | 306 | 250 | 140 | 165 |
The field data was recorded in a Psion Workabout Pro -field computer and transferred to an excel file in comma-separated values (CSV) data format. This data format enabled the further data analysis operations in RStudio (RStudio Team 2020).
2.3 Measurement instruments
The Sonar calliper is a measurement and data collection instrument manufactured by Masser Oy. It is an electronic calliper that utilises Bluetooth technology to connect the calliper to the data collection device, such as a field computer. In this study, the Sonar calliper was used for dbh measurements, and was also used to measure the distance between the sample tree and the sample plot centre point. The distance was measured as the horizontal distance at dbh.
The parabolic calliper with a 5-meter aluminium rod is a measurement instrument that can be used to measure stem diameter at positions on the stem that cannot otherwise be reached from the ground. In this study, the parabolic calliper was used to measure d6 of standing sample trees. The measurement was taken over bark at a height of 6 meters, and at 1-cm increment classes for trees > 8.1 meters in height. Prior to taking a measurement, the aluminium rod was placed along the tree stem by matching the dbh indicator on the rod with the dbh measurement marking on the tree stem. The dbh indicator on the rod was placed 30 cm from the bottom of the rod so that the height of the dbh measurement and the remaining rod length summed up to 6 meters from ground level for the correct height of the d6 measurement. The calliper measurement was read from the right side of the tree stem based on the calliper scale and diameter class. As the calliper scale was between 2–38 cm, trees greater than the scale were not used in the statistical analysis.
The Criterion instrument can be used as a basal area factor scope (i.e., relascope) or as a dendrometer. As a relascope, Criterion visually estimates whether trees are within a given plot as related to the specified basal area factor. In this study Criterion was used as a dendrometer. The Criterion RD 1000 device utilises laser technology, where a laser beam is used to measure the distance to the object. The in-scope light emitting diode (LED) generates a measurement bar that represents the subtended horizontal angle. This angular measurement and the horizontal distance to the target tree are used when the diameter of the tree stem is calculated (Laser Technology, 2006).
As a dendrometer, Criterion can be used to measure the diameter of the tree stem (between 5–254 cm) at any height. However, the distance between the observer and the object is required as an input value before dbh or d6 measurements are taken. The distance in this context denotes horizontal distance, i.e., the level distance between the dendrometer eyepiece and the point of the measured object on the surface of the tree (Laser Technology 2006). Distance to tree was measured with a Vertex ultrasound transponder on the tree stem at the dbh level. The transponder was also utilised for tree height measurements and was calibrated before any measurement operations were performed in the sample plot. Target visibility was further improved by an attachable magnifier. In addition, a monopod was attached to Criterion to decrease instrument wobble and to stabilise the measurement operation.
For dbh and d6 measurements, Criterion offered two alternative measurement bars (Fig. 2). During the initial instrument testing, it was noted that the Gap Bar scale was more suitable for diameter observations and was therefore applied in this study.
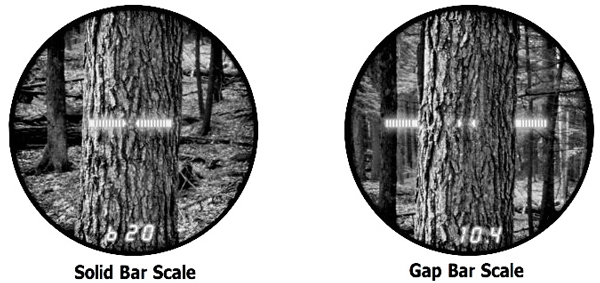
Fig. 2. Criterion RD 1000 instrument setup options for the diameter measurement bars (Laser Technology 2006).
3 Methods
When precision or accuracy of a new measurement method is analysed in forest sciences, the field measurements utilised as reference data are usually assumed to be the absolute truth. If reference data related errors are ignored, the assessment of the measurement errors involved with the new method are overestimated. For instance, in tree-level comparisons, field measurements always contain some measurement errors. Therefore, the applied statistical analysis methods in this study were heavily influenced by the available reference data for the variable observations.
Traditional linear regression is a good analysis method when reference variables are identifiable and error free. In the linear regression method, the relationship between the explanatory and dependent variables cannot be switched as it will have an impact on the outcome. This means that when there are errors in both the X and Y variables, differences between the model and data are only minimised in one direction at a time (Ji and Gallo 2006). Therefore, the ordinary least squares (OLS) method typically does not work well in this type of equipment accuracy analysis. If OLS were applied, the measurement errors would result in biased coefficients for the OLS regression lines (c.f. Altman and Bland 1983). As an alternative, geometric mean functional relationship regression can be utilised (Angleton and Bonham 1995). However, neither method was applied in this study as the range of measurement errors was very small in comparison to the observed range of diameters, thereby resulting in regression lines that were very close to the 1:1 line.
3.1 Bland-Altman plots
In this study, the differences between the measurement instruments were analysed using Bland-Altman plots (Altman and Bland 1983). The Bland-Altman difference plot can be used to compare two measurements of the same variable that both contain some errors. In the Bland-Altman plot, the mean measurement value is placed on the x-axis and the difference between the measurements is placed on the y-axis. It is expected that the values cluster around the mean of the differences line, which also describes the bias. If this line is > 0, the values for the measurement method selected as the control method tend to be greater than the values for the other method selected for evaluation. The conclusion is opposite if the line is < 0.
The Bland-Altman plot offers ±2 standard deviation of the difference’s lines and the trend of the differences line. If the values are normally distributed and placed within 2 standard deviations of the mean and between-lines, they will provide the 95% limit of the confidence interval. This is also known as the limits of agreement between two measurement methods (Altman and Bland 1983). The trendline describes the difference in variances between the two measurement methods. A steeper trendline refers to a larger difference between variances. The trendline coefficient is zero if the error variances are equal, positive if the evaluated variance is smaller than the control variance, and negative in the opposite situation (c.f. Bland and Altman 1995).
3.2 Measurement error variance analysis
Measurement instrument precision and accuracy were further analysed with the measurement error variance analysis methods used earlier by Päivinen et al. (1992).
In this study, measurements were made by two observers. Some of the measured variables were measured several times, i.e., as repeated measurements. The measurement error variance for the measurement equipment under investigation was produced by first computing the empirical variance of the differences for comparable pairs of measurement equipment and by then subtracting the variance of the measurement errors for the referenced device. To determine the accuracy of the measurement instrument, paired datasets for dbh and d6 were compared. Diameter at breast height was measured with both Sonar and Criterion instruments and d6 was measured with the parabolic Calliper and Criterion. The individual observations produced by two types of measurement instrument were compared. The accuracy of the Criterion dbh and d6 measurements were calculated in relation to the reference measurements provided by the specific measurement instrument.
To determine the difference between the different measurement methods, the error variances were further examined. The upper bound standard deviation (Supper) was calculated from the variance of differences between the Criterion and Calliper measurements. As the measurement error variance is always > 0, the upper bound line for the variance is the sum of two measurement error variances. Therefore, the variance of differences provides the upper limit of measurement error variances for both compared instruments. The same approach was applied to compare the dbh measurement methods. For d6 measurement methods, Eq. 1 was applied as follows:

where:
ymethod,i = observed measurement,
yref,i = the reference value,
n = number of observed measurements.
However, the Sonar and Calliper measurements were not error free, and so standard deviations for the referenced methods were adopted from earlier studies for Calliper (Päivinen et al. 1992) and for a steel calliper (Hyppönen et al. 1978). In both earlier studies, the reference data for d6 was repeatedly measured and was checked by felling the measured trees. The utilisation of standard deviation values associated with measurement errors from earlier studies made it possible to estimate the standard deviations associated with measurement error in this study for Criterion d6, as well as for dbh measurements, by subtracting the reference methods variance ![]() from the Criterion maximum variance
from the Criterion maximum variance ![]() Eq. 2 was applied to estimate the standard deviation values for both d6 and dbh. This was possible as it was assumed that the measurement methods were independent from each other.
Eq. 2 was applied to estimate the standard deviation values for both d6 and dbh. This was possible as it was assumed that the measurement methods were independent from each other.
![]()
The mean measurement value was calculated for those measurement methods where the same variable was measured twice by different observers. The mean measurement value was assumed to represent the best estimate of the true measurement value and for each measurement method, the difference between the observer measurement and the mean repeated measurement value was calculated for d6 measurements, as described by Hyppönen et al. (1978).

where:
ymethod,ik = mean of the repeated measurements,
ymethod,i = observed measurement,
n = number of observed measurements,
k = number of the reference values.
Bias was calculated between the Criterion measurements and the mean dbh measurement value as follows:

where:
n = number of observed measurements,
ymethod,i = observed measurement,
yref,i = the reference value.
4 Results
4.1 Bland Altman plots
The location of the bias line (mean difference) was smallest for Scots Pine dbh measurements and greatest for birch and other species dbh measurements (Fig. 3).
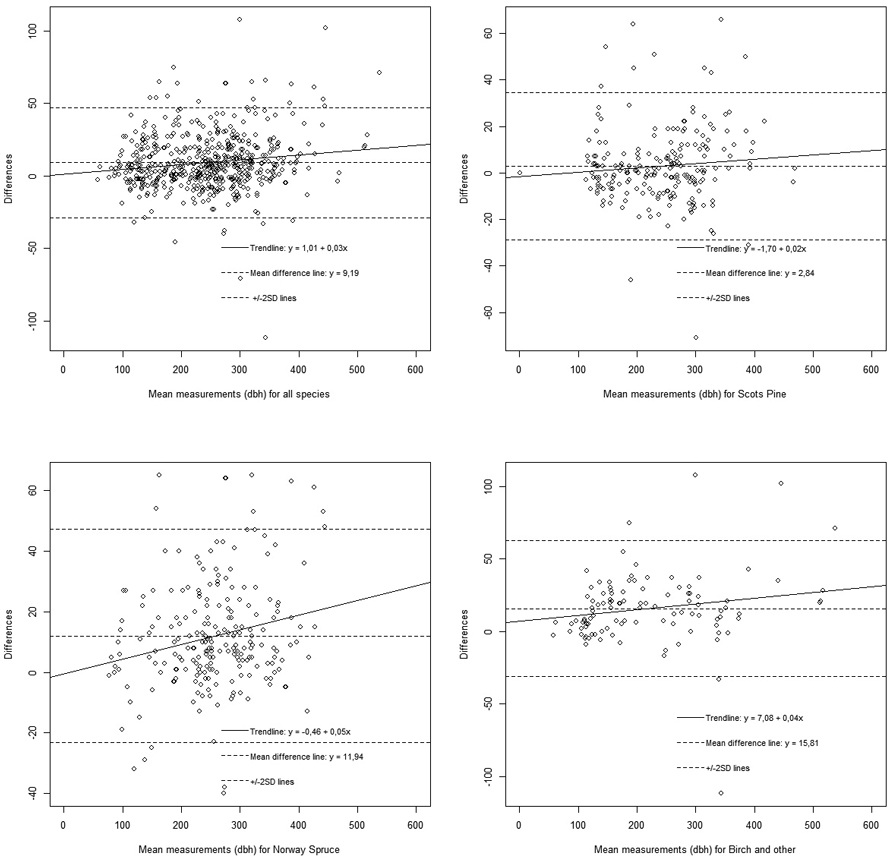
Fig. 3. Bland-Altman plots for diameter at breast height (dbh) to visualise the standard deviation of the differences. Differences between measurement instruments are compared to the mean value of all measurements and are visualised for the different tree species. View larger in new window/tab.
In all cases, the mean difference line was greater than the zero line, which indicates that the Criterion instrument underestimated both dbh and d6 observations when compared with the Sonar or Calliper observations (Fig. 3, Fig. 4). The trendline describes the relationship of the variances between the different measurement methods (Bland and Altman 1995) and indicated negligible differences in variances between the measurement methods, except for dbh for Norway spruce and d6 for birch (Fig. 4).
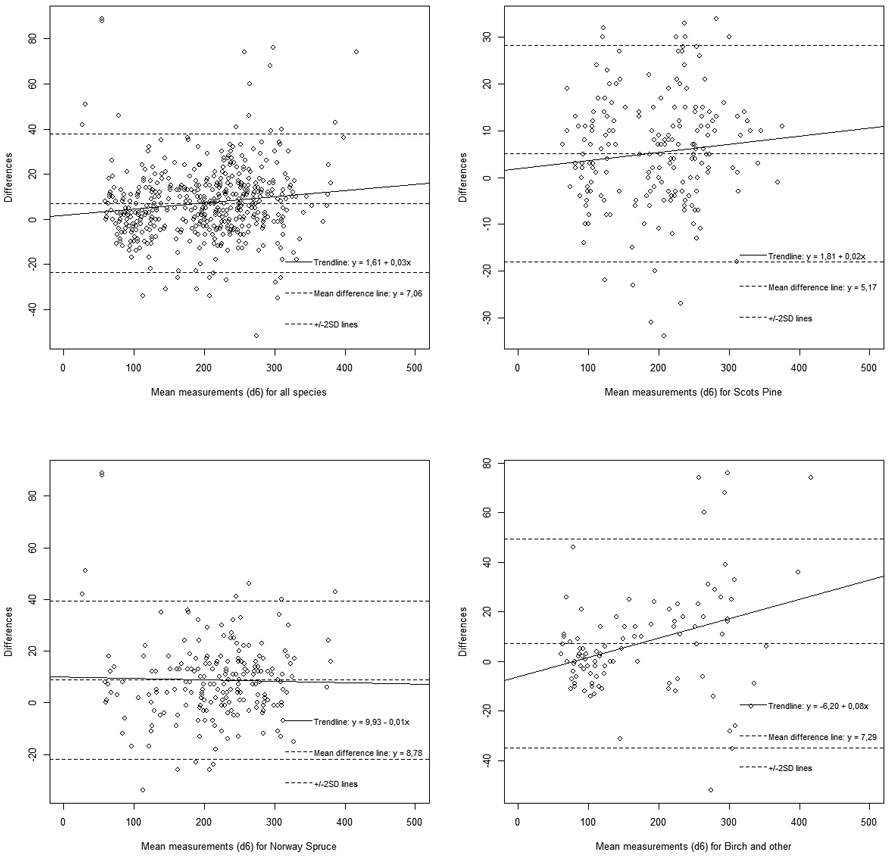
Fig. 4. Bland-Altman plots for upper stem diameter (d6) to visualise the standard deviation of the differences. Differences between measurement instruments are compared to the mean value of all measurements and are visualised for the different tree species. View larger in new window/tab.
4.2 Measurement instrument precision
Our results indicated that the best performance of Criterion was achieved in d6 measurements for Scots Pine, where the upper bound standard deviation was 1.14 cm (Table 2). However, when Criterion standard deviations were compared to the reference standard deviation value of Calliper, the performance in all variables, as well as for all tree species, was worse than achieved in earlier research (Päivinen et al. 1992). The standard deviation for Criterion in the d6 measurements for all species was 1.54 cm, while the Calliper standard deviation for d6 measurements (based on earlier studies) for all species was 0.7 cm (Päivinen et al.1992).
| Table 2. Standard deviation for diameter at breast height (dbh) and upper stem diameter (d6) for Criterion with reference to earlier research with a steel calliper. Number of paired observations is n, maximum standard deviation for Criterion is Supper, referenced standard deviation for Calliper is Sref and Criterion standard deviation is SCRI. Measurement unit is shown in millimetres. | ||||||
| Species | variable | n | n (outliers) | Supper | Sref | SCRI |
| All | dbh | 553 | 3 | 19.96 | 6.90 | 18.73 |
| Scots pine | dbh | 215 | 0 | 16.40 | 6.90 | 14.87 |
| Norway spruce | dbh | 231 | 0 | 21.50 | 6.90 | 20.36 |
| Birch and other | dbh | 107 | 3 | 22.82 | 6.90 | 21.75 |
| All | d6 | 519 | 4 | 16.88 | 7.00 | 15.36 |
| Scots pine | d6 | 205 | 0 | 11.39 | 6.00 | 9.68 |
| Norway spruce | d6 | 214 | 0 | 16.51 | 7.00 | 14.95 |
| Birch and other | d6 | 100 | 4 | 20.05 | 7.00 | 18.79 |
Furthermore, measurement standard deviations were compared using the mean measurement value as the reference value (Table 3). This was calculated as the mean value reported by the observers for the same variable. In this comparison, Criterion results were like previous results (Table 2): Standard deviations were smaller for the d6 measurements than for the dbh measurements.
| Table 3. Standard deviation and bias for Criterion with reference to the mean measurement value. Diameter at breast height is dbh, upper stem diameter d6, number of paired observations is n, standard deviation is SCRI and measurement unit is shown in millimetres. | ||||||
| Species | variable | n | SCRI | SCRI (%) | bias | bias (%) |
| All | dbh | 556 | 12.21 | 4.99 | –3.31 | –1.35 |
| Scots pine | dbh | 215 | 10.67 | 4.40 | –0.96 | –0.40 |
| Norway spruce | dbh | 231 | 12.29 | 4.76 | –4.11 | –1.59 |
| Birch and other | dbh | 110 | 14.64 | 6.62 | –6.20 | –2.81 |
| All | d6 | 519 | 8.88 | 4.47 | –2.44 | –1.23 |
| Scots pine | d6 | 205 | 7.73 | 4.01 | –1.73 | –0.90 |
| Norway spruce | d6 | 214 | 9.45 | 4.33 | –3.27 | –1.50 |
| Birch and other | d6 | 100 | 9.78 | 5.79 | –2.12 | –1.25 |
In this study, Criterion systematically underestimated dbh measurements. The greatest bias (–6.20 mm) was recorded in the dbh measurements for the birch group. For d6 observations, the bias for all species was surprisingly low (–2.44 mm) when individual measurements were compared to the mean measurement value (Table 3).
Boxplot diagrams were produced to analyse the differences between observer-specific measurements and datasets. Based on the boxplot diagrams, the data distribution provided indications of symmetry, and no notable differences within or between observer measurements were evident (Fig. 5, Fig. 6).
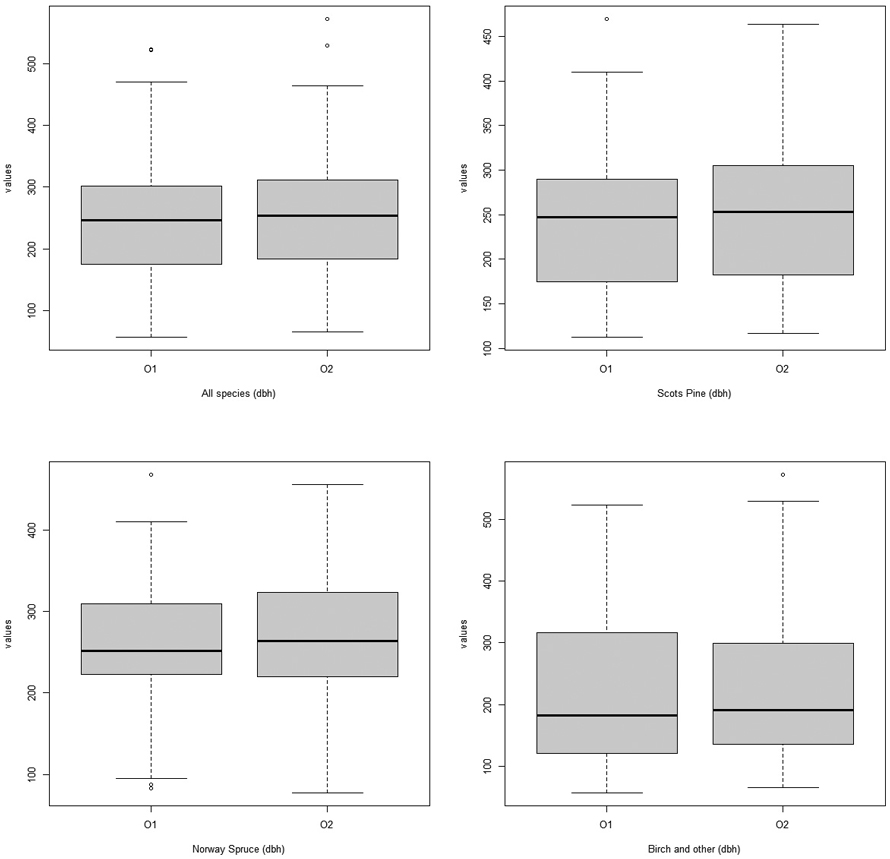
Fig. 5. Boxplots visualizing the data distribution of diameter at breast height (dbh) measurements and for different tree species. O1 = Observer 1 and O2 = Observer 2. View larger in new window/tab.
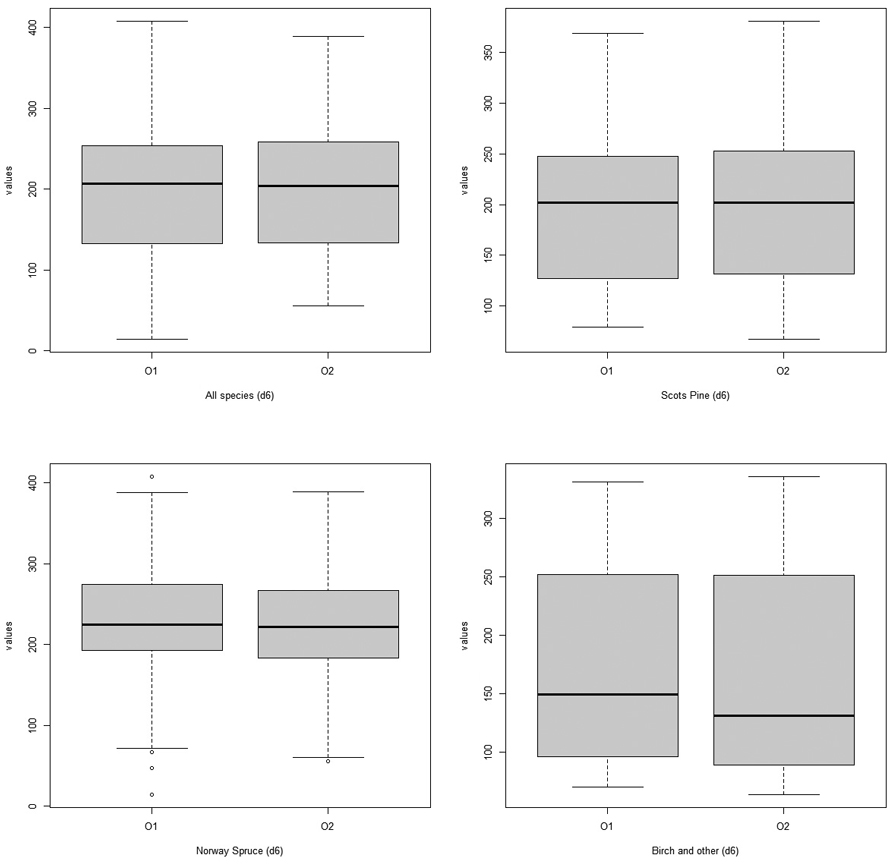
Fig. 6. Boxplots visualising the data distribution for the upper stem diameter (d6) measurements and for different species. O1 = Observer 1 and O2 = Observer 2. View larger in new window/tab.
5 Discussion
Sample plot measurements play a significant role and are key elements in the Finnish NFI. However, the measurement of forest parameters and sample tree variables is time consuming, and so more efficient measurement methods need to be studied. Moreover, the most efficient measurement methods must also exhibit accuracy and reliability.
This study reviewed and tested several methods to measure d6, and statistically analysed the results. The use of Calliper and a 5-meter rod was considered complicated and an unreliable method, and so d6 measurements were removed from NFI sample plot field data a few years ago. Moreover, the Calliper and 5-meter rod are a challenge to manually transport, assemble, and disassemble in the field.
Replacing the d6 measurements with model predictions may cause more errors in the volume estimation (Maltamo and Laukkanen 2001). In particular, the prediction errors associated with h and d6 in large area forest inventories, such as NFI, can have a larger effect on volume prediction than the measurement errors (Kangas 1996). In the 2-parameter and 3-parameter models described by Laasasenaho (1982), the standard error associated with volume was reduced from 7.10, 7.47 and 8.23 to 3.5, 3.38 and 4.96 for pine, spruce, and birch, respectively, when d6 was utilised as an input parameter in the model (Laasasenaho 1982). Under this assumption, the d6 measurements are considered error free.
Furthermore, it has been observed that when field data is utilised as the reference data for TLS, the accuracy of the point cloud data-based volume estimates is improved (Pitkänen et al. 2021). However, it should also be noted that the measurement errors caused by dbh, d6 or h measurements are likely to increase the sample tree volume estimate standard errors by a few percentage points (Päivinen et al. 1992). Due to accuracy and precision requirements, as well as ease of measurement, a more compact and safer instrument, such as Criterion, the laser-based dendrometer, is required for d6 measurements.
The data for this study was gathered based on a slightly amended approach to the 12th NFI fieldwork instructions. The main change was to extend the sample plot radius from 9 meters to a maximum of 20 meters, which also multiplied the amount of the tally trees, as well as sample tree measurements. Furthermore, the dbh and d6 measurements were duplicated by two observers.
The selection of suitable methods of statistical analysis was a challenge due to the reference data itself. In some cases, the reference values are assumed to be the true values, even if measurement errors are present, which indicates that the errors are simply not acknowledged (c.f. Altman and Bland 1983). The reference data problem has been traditionally solved by either ignoring the problem or by utilising the data from felled trees, which influences the amount of field data to be collected. The data analysis methods used in this study could be considered applicable for a case where errors are acknowledged as present in the reference values.
More accurate and reliable estimations regarding the performance of Criterion could have been obtained in cases where it was possible to measure the reference data without errors. However, the applied methods in our statistical analysis did take into consideration that the reference data was not error free either, and therefore the results obtained in this study provide a clear idea of Criterion performance in dbh and d6 measurements, especially when the same results were achieved with different statistical analysis methods and data combinations.
Our analysis indicated that both dbh measurements with Sonar and measurements with Criterion were subject to similar systematic differences. In the Bland-Altman plots, the difference between the measurement methods was defined as a function of their mean. In cases where the differences between the two measurement methods are normally distributed, 95% of the observations should be found between the ±2 Standard Deviation (SD) lines. This was noted in all Bland-Altman plots in our study. The mean difference value was visible in all plots and was above the zero line, which indicates some systematic bias in the Criterion measurements. Differences in variances were small, apart from d6 measurements in birch and dbh measurements in spruce. More precisely, this indicates that Criterion instrument underestimated measurements when compared to Calliper or Sonar. A similar trend was also observed when Criterion measurements were compared with the mean measurement value (Table 3).
Measurement instrument precision and accuracy were analysed by calculating the standard deviation of measurement errors, as well as the bias values. Firstly, measurement precision and accuracy were analysed based on the earlier research results obtained by Päivinen et al. (1992) and Hyppönen et al. (1978). In the second phase, measurement precision and accuracy were analysed with reference to the mean value of the repeated measurements.
Criterion performance regarding dbh measurements was poor with reference to previous research results (c.f Hyppönen et al. 1978; Päivinen et al. 1992). Only in the d6 measurements for Scots Pine, Criterion performed similar to the reference instrument. The Criterion standard deviation was 9.68 mm, when the reference instrument standard error (based on earlier research) was 6 mm (Table 2). However, the reference study was only carried out for Scots pine and the variances associated with birch and spruce are likely to be somewhat greater than those for pine. If this is true, this study may have underestimated the accuracy of Criterion for spruce and birch.
When the mean measurement value was utilised as a reference value, Criterion performed similar in all the measurements and the standard deviation values varied between 7.73 mm and 14.64 mm (Table 3). The greatest standard deviation value, in comparison to the mean measurement value, was recorded for dbh observations for birch and the other species group.
Our results can also be compared with the results reported by Pitkänen et al. (2018), where the same Lapinjärvi field data was utilised as reference data for the TLS measurements. In the latter, the dbh specific root mean square error (RMSE) value was between 7.34 mm and 9.76 mm (depending on the applied fitting method) and TLS-produced RMSE values in the d6 measurements were between 8.44 mm and 13.09 mm. These results are in line with our findings where Criterion measurements were compared with the mean measurement value (see Table 3).
As presented in the boxplot diagrams (Fig. 5, Fig. 6), the data was normally distributed and had similar variance for both observers. This confirms that both observers made similar observations for the same set of field data.
The Criterion instrument could have performed better with the d6 measurements, provided the distance to tree stem measurements were error free. If the distance, measured from the sample plot centre to the tree stem, was not completely error free, it could have impacted on the diameter measurements as well.
6 Conclusions
The purpose of this study was to determine whether a new d6 measurement instrument could improve the tree volume estimation accuracy in the NFI. Accuracy and precision of the dbh and d6 forest parameters were analysed from multiple approaches and with several statistical methods.
The most interesting finding in this study was that the Criterion instrument produced systematic underestimates and biased measurements in both the Bland-Altman plots and in the mean measurement value analysis. Therefore, based on the findings in this study, the Criterion instrument is not a suitable method for d6 measurements in the future.
Some potential improvements regarding this study were noted during the statistical analysis. For example, regarding the Criterion measurement accuracy and precision analysis, other elements also had an impact on the measurement results and caused some uncertainties. For instance, the Criterion measurement had to be taken from a certain distance to the tree stem. This distance was measured with a Vertex transponder, prior to taking the Criterion measurement. While the Vertex distance measuring method is deemed suitable for height measurements, it is possible that diameter measurements would require better accuracy for the distance to tree stem measurements. This suggests that the Criterion instrument could be further improved so that it automatically measures the distance to the tree stem and in this way could reduce the measurement uncertainties.
More research is needed to understand all the characteristics pertinent to d6 measurements and the uncertainties associated with different measurement instruments. A deeper analysis could be carried out, for instance, to identify the reason as to why Criterion performed better in the d6 measurements than in the dbh measurements. Currently, technological development is rapid and when modern technologies need to be tested and studied, reliable reference data is a crucial element in the process. In this study, the reliability of the Sonar device was not known, but this could be solved in future, for instance, by establishing a reference databank for researchers investigating associated topics or measurement devices.
Data availability statement
The data of this article will be shared on reasonable request to the corresponding author.
Authors’ contribution
V.S. participated to the data acquisition, carried out all numerical analyses and drafted the manuscript. A.K. and M.H. participated to the numerical analysis, interpretation of data and results and revising the manuscript. All authors participated to defining research question and design of the work and approved the final version to be published.
Acknowledgements
The authors would like to thank Finland’s Ministry of Agriculture and Forestry key project “Wood on the move and new products from forests” for supporting data collections in the Lapinjärvi research forests. The authors also thank Professor Jari Vauhkonen for his comments that helped to improve the manuscript.
Conflict of interest statement
The authors declare that they have no conflict of interest.
Funding
The study was funded by Finland’s Ministry of Agriculture and Forestry and by The Finnish Society of Forest Science and by Helvi and Viljo Holopainen’s research grant and the Academy of Finland (grant number 324193).
References
Altman DG, Bland JM (1983) Measurement in medicine: the analysis of method comparison studies. J Roy Stat Soc D-Sta 32: 307–317. https://doi.org/10.2307/2987937.
Angleton GM, Bonham CD (1995) Least squares regression vs. geometric mean regression for ecotoxicology studies. Appl Math Comput 72: 21–32. https://doi.org/10.1016/0096-3003(94)00161-V.
Bland JM, Altman DG (1995) Comparing methods of measurement: why plotting difference against standard method is misleading. Lancet 346: 1085–1087. https://doi.org/10.1016/S0140-6736%2895%2991748-9.
Chirici G, Winter S, McRoberts RE (2011) Summary and conclusions. In: Chirici G, Winter S, McRoberts R (eds) National forest inventories: contributions to forest biodiversity assessments. Managing Forest Ecosystems 20. Springer, Dordrecht. https://doi.org/10.1007/978-94-007-0482-4_6.
Haakana M, Katila M, Peräsaari J, Tomppo E (2008) Multi-Source National Forest Inventory: methods and applications. Managing Forest Ecosystems 18. Springer, New York. https://doi.org/10.1007/978-1-4020-8713-4.
Haapanen R (2014) Valtakunnan metsien inventoinnit: Suomen metsiä mittaamassa. [National Forest Inventories: in the act of measuring Finnish forests]. Metsäkustannus, pp 15–30.
Hyppönen M, Roiko-Jokela P (1978) Koepuiden mittauksen tarkkuus ja tehokkuus. [On the accuracy and effectivity of measuring sample trees]. Folia For 356. http://urn.fi/URN:ISBN:951-40-0344-6.
Ji L, Gallo K (2006) An agreement coefficient for image comparison. Photogramm Eng Rem S 72: 823–833. https://doi.org/10.14358/PERS.72.7.823.
Kangas A (1996) On the bias and variance in tree volume predictions due to model and measurement errors. Scand J For Res 11: 281–290. https://doi.org/10.1080/02827589609382937.
Kangas A, Henttonen HM, Pitkänen TP, Sarkkola S, Heikkinen J (2020) Re-calibrating stem volume models – is there change in the tree trunk form from the 1970s to the 2010s in Finland? Silva Fenn 54, article id 10269. https://doi.org/10.14214/sf.10269.
Korhonen KT (1992) Calibration of upper diameter models in large scale forest inventory. Silva Fenn 26: 231–239. https://doi.org/10.14214/sf.a15652.
Korhonen K, Eerikäinen K (2001) Tilavuusmallit. [Volume models]. In: Maltamo M, Laukkanen S (eds) Metsää kuvaavat mallit. [Forest modeling]. Silva Carelica 36. University of Joensuu. Faculty of Forestry, pp 84–91.
Laasasenaho J (1982) Taper curve and volume functions for pine, spruce and birch. Commun Inst For Fenn 108. http://urn.fi/URN:ISBN:951-40-0589-9.
Laser Technology Inc (2006) Criterion RD 1000, the 1st electronic BAF-scope / dendrometer, User’s manual 3rd edition.
Luonnonvarakeskus (2015) Valtakunnan Metsien 12. Inventointi (VMI12). Maastotyön ohjeet. [The field measurement guide]. Koko Suomi. Luonnonvarakeskus, Vantaa.
Metsäntutkimuslaitos (2009) Valtakunnan Metsien 11. Inventointi (VMI11). Maastotyön ohjeet. [The field measurement guide] Koko Suomi. Metsäntutkimuslaitos, Vantaa. http://urn.fi/URN:NBN:fi-fe201603038534.
Pitkänen TP, Raumonen P, Kangas A (2019) Measuring stem diameters with TLS in boreal forests by complementary fitting procedure. ISPRS J Photogramm Remote Sens 147: 294–306. https://doi.org/10.1016/j.isprsjprs.2018.11.027.
Pitkänen TP, Raumonen P, Liang X, Lehtomäki M, Kangas A (2021) Improving TLS-based stem volume estimates by field measurements. Comput Electron Agric 180, article id 105882. https://doi.org/10.1016/j.compag.2020.105882.
Päivinen R, Nousiainen M, Korhonen KT (1992) Puutunnusten mittaamisen luotettavuus. [Accuracy of certain tree measurements]. Folia For 787. http://urn.fi/URN:ISBN:951-40-1197-X.
RStudio Team (2020) RStudio: integrated development environment for R.
Stenman V (2019) Upper stem diameter and volume prediction strategies in National Forest Inventory (NFI). University of Helsinki. https://ethesis.helsinki.fi/repository/handle/123456789/23155.
Tomppo E, Heikkinen J, Henttonen HM, Ihalainen A, Katila M, Mäkelä H, Tuomainen T, Vainikainen N (2011) Designing and conducting a forest inventory – case: 9th National Forest Inventory of Finland. For Ecol Manag 22, article id 278. https://doi.org/10.1007/978-94-007-1652-0.
Tomppo E, Katila M, Mäkisara K, Peräsaari J (2014) The Multi-source National Forest Inventory of Finland – methods and results 2011. Working Papers of the Finnish Forest Research Institute 319. http://urn.fi/URN:ISBN:978-951-40-2516-7.
Total of 23 references.
