Annastina Saari  ,
Marjo Palviainen,
Mikko T. Niemi,
Annamari Laurén
,
Marjo Palviainen,
Mikko T. Niemi,
Annamari Laurén
Impacts of reduced ditch network maintenance and ditch shallowing on ecosystem services of peatland forests in Finland
Saari A., Palviainen M., Niemi M. T., Laurén A. (2025). Impacts of reduced ditch network maintenance and ditch shallowing on ecosystem services of peatland forests in Finland. Silva Fennica vol. 59 no. 3 article id 25032. https://doi.org/10.14214/sf.25032
Highlights
- Effects of ditch shallowing on ecosystem services depend on latitude, site type and tree species
- Ditch shallowing increased ecosystem carbon sinks
- If the initial ditch depth was 0.6 m and deeper, stand volume growth mainly increased in Southern Finland
- Ditch shallowing had the largest benefits for all studied ecosystem services when the initial ditch depth was 0.9 m.
Abstract
According to the 13th Finnish National Forest Inventory, 0.8 Mha of drained peatland forests require ditch network maintenance (DNM). The annual DNM area has decreased radically during the past ten years, leading to gradual shallowing of ditches and rise of water table (WT) in peatland forests. To study the impacts of ditch shallowing on ecosystem services, we applied Peatland Simulator SUSI for 20 average peatland forests representing four different geographical regions in Finland. The simulation period was 20 years and the initial ditch depths were set to 0.3 m, 0.6 m and 0.9 m. The study included drained peatland forest site types from nutrient rich to nutrient poor, with main species as Scots pine (Pinus sylvestris L.) or Norway spruce (Picea abies (L.) Karst.). We studied how ditch shallowing affected stand volume growth, ecosystem and soil carbon (C) balances, and nitrogen (N) and phosphorus (P) export loads to water courses in different peatland sites. The results showed that due to ditch shallowing, the ecosystem C sinks increased in most sites when the initial ditch depth was 0.6 m or 0.9 m. Ditch shallowing generally increased stand volume growth in Southern Finland when the initial ditch depth was 0.6 m or 0.9 m. Regardless of the location and initial ditch depth, ditch shallowing decreased N and P exports, and soil C emissions. The study calls for new water management guidelines for drained forested peatlands in Finland.
Keywords
stand growth;
drainage;
carbon balance;
water table;
ecosystem modelling;
nutrient export load
-
Saari,
Department of Forest Sciences, P.O. Box 27, FI-00014 University of Helsinki, Finland
 https://orcid.org/0009-0001-5931-4210
E-mail
annastina.saari@helsinki.fi
https://orcid.org/0009-0001-5931-4210
E-mail
annastina.saari@helsinki.fi
-
Palviainen,
Department of Forest Sciences, P.O. Box 27, FI-00014 University of Helsinki, Finland
https://orcid.org/0000-0001-9963-4748
E-mail
marjo.palviainen@helsinki.fi
-
Niemi,
Department of Forest Sciences, P.O. Box 27, FI-00014 University of Helsinki, Finland
https://orcid.org/0000-0003-0461-3667
E-mail
mikko.t.niemi@helsinki.fi
-
Laurén,
Department of Forest Sciences, P.O. Box 27, FI-00014 University of Helsinki, Finland; Faculty of Science and Forestry, University of Eastern Finland, P.O. Box 111, FI-80101 Joensuu, Finland
https://orcid.org/0000-0002-6835-9568
E-mail
annamari.lauren@helsinki.fi
Received 27 June 2025 Accepted 18 November 2025 Published 4 December 2025
Views 31036
Available at https://doi.org/10.14214/sf.25032 | Download PDF

Supplementary Files
1 Introduction
Peatlands are important environments in food and wood production worldwide, they store large amounts of carbon (C) (Millennium Ecosystem Assessment 2005), and affect the quality of surface waters (Kimmel and Mander 2010). In forestry, drainage has been considered a prerequisite for wood production in peatlands (Päivänen and Hånell 2012). Drainage lowers water table (WT) (Braekke 1983) and consequently increases peat aeration (Holden et al. 2006), organic matter decomposition (Laine and Vanha-Majamaa 1992; Laine et al. 1995), nutrient release (Verry 1997; Nieminen et al. 2017) and tree growth (Seppälä 1972; Braekke 1983; Simard et al. 2007). Gradually, the stand structure and tree diameter distribution, ground vegetation species composition (Laine et al. 1995; Laiho et al. 2003) and litter quality and quantity change (Finér and Laine 1998). Drainage onsets a succession towards transformed drained peatlands, where surface peat is more decomposed (Minkkinen and Laine 1998b), and a mor humus (raw humus) layer covers the original peat layer (Hökkä et al. 2025). Simultaneously drainage causes adverse environmental effects by increasing CO2 emissions from peat (Minkkinen and Laine 1998a; Ojanen et al. 2010), and nutrient and suspended solids export to water courses (Joensuu et al. 1999; Nieminen et al. 2005; Nieminen et al. 2017).
Since the beginning of the 1900s, drainage has been an essential part of Finnish forestry (Lukkala 1927; Heikurainen and Kuusela 1962; Sevola 1998). In Finland, 8.8 Mha of the land area is currently covered by peatlands, of which 4.7 Mha are drained for forestry (Korhonen et al. 2021). After the initial drainage, ditch depth tends to gradually decrease due to ditch bank erosion (Stenberg et al. 2015), sedimentation and vegetation ingrowth (Heikurainen 1957; Timonen 1983; Hökkä et al. 2020). According to Hökkä et al. (2020), ditches become approximately 20 cm shallower in 20 years. In order to maintain good drainage conditions, ditch network maintenance (DNM), i.e., ditch cleaning, has been considered necessary in 20–40 years intervals (Sikström and Hökkä 2016; Vanhatalo et al. 2019), depending on the forest site type and geographical location (Ahti and Päivänen 1997; Sikström and Hökkä 2016).
DNM has increased stand growth by 10–20 m3 ha–1 in 20 years (Ahtikoski et al. 2008), but it has also increased export load of nutrients and suspended solids (Joensuu et al. 1999) and it has been considered as the most harmful forest management practice from the perspective of water quality (Finér et al. 2010). DNM lowers WT by 3–10 cm (Ahti and Päivänen 1997), which increases soil CO2 emissions by 240–1200 kg CO2 ha–1 yr–1 (Ojanen and Minkkinen 2019). Ditch cleaning also induces methane emissions from ditches by removing the methane oxidating mosses from the ditch bottoms (Rissanen et al. 2023). On the other hand, DNM lowers WT along the cross section strip between the ditches and consequently reduces peat methane emissions (Ojanen et al. 2010). The necessity of DNM has been questioned also from the point of view of forest growth. Sarkkola et al. (2012, 2013) suggested that in mature stands, the high evapotranspiration rate is enough to maintain sufficiently low WTs, and consequently, DNM is not needed.
The areas of DNM have drastically decreased in Finland, so that the annual DNM area was approximately 82 000 ha in 2001, whereas in 2023 the area was only 8000 ha (Natural Resources Institute Finland Statistics Database 2024). Furthermore, the government subsidies for DNM were removed at the beginning of 2024 which likely will further decrease the area of DNM. Together the reduced DNM workload and the continuous ditch shallowing decrease the average ditch depth in Finland and result in elevation of WT throughout large areas. This further reflects on wood production, CO2 emissions and nutrient exports to water courses. Effects of shallowing are likely to depend on forest stand structure, site fertility, peat type and degree of decomposition, ditch depth and weather conditions. Understanding the impacts of ditch shallowing is crucial, because it will affect wood production, water quality and the greenhouse gas emissions of the whole land use sector and hence, national C neutrality targets.
In this study, we simulated the effects of ditch shallowing on stand volume growth, soil and ecosystem C balances, WT, and nitrogen (N) and phosphorus (P) exports to watercourses in 20 average peatland forest stands in Southern and Central Finland, Northern Ostrobothnia–Kainuu and in Lapland. We studied the effects in different site types and initial ditch depths (0.3 m, 0.6 m and 0.9 m) during a 20-year simulation period. We hypothesized that ditch shallowing will have different impacts depending on the geographical location and site fertility due to different weather conditions and evapotranspiration.
2 Materials and methods
2.1 Research data
We divided Finland into four regions (Fig. 1) based on effective temperature sum. For each region, we acquired the daily temperature, precipitation, humidity, and solar radiation from the Finnish Meteorological Institute (FMI 2024) database for the period of 2004–2023. The daily water vapor pressure was derived from the measured mean temperature and humidity using the equations of Buck (1981). The measurements of global radiation were available only from 6 observation stations in the continental Finland (Helsinki-Vantaa airport, Jokioinen, Jyväskylä airport, Sotkamo, Sodankylä, and Utsjoki), so we interpolated daily global radiation to the study regions based on the latitudes of these observation stations (Table 1). The weather data included two abnormally dry and warm summers in 2006 and in 2018.
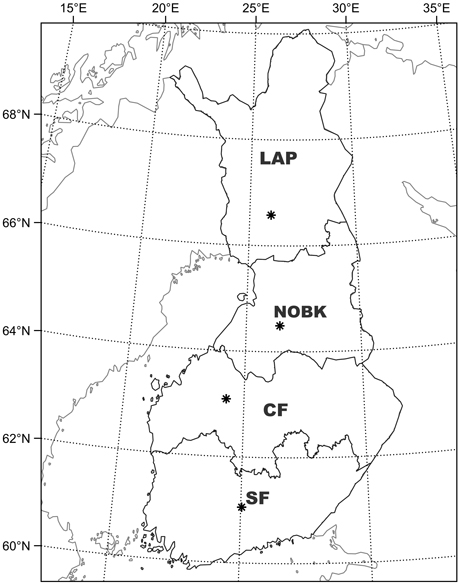
Fig. 1. Stand characteristics and weather data in the simulations represented conditions in Southern Finland (SF), Central Finland (CF), Northern Ostrobothnia–Kainuu (NOBK) and Lapland (LAP).
| Table 1. Locations and coordinates of the weather stations in Southern Finland (SF), Central Finland (CF), Northern Ostrobothnia–Kainuu (NOBK) and Lapland (LAP) and mean annual temperature sum and precipitation in the studied regions, and the precipitation in exceptionally dry years of 2006 and 2018. | ||||||
| Main region | Weather data location | Longitude | Latitude | Mean annual temperature sum (dd) | Mean annual precipitation (mm) | Precipitation 2006 / 2018 (mm) |
| SF | Hämeenlinna | 25.04°E | 61.05°N | 1412 | 635 | 587 / 434 |
| CF | Alajärvi | 24.26°E | 63.09°N | 1214 | 640 | 508 / 427 |
| NOBK | Vaala | 26.47°E | 64.49°N | 1156 | 649 | 613 / 471 |
| LAP | Rovaniemi | 26.01°E | 66.58°N | 1035 | 552 | 408 / 472 |
Simulations were carried out for site types (Vasander and Laine 2008) that are used for forestry (Table 2). In the simulations, we assumed that peat hydrological characteristics followed properties of Carex and woody peat (Päivänen 1973) for all site types, except for the nutrient poor dwarf shrub, which had Sphagnum peat properties. Dominant tree species were also considered based on site type, either as Scots pine (Pinus sylvestris L.) or Norway spruce (Picea abies (L.) Karst.).
| Table 2. Drained peatland site types, fertility class descriptions, fertility classes (Vasander and Laine 2008), peat types and main tree species. Fertility class describes site fertility in ascending order where 2 is the most nutrient rich and 5 is the most nutrient poor. | ||||
| Drained peatland site type | Fertility class description | Fertility class | Peat type | Main tree species |
| Herb-rich | Fertile | 2 | Carex | Norway spruce |
| Bilberry (Vaccinium myrtillus L.) | Medium-fertile | 3 | Carex | Norway spruce or Scots pine |
| Lingonberry (Vaccinium vitis-idaea L.) | Medium-poor | 4 | Carex | Scots pine |
| Dwarf shrub | Poor | 5 | Sphagnum | Scots pine |
For this study, we calculated typical forest attributes of different peatland site types using the computing service of the 12th national forest inventory of Finland (NFI12) (Natural Resources Institute Finland 2023), and field plots measured by Finnish Forest Centre (FFC 2023). NFI12 data was used to calculate average stand volume of the site fertility classes 2–5 on different study regions. Next, we filtered the field plots acquired from FFC File Service (altogether 4781 plots) by searching the plots of thinning-stage and mature forests, located on drained peatland, with stem volume within 10 m3 ha–1 of the NFI-derived site fertility class and region-specific stand volume. From the FFC plots we derived site fertility class and region-specific average attributes for stem number (Ns), basal area (BA), basal area-weighted mean diameter (Dg), basal area-weighted mean height (Hg), dominant height (Hdom) and stand volume (Vol) (Table 3).
| Table 3. Forest input data for the simulations. The fertility class according to Table 2 are: 2 is fertile, 3 is medium-fertile, 4 is medium-poor and 5 is poor. Main tree species are: 1 is Scots pine (Pinus sylvestris L.) and 2 is Norway spruce (Picea abies (L.) Karst.). Abbreviations for the forest attributes are: stem number (Ns), basal area (BA), basal area-weighted mean diameter (Dg), basal area-weighted mean height (Hg), dominant height (Hdom) and stand volume (Vol). Regions codes are: SF is Southern Finland, CF is Central Finland, NOBK is Northern Ostrobothnia–Kainuu and LAP is Lapland. | ||||||||
| Region | Fertility class | Main species | Ns (ha–1) | BA (m2 ha–1) | Dg (cm) | Hg (m) | Hdom (m) | Vol (m3 ha–1) |
| SF | 2 | 2 | 1070 | 22.6 | 20.3 | 16.4 | 19.2 | 178 |
| SF | 3 | 2 | 850 | 20.2 | 21.3 | 17.4 | 19.7 | 169 |
| SF | 3 | 1 | 930 | 19.8 | 22 | 17.9 | 20.2 | 168 |
| SF | 4 | 1 | 920 | 16.8 | 20.2 | 16.6 | 18.6 | 134 |
| SF | 5 | 1 | 1160 | 15.1 | 15 | 12.3 | 14.4 | 94 |
| CF | 2 | 2 | 900 | 21.1 | 21.8 | 15.3 | 17.9 | 149 |
| CF | 3 | 2 | 1110 | 19.2 | 18.9 | 15.6 | 18.4 | 144 |
| CF | 3 | 1 | 1390 | 20.5 | 17.3 | 14.7 | 17.4 | 147 |
| CF | 4 | 1 | 870 | 16.1 | 18.9 | 15.6 | 17.7 | 122 |
| CF | 5 | 1 | 1020 | 13.6 | 15.7 | 12.2 | 14.3 | 84 |
| NOBK | 2 | 2 | 1420 | 20 | 18.1 | 12.7 | 15.4 | 120 |
| NOBK | 3 | 2 | 1330 | 19.1 | 17.9 | 14.1 | 17 | 130 |
| NOBK | 3 | 1 | 1300 | 19 | 17.2 | 14.1 | 16.4 | 132 |
| NOBK | 4 | 1 | 1130 | 16 | 16.4 | 13.3 | 15.5 | 106 |
| NOBK | 5 | 1 | 1270 | 12.9 | 13.9 | 10.8 | 12.8 | 71 |
| LAP | 2 | 2 | 1640 | 20.6 | 16.5 | 11.4 | 13.8 | 113 |
| LAP | 3 | 2 | 1820 | 19.3 | 16.2 | 12.7 | 15.6 | 118 |
| LAP | 3 | 1 | 1900 | 20.2 | 14.6 | 11.6 | 14 | 119 |
| LAP | 4 | 1 | 2220 | 16.4 | 12.3 | 9.5 | 12.3 | 81 |
| LAP | 5 | 1 | 2080 | 12.4 | 10.6 | 8.2 | 10.2 | 55 |
2.2 Peatland simulator SUSI
Peatland simulator SUSI (Laurén et al. 2021; Palviainen et al. 2024) computes hydrology, N, P and potassium (K) cycling, decomposition and accumulation of organic matter, soil and biomass C storages and fluxes including horizontal dissolved organic carbon (DOC) export, stand growth and litterfall from trees and ground vegetation. SUSI calculates the processes along a cross section strip extending between two parallel ditches (Laurén et al. 2021). Input data include stand-level forest attributes (tree species, dominant height, stand volume, basal area, and number of stems), site characteristics (site fertility class, peat type, nutrient concentrations and bulk density profile), and daily weather data (air temperature, precipitation, water vapour pressure, and global radiation).
In this study, we used the following SUSI outputs: stand volume growth (m3 ha–1 yr–1), mean growing season (May–October) WT (m), late summer (July–August) WT (m), soil and ecosystem C balance (kg ha–1 yr–1), and N and P exports to ditches (kg ha–1 yr–1).
Calculation of WT uses daily rainfall, temperature, vapour pressure deficit, global radiation and leaf area to solve water interception, interception evaporation, transpiration, throughfall and infiltration to soil (Launiainen et al. 2019; Laurén et al. 2021). Difference between infiltration and evapotranspiration changes the peat water storage and water moves from the peat profile towards the ditches following a quasi 2-dimensional groundwater equation (Laurén et al. 2021). Lower boundary of the model domain is impermeable soil at depth of 2.5 m and ditch depths in both ends of the strip are used as boundary conditions. If WT was deeper than the ditch depth, a no-flow boundary condition was applied, otherwise constant-head boundary conditions in the ditches were applied. Daily WT was aggregated to the growing season and late summer WT.
Soil C balance included litter input from living stand and ground vegetation and from tree mortality; peat and mor storage; and outputs composed of organic matter decomposition from mor (litter, fermentation, and humus layers) and from peat (Palviainen et al. 2024). Outputs also included methane emissions and export of DOC (Palviainen et al. 2024). Decomposition was based on soil pH, litter quality, daily soil temperature and water content. Litter input and the C balance updates were done once a year. Ecosystem C balance included soil C balance and the biomass growth (Mäkelä et al. 2008) in forest stand and ground vegetation (Muukkonen and Mäkipää 2005).
Both stand and ground vegetation take up N and P from the rooting zone following the demand framed by the biomass growth. N and P not used by the stand or ground vegetation, and the N and P released under the rooting zone are flushed to the water course in an annual time step creating the nutrient export. For more detailed information on the SUSI simulator, its background data and model structure, see Laurén et al. (2021).
2.3 Motti simulation
Motti simulator (Hynynen et al. 2002; Salminen et al. 2005) was utilized for generating allometric road maps (see Laurén et al. 2021) for stand growth, mortality and development of stand biomass components. The following forest attributes were extracted from Motti-simulator to SUSI: mean age, stem number (Ns, stems ha–1), basal area (BA, m2 ha–1), mean height (Hg, m), mean diameter (Dg, cm), dominant height (Hdom, m), stem volume (m3 ha–1), sawlog volume (m3 ha–1), pulpwood volume (m3 ha–1), residue wood volume (m3 ha–1), total yield (m3 ha–1), stand mortality (m3 ha–1), and biomass (kg ha–1) of stem wood, residue wood, living branches, dead branches, leaves, stumps, coarse roots (>2 mm) and fine roots. No forest management activities were implemented in the simulations. The Motti simulator ran on 5-year intervals, providing the current stand development stage at the end of each 5-year period. The overall Motti-simulation period used for different sites was 50 years. The Motti simulation output data for each region can be found from Supplementary files S1 (Southern Finland), S2 (Central Finland), S3 (Northern Ostrobothnia–Kainuu) and S4 (Lapland).
2.4 Simulation scenarios and outputs
Because mor layer plays an important role in nutrient cycling of drained forested peatlands, we did a 40-year spinoff -simulation (weather data 1961–2010) to initialise the mass of mor layer for each site type and region. Mass of the mor layer at the beginning of the spin-off simulation was 0.5 kg m–2 and depending on the site type, tree species and location. At the end of the spin-off simulation the mass of the mor layer varied between 4.9–7.2 kg m–2, which corresponds to the observed mor layer mass range (Pitkänen et al. 2012).
We simulated stand volume growth, ecosystem C balance, WT, soil C balance, and N and P exports to water bodies using SUSI. We followed the perspective of soil science, where a positive C balance indicates increasing ecosystem or soil C storage, and therefore a C sink.
The simulation period was 20 years and the weather data covered time between the years 2004 and 2023. We simulated two scenarios, each having three different ditch depths. In both scenarios, the initial ditch depths were set to 0.3 m, 0.6 m and 0.9 m. In the reference scenario, the ditch depth did not change during the simulation. In the shallowing scenario, 0.3 m ditch depth changed to 0.2 m; 0.6 m changed to 0.4 m; and 0.9 m changed to 0.6 m. The shallowing rate followed the empirical data by Hökkä et al. (2020). A distance between the adjacent ditches, hereafter called “strip width”, was set to 40 m for all simulations, representing the typical strip width in Finland. In SUSI, ditches form the boundary conditions, which means that ditch processes, such as flow resistance and rate and the reason behind the shallowing (sedimentation or vegetation ingrowth), are outside the scope of the simulation.
Stand growth, soil C balance, ecosystem C balance and N and P export loads are meaningful to study as cumulative variables, as e.g., stand growth sums up in stand volume, and soil C balance sums up to soil C storage throughout the simulation period. Cumulative values smooth out the variation caused by weather conditions, shows the long-term trends and guides the management planning.
The scenarios were compared using cumulative differences (Eq. 1):
![]()
where Δxi is cumulative change in variable x from year 0to year i, nyrs is the number of simulation years, i is the running year, x is a variable (mean annual stand growth (m3 ha–1), soil C balance (kg ha–1), ecosystem C balance (kg ha–1), N export load (kg ha–1) or P export load (kg ha–1). Subscript shallow refers to the shallowing scenario and ref to the reference scenario.
WT was not meaningful to present as cumulative values. Mean annual values for both scenarios are shown in the Suppl. files S5 and S6.
3 Results
3.1 Reality check
First, we completed a reality check by comparing the SUSI simulation results to experimental data. SUSI was able to predict the relationship between soil CO2 balance and growing season WT; however, SUSI was not able to fully describe the whole range of variation in observations (Fig. 2a). However, it should be noted that the empirical data did not include observations with WT deeper than 80 cm. In fertile and medium-fertile site types in Southern Finland, the stand growth decreased with increasing drainage intensity and stand volume growth ranged between 9–12 m3 ha–1 yr–1 (Fig. 2b). In Lapland, stand growth consistently increased with increasing drainage intensity and stand volume growth ranged between 1–6 m3 ha–1 yr–1.
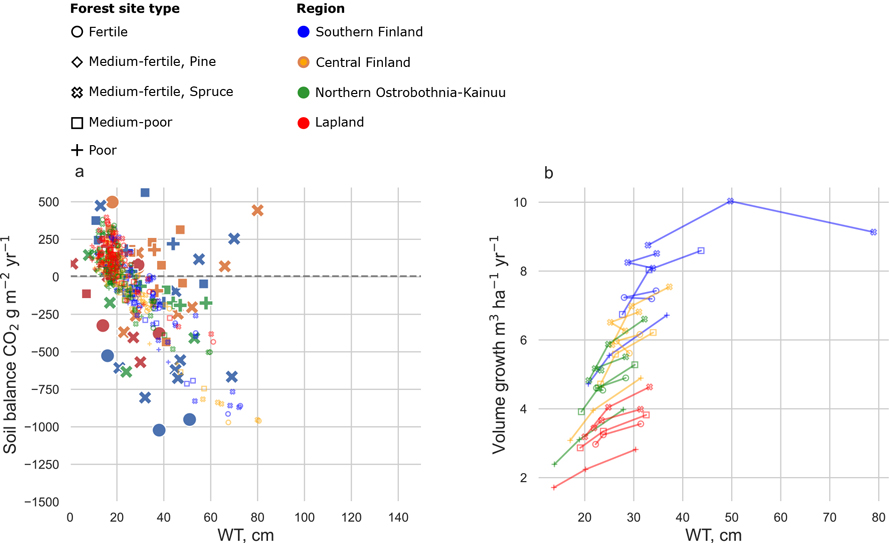
Fig. 2. a) Dependence of annual soil CO2 balance on the growing season water table (WT) in SUSI simulations (small, slightly transparent markers) and in experimental data presented by Ojanen and Minkkinen (2019) (large markers). Positive y-values indicate a C sink and negative C source. b) Dependence of mean stand volume growth (current annual increment) on the mean WT during the growing season. Each site was simulated with 0.3 m, 0.6 m and 0.9 m ditch depths resulting in different growing season WTs. Marker colours indicate geographical location (Fig. 1) and marker style different site fertility classes (Table 3). Mtkg sites include both Scots pine and Norway spruce stands in a and b.
3.2 Effects of ditch shallowing on ecosystem services
The following results show the cumulative difference between the reference and shallowing scenario during the 20-year simulation for stand volume growth, ecosystem C balance, soil C balance, and N and P exports. Respective annual values can be found from Suppl. files S5 and S6. WT shows the annual difference between the two scenarios. For the ecosystem and soil C balances, negative values indicate an increase in C emissions with shallowing and positive values a decrease, respectively.
Ditch shallowing had positive outcomes for most of the studied ecosystem services. In general, sites in Southern Finland benefitted from ditch shallowing more than the Northern locations. When the initial ditch depth was 0.6 m or 0.9 m, the ditch shallowing consistently increased ecosystem C sinks in nearly all sites (Figs. 4b–c). The maximum ecosystem C balance benefit in ditch shallowing was up to 20 000 kg C ha–1 in 20 years in 0.9 m initial ditch depth in the Norway spruce -dominated fertile and medium-fertile sites in Southern Finland (Fig. 4c). When the initial ditch depth was 0.3 m, ditch shallowing increased ecosystem C sinks mainly in Southern Finland (Fig. 4a). In contrast, in Central Finland, Northern Ostrobothnia–Kainuu and Lapland ditch shallowing decreased stand volume growth to such an extent that the ecosystem C sink decreased up to 1000 kg C ha–1 in 20 years in the 0.3 m initial ditch depth (Figs. 3a and 4a). The Scots pine -dominated medium-fertile was the only site type where ditch shallowing increased the ecosystem C sink in all regions and ditch depths (Figs. 4a–c).
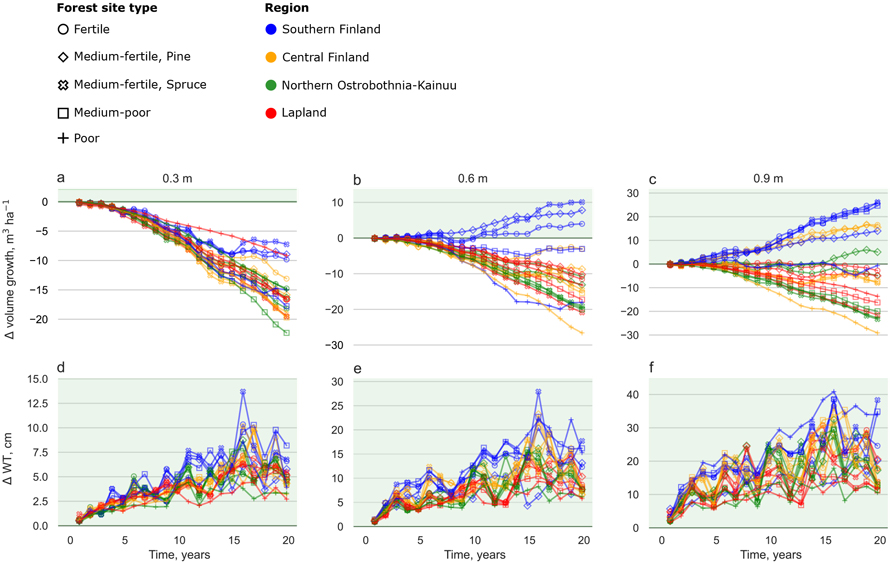
Fig. 3. Cumulative difference between the ditch shallowing and reference scenarios for volume growth (a–c) during a 20-year period and annual difference in water table (WT) (d–f) in different site types and regions. Each site was simulated with 0.3 m (leftmost column), 0.6 m (centre column) and 0.9 m (rightmost column) initial ditch depths. Marker colours indicate geographical location (Fig. 1) and marker style different site fertility classes (Table 3). Note different scales in the y-axis between different ditch depth scenarios. Years 3 and 15 were dry and warm years 2006 and 2018, respectively. View larger in new window/tab.
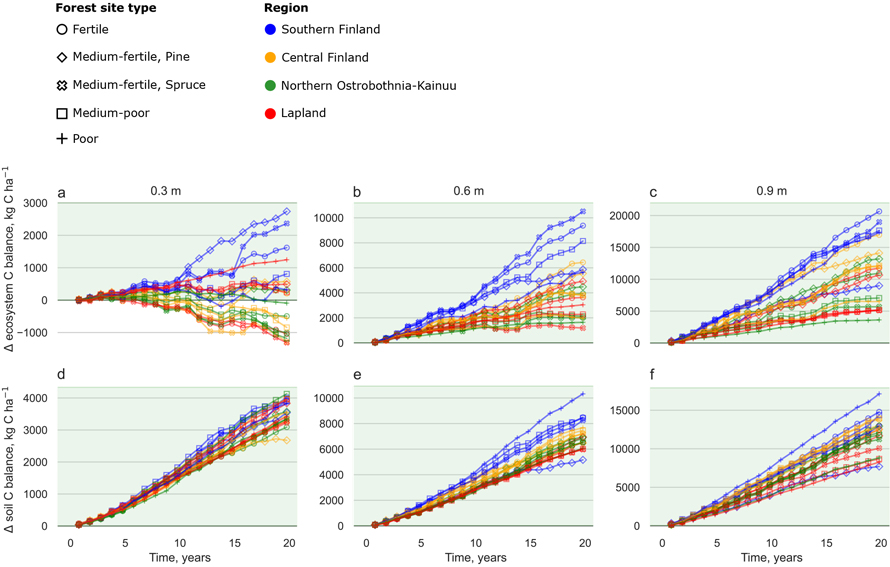
Fig. 4. Cumulative difference between the ditch shallowing and reference scenarios for ecosystem C balance (a–c) and soil C balance (d–f) during a 20-year period in different site types and regions. Each site was simulated with 0.3 m (leftmost column), 0.6 m (centre column) and 0.9 m (rightmost column) initial ditch depths. Marker colours indicate geographical location (Fig. 1) and marker style different site fertility classes (Table 3). Note different scales in the y-axis between different ditch depth scenarios. Years 3 and 15 were dry and warm years 2006 and 2018, respectively. View larger in new window/tab.
Ditch shallowing decreased soil C emissions, and N and P exports in all sites regardless of the initial ditch depth or region. The largest decreases in soil C emissions were attained in the 0.9 m ditch depth in the fertile site in Southern Finland, where soil C emissions reduced up to 15 000 kg C ha–1 during the 20-year simulation period (Fig. 4f). N and P exports reduced up to 60 kg ha–1 and 7 kg ha–1, respectively, in 20 years (Figs. 5c and 5f).
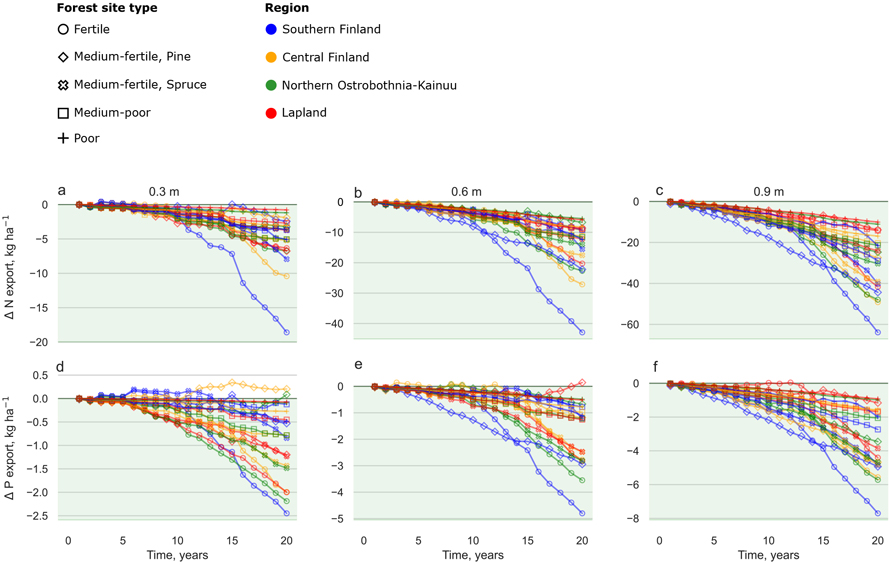
Fig. 5. Cumulative difference between the ditch shallowing and reference scenarios for N exports (a–c) and P exports (d–f) during a 20-year period in different site types and regions. Each site was simulated with 0.3 m (leftmost column), 0.6 m (centre column) and 0.9 m (rightmost column) initial ditch depths. Marker colours indicate geographical location (Fig. 1) and marker style different site fertility classes (Table 3). Note different scales in the y-axis between different ditch depth scenarios. Years 3 and 15 were dry and warm years 2006 and 2018, respectively. View larger in new window/tab.
In general, ditch shallowing decreased stand volume growth compared to the reference scenario (Figs. 3a–c). Volume growth decreased in all regions and site types when the initial ditch depth was 0.3 m. However, ditch shallowing increased stand volume growth in the fertile and medium-fertile sites in Southern Finland when the initial ditch depth was 0.6 m or 0.9 m (Figs. 3b–c). Increase in volume growth was largest in the Norway spruce -dominated medium-fertile site, increasing nearly up to 30 m3 ha–1 in 20 years when the initial ditch depth was 0.9 m (Fig. 3c).
Ditch shallowing affected WTs especially in the 0.9 m initial ditch depth (Figs. 3d–f). Differences between the shallowing and reference scenarios were up to 45–50 cm for all site types in Southern Finland. In the initial ditch depth of 0.3 m changes were rather moderate (2–10 cm during the non-drought years).
Ecosystem C balances were mostly negative (source) in 2006 and 2018 (Suppl. files S5: g–i and S6: g–i), which were the exceptionally dry and warm years. WTs during these years were clearly deeper than in other years and consequently, soil C emissions considerably increased. Stand growth in the dry and warm years decreased in Southern Finland, whereas in Northern Finland growth slightly increased. Consequently, due to the increased soil C emissions and slight suppression of growth, the ecosystem C balances turned from sinks to sources during these years.
4 Discussion
Impacts of ditch shallowing on different ecosystem services have been scarcely studied. Previous studies have focused on the effects of initial drainage and DNM (Heikurainen and Seppälä 1973; Hökkä 1997; Ahtikoski et al. 2008; Hökkä et al. 2017; Nieminen et al. 2017). We quantified the impact of ditch shallowing on a set of ecosystem services in peatland forests throughout Finland. The results indicated that ditch shallowing had benefits for multiple ecosystem services simultaneously. In most sites, the ecosystem C sinks increased with ditch shallowing, while soil C emissions, and N and P exports decreased (Figs. 4 and 5). During the dry and warm years, WT was very deep (even >1 m), stand growth decreased, soil C emissions increased and the ecosystem changed from a C sink to a C source in the Southern sites (Suppl. files S5 and S6). Overall, sites located in Southern Finland had larger benefits from ditch shallowing compared to the Northern locations. However, it should be noted that the simulation results are based on average stand characteristics on specific site types with single tree species. The impacts of ditch shallowing on ecosystem services are not linear but can vary depending on stand volume and tree species composition.
In Southern Finland stands suffered from drought stress, which restricted stand growth during the dry and warm years (Suppl. files S5 and S6). In the deeper initial ditch depths, peat water storage was not fully recovered in the spring snowmelt, and consequently, WT remained low during the growing season causing cascading drought problems (Suppl. files S5: d–f and S6: d–f). In the ditch shallowing scenario, the WTs were considerably closer to the soil surface (Figs. 3d–f). Even in the Scots pine -dominated, nutrient poor site with Sphagnum peat, ditch shallowing resulted in considerably higher WTs in Southern Finland. Typically, the WT in Sphagnum peat is difficult to control with drainage due to the low hydraulic conductivity of the peat (Vompersky and Sirin 1997).
In 2006, Minkkinen et al. (2018) measured a WT as low as 0.8 m below soil surface even for a poor site type in Southern Finland, while Haahti et al. (2012) measured a WT of approximately 0.95 m for a pine -dominated medium-poor site in Lapland. Nevertheless, equivalent values for the extremely low WTs in Southern Finland that would be 1.2 m below the soil surface (Suppl. files S5 and S6) have not been reported in similar sites in literature according to our knowledge. The discrepancy between the simulated and measured WTs can result from measurement setups, where the groundwater tubes rarely extend deeper than 1.2 m, and from the hydrological equilibrium assumption used in the SUSI model. During a drought episode the hydrological equilibrium assumption overestimates topsoil water content and ignores decoupling of drying mor layer from the WT caused by the collapse in hydraulic conductivity of the drying mor layer (Laurén and Mannerkoski 2001). Therefore, in the model, evapotranspiration continues for a longer time at a higher rate than it would in reality, and results in exaggeration of simulated WT drawdown.
During the non-drought years, simulated WTs in Southern Finland were similar with e.g., Minkkinen et al. (2007), Sarkkola et al. (2013), Laurén et al. (2021) and Palviainen et al. (2022, 2024), who also measured WTs close to 1 m. On the other hand, Minkkinen et al. (2018) measured WTs between 0.3–0.5 m in a poor site type in Southern Finland. Typically, WTs are closer to the soil surface in Northern Finland than in Southern Finland due to a more humid climate. In other regions, WTs were in line with empirical studies, such as Haahti et al. (2012) who measured WTs between 0.15–0.55 m in a medium-poor site in Lapland.
Ecosystem net C exchange increased with ditch shallowing in most sites mainly due to reduced soil C emissions. While the impacts of drainage on ecosystem C storage components have been largely discussed, the net outcomes are yet somewhat uncertain. Drainage can increase the whole ecosystem C storage through better stand growth and increased litter production (Minkkinen et al. 1999; Lohila 2011; Minkkinen et al. 2018), while simultaneously causing C loss from the soil as a consequence of increased peat aeration and higher peat decomposition rates (Ojanen and Minkkinen 2019). In our study, decreases in soil C emissions with ditch shallowing were mostly larger than the loss in C sequestration due to decreased stand growth and related litter production. Hence, ecosystem C sinks increased in some sites even when stand growth decreased (Figs. 4a–c).
The mean annual ecosystem C balances varied mainly between –1000 kg C ha–1 yr–1 and 2000 kg C ha–1 yr–1 during the non-drought years (Suppl. file S5: g–i). For poor sites in Southern Finland, average annual ecosystem C sinks of 1473 kg C ha–1 yr–1 (Ojanen et al. 2013), 627 kg C ha–1 yr–1 (Minkkinen et al. 2018) and 2375 kg C ha–1 yr–1 (Lohila et al. 2011) have been reported. In Scotland, Hargreaves et al. (2003) estimated a Sitka spruce dominated peatland forest to be a relatively large ecosystem C sink of up to 5000 kg C ha–1 yr–1. The large differences in the measured ecosystem C sinks are affected by different measurement techniques and study periods, in addition to regional differences in temperature, precipitation, site types and tree species.
The soil C balances had high variation between the years (Suppl. files S5: j–l and S6: j–l). During the non-drought years, the simulated soil C emissions were larger compared to empirical studies especially in Southern Finland (Fig. 2a). The slow recovery of the WT after the drought can be seen several years in the soil C balance. Ojanen et al. (2013) measured soil C emissions of 355–818 kg C ha–1 yr–1 for fertile and medium-fertile sites, and C sink between 27–464 kg C ha–1 yr–1 for medium-poor and poor sites. In a drained peatland forest with agricultural history, an average annual sink of 1088 kg C ha–1 yr–1 was simulated for nutrient rich, Norway spruce -dominated site in Sweden (He et al. 2016). On the other hand, Jovani-Sancho et al. (2021) found all studied drained peatland forests in Southern Ireland to be soil C sources. The average soil C emissions were between 172–843 kg C ha–1 yr–1 for Sitka spruce -dominated sites (Picea sitchensis (Bong.) Carrière)) and 292 kg C ha–1 yr–1 for lodgepole pine -dominated sites (Pinus contorta Douglas ex Loudon).
In drained peatland forests, stand growth has an important role in ecosystem C balance (Minkkinen et al. 2001) and can turn the ecosystem into a C sink (Ojanen et al. 2013; Hommeltenberg et al. 2014; Bjarnadottir et al. 2021). In our study, increases in ecosystem C sinks were largest in fertile and medium-fertile sites in Southern Finland, where also stand growth increased with ditch shallowing when the initial ditch depth was 0.6 m or 0.9 m (Figs. 3b–c). Intensive drainage, high foliar biomass and low water supply had limited the stand growth. In these circumstances, ditch shallowing raised WT, improved water availability and increased stand growth with respect to the reference scenario. Additionally, sites in Southern Finland benefit from shallower ditches due to warmer temperatures and drier growing conditions (Hökkä et al. 2021), which explain the difference in stand growth response to ditch shallowing between Southern and Northern Finland. Ditch shallowing decreased stand growth in almost all sites in Central Finland, Northern Ostrobothnia–Kainuu and Lapland. Especially in the 0.3 m initial ditch depth, a remarkably lower stand volume growth decreased the whole ecosystem C sink even with reduced soil C emissions (Figs. 3a, 4a, 4d).
Stand growth in our simulations was higher for Southern locations compared to empirical studies. The simulated values ranged between 4–12 m3 ha–1 yr–1 in all ditch depths in Southern and Central Finland (Fig. 2b), while Minkkinen et al. (2018) found average stand growth to be 5 m3 ha–1 yr–1 and Minkkinen et al. (2001) between 2.9–7.5 m3 ha–1 yr–1 depending on site fertility. In Northern Ostrobothnia–Kainuu and Lapland, our simulated values ranged between 2–9 m3 ha–1 yr–1 (Fig. 2b), while Minkkinen et al. (2001) measured values between 1.9–5.1 m3 ha–1 yr–1. Ojanen et al. (2013) measured an average stand volume growth of 6.9 m3 ha–1 yr–1 for fertile and medium-fertile sites, and 3.9 m3 ha–1 yr–1 for medium-poor and poor sites throughout Finland. In our study, the stand volumes were rather high compared to most empirical studies in Finland, which have relatively young stands. Hence, comparison between other studies is more complicated.
Higher WT decreased organic matter decomposition and nutrient release which led to decreased N and P exports with ditch shallowing in all sites. Several studies have found that DNM increased exports of N and P to watercourses (Nieminen et al. 2005; Finér 2010; Nieminen et al. 2017), whereas reduced DNM decreased exports of N and P remarkably (Hökkä et al. 2017). During the average years, N exports in Lapland were similar with empirical research by e.g., Nieminen et al. (2020) and Finér et al. (2021), whose studies obtained values of 1.0 kg ha–1 yr–1 and 3.0 kg ha–1 yr–1, respectively. On the contrary, values in Southern Finland were drastically higher in our simulations, ranging from 1–18 kg ha–1 yr–1 in comparison to 1.8–4.5 kg ha–1 yr–1 by Nieminen et al. (2020) and Finér et al. (2021), respectively. In addition, during dry years and low WT, vegetation in the ditches can uptake nutrients and decrease the realized nutrient export to water courses. For P exports, values for different regions were higher compared to empirical studies. In Lapland the values range roughly from 0–2 kg ha–1 yr–1, while empirical studies show 0.05–0.12 kg ha–1 yr–1 (Nieminen et al. 2020; Finér et al. 2021). In Southern Finland the difference was larger: 0–2.5 kg ha–1 yr–1 in our simulations compared to 0.114–0.15 kg ha–1 yr–1 in empirical studies (Nieminen et al. 2020; Finér et al. 2021). While high nutrient exports may occur after dry years in field conditions, our model likely overestimates the export load due to the simplified calculation. In SUSI, all nutrients released below the rooting zone are transported to water courses in an annual time step. While this can be a valid solution when WT is rather shallow and remains within the depth of ditches, it is likely to clearly overestimate the nutrient export during dry years and low WTs.
Ditch processes, such as water flow and nutrient uptake, were outside the scope of the simulations. However, ditch processes play an important role in hydrology and biogeochemistry of drained peatlands. Water flow rate in the ditch is affected by the ditch water level. When the water level falls below the ditch bottom the flow resistance increases (Haahti 2018; Urzainki 2023) and the sedimentation processes, sedimenting material (Stenberg 2015) and vegetation properties become important. In these cases, the flow velocity depends on the peat or mineral soil characteristics as the flow resistance can be orders of magnitude higher in highly decomposed peat or fine textured mineral than in low-humified peat or undecomposed sphagnum moss (Päivänen 1973). If the water level is above the ditch bottom, the flow velocity depends on the amount, dimensions and properties of vegetation (Järvelä 2002). Water flow velocity in ditch controls the ditch water level, water residence time and reflects to peat WT and quality of runoff (Urzainki 2023; Palviainen et al. 2024).
The two scenarios enabled us to compare the impacts of ditch shallowing on multiple peatland forest ecosystem services. Our results indicate that different regions require different type of water management due to varying climatic conditions and site types. Increasing temperatures caused by climate change is expected to further lower WTs and increase organic matter decomposition in drained peatland forests (Meyer 2013), and hence, decrease the need for DNM. Especially in drier regions, such as Southern Finland, implementing DNM during the next 20-year period might not be viable, as sites from nutrient rich to nutrient poor benefited from ditch shallowing in regards to most ecosystem services. In fact, considering reducing drainage intensity by partial ditch blocking can be a viable water management practice that can both increase stand growth, decrease C emissions and nutrient exports to water courses. In Central Finland, Northern Ostrobothnia–Kainuu and Lapland, implementing DNM should be carefully considered as the stand growth increase remains rather small in relation to other adverse impacts such as decreased ecosystem C sink. While stand growth in more Northern locations can benefit from DNM, other less harmful options should be considered alongside DNM.
5 Conclusions
The results indicate that drained peatland forests require different types of water management practices depending on their geographical location, and there is no single recipe that fits all regions and site types. Ditch shallowing had the largest benefits for all studied ecosystem services when the initial ditch depth was 0.9 m. Omitting DNM is a feasible alternative for forest owners as it decreases C emissions and nutrient export loads to watercourses, and forest growth may also benefit from higher WT especially in Southern Finland. There is a need for long-term planning that takes into account the effect of climate warming and considers water management in catchment scale.
Declaration of openness of research materials, data, and code
The forest data were obtained from open data sources of the Natural Resources Institute of Finland (2023) and the Finnish Forest Centre (2023), and weather data were obtained from the Finnish Meteorological Institute (2024). The source code of the SUSI simulator is openly available at https://github.com/annamarilauren/susi_2024. All data, code, supplementary files and metadata form are openly available at the Zenodo data repository: https://doi.org/10.5281/zenodo.17130513.
Author’s contributions
AS: Conceptualization, Methodology, Data-analysis/curation, Visualization, Writing – original draft
MP: Conceptualization, Funding acquisition, Project administration, Methodology, Data curation, Visualization, Writing – original draft / review & editing
MTN: Conceptualization, Methodology, Data curation, Visualization, Writing – original draft / review & editing
AL: Conceptualization, Funding acquisition, Project administration, Methodology, Data curation, Visualization, Writing – original draft / review & editing
Funding
This research was funded by Maj and Tor Nessling Foundation (Vesimassi-project, grant number: 202140014), Maa- ja vesitekniikan tuki ry (Monitavoitteinen vesienhallinta turvekankailla -project, grant number: 48538) and Research Impact Foundation (AEMES-project, Tandem Industry Academia Post doc funding 610).
References
Ahti E, Päivänen J (1997) Response of stand growth and water table level to maintenance of ditch networks within forest drainage areas. In: Trettin CC, Jurgensen MF, Grigal DF, Gale MR, Jeglum JK (eds) Northern forested wetlands: ecology and management. CRC Press, Lewis Publishers, USA, pp 449–457. https://doi.org/10.1201/9780203745380-32.
Ahtikoski A, Kojola S, Hökkä H, Penttilä T (2008) Ditch network maintenance in peatland forest as a private investment: short- and long-term effects on financial performance at stand level. Mires Peat 3: 1–11. https://doi.org/10.19189/001c.128253.
Bjarnadottir B, Sungur GA, Sigurdsson BD, Kjartansson BT, Oskarsson H, Oddsdottir ES, Gunnarsdottir GE, Black A (2021) Carbon and water balance of an afforested shallow drained peatland in Iceland. For Ecol Manag 482, article id 118861. https://doi.org/10.1016/j.foreco.2020.118861.
Braekke FH (1983) Water table levels at different drainage intensities on deep peat in Northern Norway. For Ecol Manag 5: 169–192. https://doi.org/10.1016/0378-1127(83)90070-1.
Buck AL (1981) New equations for computing vapor pressure and enhancement factor. J Appl Meteorol 20: 1527–1532. https://doi.org/10.1175/1520-0450(1981)020<1527:NEFCVP>2.0.CO;2.
Finér L, Laine J (1998) Root dynamics at drained peatland sites of different fertility in southern Finland. Plant Soil 201: 27–36. https://doi.org/10.1023/A:1004373822354.
Finér L, Mattsson T, Joensuu S, Koivusalo H, Laurén A, Makkonen T, Nieminen M, Tattari S, Ahti E, Kortelainen P, Koskiaho J, Leinonen A, Nevalainen R, Piirainen S, Saarelainen J, Sarkkola S, Vuollekoski M (2010) Metsäisten valuma-alueiden vesistökuormituksen laskenta. [A method for calculating nitrogen, phosphorus and sediment load from forest catchments]. Suomen ympäristö 10. http://hdl.handle.net/10138/37973.
Finér L, Lepistö A, Karlsson K, Räike A, Härkönen L, Huttunen M, Joensuu S, Kortelainen P, Mattsson T, Piirainen S, Sallantaus T, Sarkkola S, Tattari S, Ukonmaanaho L (2021) Drainage for forestry increases N, P and TOC export to boreal surface waters. Sci Total Environ 762, article id 144098. https://doi.org/10.1016/j.scitotenv.2020.144098.
Finnish Forest Centre (FFC) (2023) Inventointikoealat. [Inventory plots]. https://www.metsakeskus.fi/fi/avoin-metsa-ja-luontotieto/aineistot-paikkatieto-ohjelmille/paikkatietoaineistot. Accessed 22 August 2023.
Finnish Meteorological Institute (FMI) (2024) The Finnish Meteorological Institute’s open data. https://en.ilmatieteenlaitos.fi/open-data. Accessed 10 September 2024.
Haahti K (2018) Modelling hydrology and sediment transport in a drained peatland forest – focus on sediment load generation and control after ditch network maintenance. Aalto University publication series DOCTORAL DISSERTATIONS 45. http://urn.fi/URN:ISBN:978-952-60-7890-8.
Haahti K, Koivusalo H, Hökkä H, Nieminen M, Sarkkola S (2012) Vedenpinnan syvyyden spatiaaliseen vaihteluun vaikuttavat tekijät ojitetussa suometsikössä Pohjois-Suomessa. [Factors affecting the spatial variability of water table depth within a drained peatland forest stand in northern Finland]. Suo 63: 107–121. http://suo.fi/article/9883. Accessed 22 August 2023.
Hargreaves KJ, Milne R, Cannell MGR (2003) Carbon balance of afforested peatland in Scotland. Forestry 76: 299–317. https://doi.org/10.1093/forestry/76.3.299.
He H, Jansson P-E, Svensson M, Björklund J, Tarvainen L, Klemedtsson L, Kasimir Å (2016) Forests on drained agricultural peatland are potentially large sources of greenhouse gases – insights from a full rotation period simulation. Biogeosciences 13: 2305–2318. https://doi.org/10.5194/bg-13-2305-2016.
Heikurainen L (1957) Metsäojien syvyyden ja pintaleveyden muuttuminen sekä ojien kunnon säilyminen. [Changes in depth and top width of forest ditches and the maintaining of their repair]. Acta For Fenn 65, article id 7468. https://doi.org/10.14214/aff.7468.
Heikurainen L, Kuusela K (1962) Revival of the tree growth after drainage and its dependence on tree size and age. Commun Inst For Fenn 55: 1–15. http://urn.fi/URN:NBN:fi-metla-201207171087.
Heikurainen L, Seppälä K (1973) Ojitusalueiden puuston kasvun jatkumisesta ja alueellisuudesta. [Regional variation and continuity of stand growth in old forest drainage areas]. Acta For Fenn 132, article id 7566. https://doi.org/10.14214/aff.7566.
Hökkä H (1997) Models for predicting growth and yield in drained peatland stands in Finland. Finnish Forest Research Institute Research Papers 651: 1–20. http://urn.fi/URN:ISBN:951-40-1579-7.
Hökkä H, Salminen H, Ahtikoski A, Kojola S, Launiainen S, Lehtonen M (2017) Long-term impact of ditch network maintenance on timber production, profitability and environmental loads at regional level in Finland: a simulation study. Forestry 90: 234–246. https://doi.org/10.1093/forestry/cpw045.
Hökkä H, Stenberg L, Laurén A (2020) Modeling depth of drainage ditches in forested peatlands in Finland. Baltic For 26, article id 453. https://doi.org/10.46490/BF453.
Hökkä H, Palviainen M, Stenberg L, Heikkinen J, Laurén A (2025) Changing role of water table and weather conditions in diameter growth of Scots pine in drained peatlands. Can J Forest Res 55: 1–12. https://doi.org/10.1139/cjfr-2024-0011.
Holden J, Evans MG, Burt TP, Horton M (2006) Impact of land drainage on peatland hydrology. J Environ Qual 35: 1764–1778. https://doi.org/10.2134/jeq2005.0477.
Hommeltenberg J, Schmid HP, Drösler M, Werle P (2014) Can a bog drained for forestry be a stronger carbon sink than a natural bog forest? Biogeosciences 11: 3477–3493. https://doi.org/10.5194/bg-11-3477-2014.
Hynynen J, Ojansuu R, Hökkä H, Siipilehto J, Salminen H, Haapala P (2002) Models for predicting stand development in MELA system. Finnish Forest Research Institute Research Papers 835: 1–116. http://urn.fi/URN:ISBN:951-40-1815-X.
Järvelä J (2002) Flow resistance of flexible and stiff vegetation: a flume study with natural plants. J Hydrol 269: 44–54. https://doi.org/10.1016/S0022-1694(02)00193-2.
Joensuu S, Ahti E, Vuollekoski M (1999) The effects of peatland forest ditch maintenance on suspended solids in runoff. Boreal Environ Res 4: 343–355. http://urn.fi/URN:NBN:fi-fe2016091423738.
Jovani-Sancho AJ, Cummins T, Byrne KA (2021) Soil carbon balance of afforested peatlands in the maritime temperate climatic zone. Glob Change Biol 27: 3681–3698. https://doi.org/10.1111/gcb.15654.
Kimmel K, Mander Ü (2010) Ecosystem services of peatlands: implications for restoration. Prog Phys Geog 34: 491–514. https://doi.org/10.1177/0309133310365595.
Korhonen KT, Ahola A, Heikkinen J, Henttonen H-M, Hotanen J-P, Ihalainen A, Melin M, Pitkänen J, Räty M, Sirviö M, Strandström M (2021) Forests of Finland 2014–2018 and their development 1921–2018. Silva Fenn 55, article id 10662. https://doi.org/10.14214/sf.10662.
Laiho R, Vasander H, Penttilä T, Laine J (2003) Dynamics of plant-mediated organic matter and nutrient cycling following water-level drawdown in boreal peatlands. Global Biogeochem Cycles 17, article id 1053. https://doi.org/10.1029/2002GB002015.
Laine J, Vanha-Majamaa I (1992) Vegetation ecology along a trophic gradient on drained pine mires in southern Finland. Ann Bot Fenn 29: 213–233. https://www.jstor.org/stable/23725387.
Laine J, Vasander H, Laiho R (1995) Long-term effects of water level drawdown on the vegetation of drained pine mires in southern Finland. J Appl Ecol 32: 785–802. https://doi.org/10.2307/2404818.
Launiainen S, Guan M, Salmivaara A, Kieloaho A-J (2019) Modeling boreal forest evapotranspiration and water balance at stand and catchment scales: a spatial approach. Hydrol Earth Syst Sci 23: 3457–3480. https://doi.org/10.5194/hess-23-3457-2019.
Laurén A., Mannerkoski H (2001) Hydraulic properties of mor layers in Finland. Scand J Forest Res 16: 429–441. https://doi.org/10.1080/02827580152632829.
Laurén A, Palviainen M, Launiainen S, Leppä K, Stenberg L, Urzainki I, Nieminen M, Laiho R, Hökkä H (2021) Drainage and stand growth response in peatland forests – description, testing, and application of mechanistic peatland simulator SUSI. Forests 12, article id 293. https://doi.org/10.3390/f12030293.
Lohila A, Minkkinen K, Aurela M, Tuovinen J-P, Penttilä T, Ojanen P, Laurila T (2011) Greenhouse gas flux measurements in a forestry-drained peatland indicate a large carbon sink. Biogeosciences 8: 3203–3218. https://doi.org/10.5194/bg-8-3203-2011.
Lukkala O-J (1927) What points of view have to be taken into consideration, when draining swamp lands for afforestation. Silva Fenn 4, article id 4443. https://doi.org/10.14214/sf.a8391.
Mäkelä A, Pulkkinen M, Kolari P, Lagergren F, Berbinger P, Lindroth A, Loustau D, Nikinmaa E, Vesala T, Hari P (2008) Developing an empirical model of stand GPP with the LUE approach: analysis of eddy covariance data at five contrasting conifer sites in Europe. Glob Change Biol 14: 92–108. https://doi.org/10.1111/j.1365-2486.2007.01463.x.
Meyer A, Tarvainen L, Nousratpour A, Björk R, Ernfors M, Grelle A, Kasimir Klemedtsson Å, Lindroth A, Räntfors M, Rütting T, Wallin G, Weslien P, Klemedtsson L (2013) A fertile peatland forest does not constitute a major greenhouse gas sink. Biogeosciences 10: 7739–7758. https://doi.org/10.5194/bg-10-7739-2013.
Millennium Ecosystem Assessment (2005) Ecosystems and human well-being: wetlands and water. Synthesis. Island Press, Washington, DC. ISBN 1-56973-597-2.
Minkkinen K, Laine J (1998a) Long-term effect of forest drainage on the peat carbon stores of pine mires in Finland. Can J Forest Res 28: 1267–1275. https://doi.org/10.1139/x98-104.
Minkkinen K, Laine J (1998b) Effect of forest drainage on the peat bulk density of pine mires in Finland. Can J Forest Res 28: 178–186. https://doi.org/10.1139/x97-206.
Minkkinen K, Vasander H, Jauhiainen S, Karsisto M, Laine J (1999) Post-drainage changes in vegetation composition and carbon balance in Lakkasuo mire, Central Finland. Plant Soil 207: 107–120. https://doi.org/10.1023/A:1004466330076.
Minkkinen K, Laine J, Hökkä H (2001) Tree stand development and carbon sequestration in drained peatland stands in Finland – a simulation study. Silva Fenn 35: 55–69. https://doi.org/10.14214/sf.603.
Minkkinen K, Laine J, Shurpali NJ, Mäkiranta P, Alm J, Penttilä T (2007) Heterotrophic soil respiration in forestry-drained peatlands. Boreal Env Res 12: 115–126. http://urn.fi/URN:NBN:fi-fe2016091323713.
Minkkinen K, Ojanen P, Penttilä T, Aurela M, Laurila T, Tuovinen J, Lohila A (2018) Persistent carbon sink at a boreal drained bog forest. Biogeosciences 15: 3603–3624. https://doi.org/10.5194/bg-15-3603-2018.
Muukkonen P, Mäkipää R (2005) Empirical biomass models of understorey vegetation in boreal forests according to stand and site attributes. Boreal Environ Res 11: 355–369. https://urn.fi/URN:NBN:fi-fe2016091423720.
Natural Resources Institute Finland (2023) NFI computing service. https://vmilapa.luke.fi. Accessed 20 November 2023.
Natural Resources Institute Finland Statistics Database (2024) The amount of silvicultural and forest improvement work 1950- (ha). https://statdb.luke.fi/PxWeb/pxweb/en/LUKE/LUKE__met__methoi/. Accessed 15 December 2024.
Nieminen M, Ahti E, Nousiainen H, Joensuu S, Vuollekoski M (2005) Capacity of riparian buffer zones to reduce sediment concentrations in discharge from peatlands drained for forestry. Silva Fenn 39: 331–339. https://doi.org/10.14214/sf.371.
Nieminen M, Palviainen M, Sarkkola S, Laurén A, Marttila H, Finér L (2017) A synthesis of the impacts of ditch network maintenance on the quantity and quality of runoff from drained boreal peatland forests. Ambio 47: 523–534. https://doi.org/10.1007/s13280-017-0966-y.
Nieminen M, Sarkkola S, Haahti K, Sallantaus S, Koskinen M, Ojanen P (2020) Metsäojitettujen soiden typpi- ja fosforikuormitus. [Forestry on drained peatlands as a source of surface water nitrogen and phosphorus in Finland]. Suo 71: 1–13. http://suo.fi/article/10398. Accessed 22 August 2023.
Ojanen P, Minkkinen K (2019) The dependence of net soil CO2 emissions on water table depth in boreal peatland drained for forestry. Mires Peat 24, article id 27. https://doi.org/10.19189/MaP.2019.OMB.StA.1751.
Ojanen P, Minkkinen K, Alm J, Penttilä T (2010) Soil–atmosphere CO2, CH4 and N2O fluxes in boreal forestry-drained peatlands. For Ecol Manag 260: 411–421. https://doi.org/10.1016/j.foreco.2010.04.036.
Ojanen P, Minkkinen K, Penttilä T (2013) The current greenhouse gas impact of forestry-drained boreal peatlands. For Ecol Manag 289: 201–208. https://doi.org/10.1016/j.foreco.2012.10.008.
Päivänen J (1973) Hydraulic conductivity and water retention in peat soils. Acta For Fenn 129, article id 7563. https://doi.org/10.14214/aff.7563.
Päivänen J, Hånell B (2012) Peatland ecology and forestry – a sound approach. University of Helsinki, Department of Forest Sciences, Publications 3. ISBN 978-952-10-4531-8.
Palviainen M, Peltomaa E, Laurén A, Kinnunen N, Ojala A, Berninger F, Zhu X, Pumpanen J (2022) Water quality and the biodegradability of dissolved organic carbon in drained boreal peatland under different forest harvesting intensities. Sci Total Environ 806, article id 150919. https://doi.org/10.1016/j.scitotenv.2021.150919.
Palviainen M, Pumpanen J, Mosquera V, Maher Hasselquist E, Laudon H, Ostonen I, Kull A, Renou Wilson F, Peltomaa E, Könönen M, Launiainen S, Peltola H, Ojala A, Laurén A (2024) Extending the SUSI peatland simulator to include dissolved organic carbon formation, transport and biodegradation – proper water management reduces lateral carbon fluxes and improves carbon balance. Sci Total Environ 950, article id 175173. https://doi.org/10.1016/j.scitotenv.2024.175173.
Pitkänen A, Simola H, Turunen J (2012) Dynamics of organic matter accumulation and decomposition in the surface soil of forestry-drained peatland sites in Finland. For Ecol Manag 284: 100–106. https://doi.org/10.1016/j.foreco.2012.07.040.
Rissanen A-J, Ojanen P, Stenberg L, Larmola T, Anttila J, Tuominen S, Minkkinen K, Koskinen M, Mäkipää R (2023) Vegetation impacts ditch methane emissions from boreal forestry-drained peatlands – moss-free ditches have an order-of-magnitude higher emissions than moss-covered ditches. Front Environ Sci 11, article id 1121969. https://doi.org/10.3389/fenvs.2023.1121969.
Salminen H, Lehtonen M, Hynynen J (2005) Reusing legacy FORTRAN in the MOTTI growth and yield simulator. Comput Electron Agr 49: 103–113. https://doi.org/10.1016/j.compag.2005.02.005.
Sarkkola S, Hökkä H, Ahti E, Koivusalo H, Nieminen M (2012) Depth of water table prior to ditch network maintenance is a key factor for tree growth response. Scand J Forest Res 27: 649–658. https://doi.org/10.1080/02827581.2012.689004.
Sarkkola S, Nieminen M, Koivusalo H, Laurén A, Ahti E, Launiainen S, Nikinmaa E, Marttila H, Laine J, Hökkä H (2013) Domination of growing-season evapotranspiration over runoff makes ditch network maintenance in mature peatland forests questionable. Mires Peat 11: 1–11. https://doi.org/10.19189/001c.128474.
Seppälä K (1972) Ditch spacing as a regulator of post-drainage stand development in spruce and in pine swamps. Acta For Fenn 125, article id 7559. https://doi.org/10.14214/aff.7559.
Sevola Y (1998) Metsätilastollinen vuosikirja 1998. [Finnish statistical yearbook of forestry]. Finnish Forest Research Institute (Metla). http://urn.fi/URN:ISBN:951-40-1654-8.
Sikström U, Hökkä H (2016) Interactions between soil water conditions and forest stands in boreal forests with implications for ditch network maintenance. Silva Fenn 50, article id 1416. https://doi.org/10.14214/sf.1416.
Simard M, Lecomte N, Bergeron Y, Bernier P-Y, Pare D (2007) Forest productivity decline caused by successional paludification of boreal soils. Ecol Appl 17: 1619–1637. https://doi.org/10.1890/06-1795.1.
Stenberg L, Tuukkanen T, Finér L, Marttila H, Piirainen S, Kløve B, Koivusalo H (2015) Ditch erosion processes and sediment transport in a drained peatland forest. Ecol Eng 75: 421–433. https://doi.org/10.1016/j.ecoleng.2014.11.046.
Timonen E (1983) Havaintoja auraus- ja kaivuriojien mitoista ja kunnosta soilla. [The size and condition of ditches made by ploughs and tractor diggers in drained peatlands]. Suo 34: 29–39. https://suo.fi/article/9567. Accessed 22 August 2023.
Urzainki I (2023) Process-based ecosystem models to support management of drained peatland forests. Diss For 345. https://doi.org/10.14214/df.345.
Vanhatalo K, Väisänen P, Joensuu S, Sved J, Koistinen A, Äijälä O (2019) Metsänhoidon suositukset suometsien hoitoon, työopas. [Management guidelines for peatland forests]. Tapion julkaisuja. https://tapio.fi/wp-content/uploads/2020/09/Metsanhoidon_suositukset_suometsien-hoitoon_TAPIO_2019.pdf. Accessed 15 December 2024.
Vasander H, Laine J (2008) Site type classification on drained peatlands. In: Korhonen R, Korpela L, Sarkkola S (eds) Finland – Fenland: research and sustainable utilisation of mires and peat. Finnish Peatland Society & Maahenki, Helsinki, pp 146–151. ISBN 978-952-5652-47-5.
Verry E-S (1997) Hydrological processes of natural, northern forested wetlands. In: Trettin CC, Jurgensen MF, Grigal DF, Gale MR, Jeglum JK (eds) Northern forested wetlands: ecology and management. CRC Press, Lewis Publishers, USA, pp 163–188. https://doi.org/10.1201/9780203745380-13.
Vompersky S, Sirin A (1997) Hydrology of drained forested wetlands. In: Trettin CC, Jurgensen MF, Grigal DF, Gale MR, Jeglum JK (eds) Northern forested wetlands: ecology and management. CRC Press, Lewis Publishers, USA, pp 189–211. https://doi.org/10.1201/9780203745380-14.
Total of 75 references.
