
Helena Haakana  ,
Juho Matala,
Saija Huuskonen,
Kari T. Korhonen,
Ari Nikula,
Minna Räty
Impact of moose damage on the development of Scots pine seedling stands based on the National Forest Inventory of Finland
Haakana H., Matala J., Huuskonen S., Korhonen K. T., Nikula A., Räty M. (2026). Impact of moose damage on the development of Scots pine seedling stands based on the National Forest Inventory of Finland. Silva Fennica vol. 60 no. 4 article id 25034. https://doi.org/10.14214/sf.25034
Highlights
- Moose damage increased slightly from 5.2% to 6.1% of Finland’s forests available for wood production over the past two decades
- Remeasurements on permanent sample plots showed that moose damage affected 44% of the area of young seedling stands artificially regenerated for Scots pine
- Moose damage resulted in a shift in the dominant tree species on 23% of this damaged area.
Abstract
In Fennoscandia, moose (Alces alces L.) browsing significantly damages commercial forests, influencing tree species composition and seedling growth. We examined the long-term development of moose-damaged forests in Finland, focusing on seedling stands artificially regenerated for Scots pine (Pinus sylvestris L.). The analysis used National Forest Inventory (NFI) data from four consecutive five-year periods (2004–2023). Remeasured permanent sample plots were used to compare the development of damaged and undamaged stands. The total area affected by moose increased from 0.966 to 1.116 million hectares over the four NFI cycles. Of this, 61% was significantly damaged, indicating reduced silvicultural quality, and the proportion was higher in the north. Among young seedling stands recorded in the first inventory as being artificially regenerated for Scots pine, moose damage affected 44% of their total area nationwide over the study period, with a higher proportion in the south. Moose browsing frequently shifted the dominant tree species from Scots pine to downy birch (Betula pubescens Ehrh.) and, secondarily, Norway spruce (Picea abies (L.) H. Karst.). Where notable or severe damage was observed in the first inventory, crop seedling numbers remained lower throughout the study. Our findings show that moose browsing has long-term effects on tree species composition and stand structure, including mean height, mean diameter, and density. Damage patterns vary regionally and by stand characteristics, although many previously affected stands show recovery or reduced impacts. Large-scale monitoring systems such as NFIs provide long-term data for detecting changes in browsing intensity and vegetation, thereby supporting forest and wildlife management.
Keywords
Pinus sylvestris;
Alces alces;
tree species composition;
browsing damage;
monitoring forest damage;
Scots pine regeneration
-
Haakana,
Natural Resources Institute Finland (Luke), P.O. Box 2, FI-00791 Helsinki, Finland
 https://orcid.org/0000-0002-4830-800X
E-mail
helena.haakana@luke.fi
-
Matala,
Natural Resources Institute Finland (Luke), Yliopistokatu 6, FI-80100 Joensuu, Finland
https://orcid.org/0000-0002-5867-5057
E-mail
juho.matala@luke.fi
- Huuskonen, Metsähallitus, Forestry Ltd. P.O. Box 80, FI-00521 Helsinki, Finland E-mail saija.huuskonen@metsa.fi
-
Korhonen,
Natural Resources Institute Finland (Luke), Yliopistokatu 6, FI-80100 Joensuu, Finland
https://orcid.org/0000-0002-6198-853X
E-mail
kari.t.korhonen@luke.fi
-
Nikula,
Natural Resources Institute Finland (Luke), Ounasjoentie 6, FI-96200 Rovaniemi, Finland
https://orcid.org/0000-0001-8372-8440
E-mail
ari.nikula@luke.fi
-
Räty,
Natural Resources Institute Finland (Luke), P.O. Box 2, FI-00791 Helsinki, Finland
https://orcid.org/0000-0001-9898-8712
E-mail
minna.raty@luke.fi
Received 9 July 2025 Accepted 17 October 2026 Published 12 November 2026
Views 246
Available at https://doi.org/10.14214/sf.25034 | Download PDF

Supplementary Files
1 Introduction
Herbivores modify boreal ecosystems by affecting the growth and biomass of the plants they consume, altering the relative abundance of plant species and influencing interspecific competition (Rooney and Waller 2003; Côté et al. 2004; Komonen et al. 2020). Herbivores are therefore important also from a forestry perspective, as browsing can jeopardize the achievement of forest management objectives. Since the 1960s, the so-called Nordic forest management model has relied primarily on clear-cutting and planting, most frequently with conifers, Scots pine (Pinus sylvestris L.) and Norway spruce (Picea abies (L.) H. Karst.), and less frequently with broadleaved species, mainly silver birch (Betula pendula Roth). Clearings and thinnings in sapling stands are conducted to regulate tree density and species composition, aiming to maximize the growth of the economically most valuable tree crop. However, large herbivores, such as moose (Alces alces L.), can hinder the achievement of forestry objectives, as their browsing can change the tree species composition and growth of seedlings. In fact, moose is considered the most significant damage agent in forest seedling stands in Fennoscandia (Lavsund et al. 2003; Nevalainen et al. 2016; Korhonen et al. 2024a), causing growth losses and reducing timber quality, which in turn leads to economic losses (Wallgren et al. 2014; Matala et al. 2020).
Forests cover over 55% of the total land area in the Nordic countries, and as much as 74% in Finland and 69% in Sweden (Hannertz and Ekström 2023). Main tree species in Finland and Sweden are Scots pine and Norway spruce. Most of the productive forests in Finland are dominated by Scots pine (63%), followed by Norway spruce (25%), and only 10% by broadleaved species (Korhonen et al. 2024a), and are managed under a rotation forestry system. In Nordic forestry, planting is used as the regeneration method for all commercially important tree species, while direct seeding is applied mainly to Scots pine. In Finland, planting was used as the regeneration method on 77% of the artificially regenerated sites in year 2021, and direct seeding on the remaining 23% (Peltola and Vaahtera 2022).
Over the last decades, the proportions of tree species used in regeneration have varied. During the 1970s and 1980s, Scots pine was the most commonly planted species, accounting for 82% of the seedlings produced between 1978 and 1982. Since 1995, Norway spruce seedlings have accounted for the largest proportion of seedlings used in regeneration. By 2023, 60% of the seedlings used were Norway spruce, whereas only 34% were Scots pine (Luke 2024). One reason for the decline in proportion of Scots pine regeneration area in Finland has been the high risk of moose damage (Viiri 2007).
In Finland, moose have benefited from large-scale forest regeneration areas consisting of single-species, even-aged Scots pine seedling stands since the 1950s and 1960s (Markgren 1974; Lavsund 1987). As a consequence of these favorable browsing conditions, along with hunting regulation, moose populations increased rapidly in the early 1970s and have remained at relatively high levels since then (Cederlund and Markgren 1987; Nygrén 1987).
Higher moose populations have resulted in both a higher proportion and a larger area of moose damage, especially in Scots pine seedling stands (Nevalainen et al. 2016; Korhonen et al. 2021). Even relatively mild browsing can cause quality defects and reduced growth in Scots pine seedlings, which later results in a loss of sawn timber yield in thinning and final felling (Matala et al. 2020). As Scots pine is the main winter food source for moose (Bergström and Hjeljord 1987) and given that moose typically browse the same stands repeatedly (Bergquist et al. 2003), repeated moose browsing can lead to more severe damage with increased seedling mortality (Wallgren et al. 2014). If browsing-related mortality is high and more browse-tolerant species are present in a stand, heavily browsed species may be outcompeted. For example, Norway spruce may benefit indirectly as moose browsing is directed toward other tree species (Hjeljord and Grønvold 1988).
National Forest Inventories (NFIs) provide information on land use and its changes, the amount and increment of growing stock, cutting possibilities, the health status and ownership structure of forests, the quality of forest management, and indicators of forest biodiversity (Korhonen et al. 2021). Field measurements include observations of forest damage, generally covering its symptoms, causal agent, age, and severity as assessed by its effects on stand quality. Regarding moose damage, NFIs have so far provided insights into moose browsing preferences (Hörnberg 2001a), the risk of damage by tree species proportions and other stand-level measures (Nevalainen et al. 2016), the influence of bedrock and soil on moose damage (Ruuhola et al. 2016), the scale of damage at regional and national level (Tomppo and Joensuu 2003; Nevalainen et al. 2016) and the relationship between moose population density and damage (Hörnberg 2001b; Nikula et al. 2021).
In addition to directly follow or study moose or other deer damage (Tomppo and Joensuu 2003; Nevalainen et al. 2016; Brock et al. 2023), data from NFIs have been used to analyse vulnerability of different forest stand properties on cervid damage (Diaz-Yanez et al. 2017), forage availability for deer in forests (Graf et al. 2026) and deer forage use (Wam et al. 2021). Furthermore, NFIs are useful in studying impacts of cervids on forest ecosystem including understory vegetation (Corcoran et al. 2026).
Earlier studies on moose damage based on NFI data have relied on observations from a single time point or from several time points, but without utilizing the information provided by permanent plots. By using remeasurements of permanent plots, it is possible to assess the development of individual plots or stands over time. NFI field data include several variables that describe forest stand structure and stand quality from a timber production perspective. Tree-level measurements provide accurate information on growing-stock volume at plot level. Plot level time series of these parameters, together with data on damage occurring between measurements, provide a unique opportunity to study the long-term impact of moose damage on the development of seedling stands and its potential effects on stand structure and tree species composition.
Given the variation in moose population density and the declining use of Scots pine in regeneration, our first aim was to examine temporal and regional patterns in the prevalence and severity of moose damage in Finland. We quantified changes in the area affected by moose damage between 2004 and 2023 across different vegetation zones and, focusing on seedling stands, assessed damage occurrence in relation to geographical location, stand development stage, dominant tree species, and regeneration method. Our second aim was, for the first time, to utilize remeasurements of permanent NFI sample plots to analyze how Scots pine seedling stands develop following different levels of moose browsing compared with undamaged stands. Specifically, we examined the persistence of previously recorded damage and the development of damaged stands through stand density, the mean height and diameter of the growing stock, and changes in dominant tree species.
2 Material and methods
The study encompassed the whole Finland locating on four different forest vegetation zones (Fig. 1). The area of hemi-boreal zone covers only a small area on a south-west corner of Finland and was therefore combined with the southern boreal zone. The Finnish NFI is based on a systematic cluster sampling where a part of the sample plot clusters is permanent and remeasured in subsequent inventories. The remaining sample plot clusters are temporary and are measured only in one inventory round, with new locations established for each subsequent inventory round. Due to the large-scale spatial variation in forest characteristics and the differing sizes of the administrative regions for which NFI results are reported, sampling density varies across regions (Tomppo et al. 2011), being highest in the south.
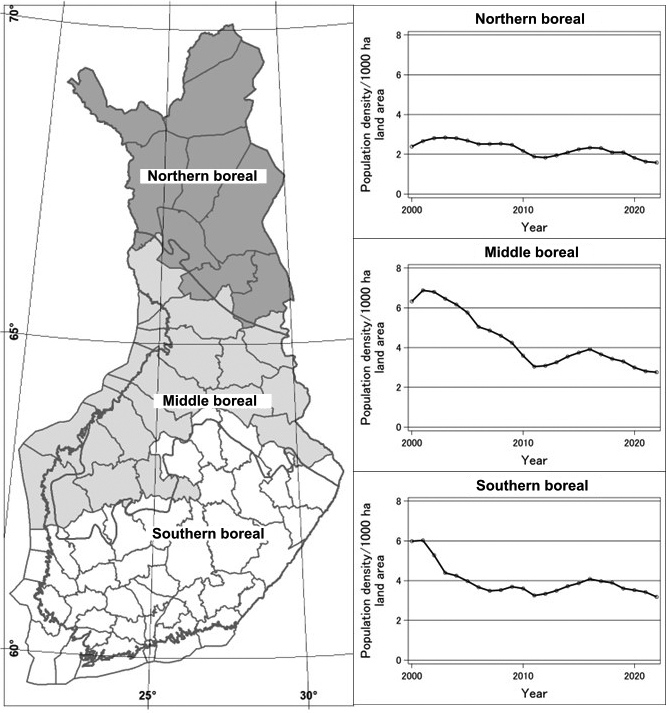
Fig. 1. Delineation of the three regions, which follow the vegetation zones while adhering to the administrative borders of the moose management areas in Finland. The vegetation zones are indicated by smooth lines on the map, with the small hemi-boreal areas in southwestern Finland included in the southern boreal zone. For each region, variation in moose population density during 2000–2022 is presented based on Luke’s official moose population estimates (Pusenius et al. 2024).
For the analyses, we used field measurements from the four consecutive NFIs: NFI10 carried out in 2004–2008 (Korhonen et al. 2013), NFI11 in 2009–2013 (Korhonen et al. 2017), NFI12 in 2014–2018 (Korhonen et al. 2021) and NFI13 in 2019–2023 (Korhonen et al. 2024a). In NFI10, sample plots of every fourth cluster were established as permanent, and these sample plots have been remeasured in all subsequent inventories.
In the NFI, forest characteristics, including damage, are assessed at the forest stand level. A forest stand is defined as a homogeneous area in terms of land use, site characteristics, ownership, forestry restrictions, structure of the growing stock, and both completed and proposed forest management activities. The recommended minimum stand size is 0.5 ha, but smaller units can be delineated if they clearly differ from their surroundings. Stand-level variables are assessed within the nearest 0.25 ha area surrounding the plot center. If a sample plot extends into two or more stands, each stand is described separately. The land use class of a sample plot stand determines the extent of the stand description. For sample plots located on forest land, defined as areas with a potential mean annual increment of at least 1 m3 ha–1, the growing stock is described by tree storeys, and since NFI11, also by tree species, and in seedling stands, also by the origin of regeneration. The origin indicates whether the stand has regenerated naturally or has been artificially established (planted or sown). In the NFI, seedling stands are classified into two development classes based on the mean height of the saplings. In young seedling stands, the mean height is less than 1.3 meters, while in advanced seedling stands, it is at least 1.3 meters. In advanced seedling stands, most of the dominant trees have a diameter of less than 8 cm at breast height (1.3 m), and the largest trees are less than 10 cm in diameter (Korhonen et al. 2024b).The growing stock variables used in this study were dominant tree species, mean age, mean height, the number of crop seedlings, and the total number of seedlings. In seedling stands, these variables were assessed using 6–9 circular sample plots (radius of 2.66 m) systematically distributed around a NFI sample plot center (Korhonen et al. 2024b).
In the NFI, forest damage is assessed in sample plot stands located on forest land by tree storeys, and since NFI12 also by tree species and stand origin. The assessment included four variables (Table 1): symptom description, causal agent, age of the damage, and degree of the damage, which describes the severity of the damage in terms of its impact on growth and yield, mortality, and timber quality (Tomppo et al. 2011; Korhonen et al. 2013). The degree of damage is a stand-level variable summarizing the impact of all observed damage. Between NFI11 and NFI12, the assessment of moose damage severity was improved by introducing detailed guidelines on how different types of moose damage affect seedling vitality. This change may have influenced the assessment of the degree of moose damage.
| Table 1. Description and explanation of National Forest Inventory moose (Alces alces L.) damage variables applied in this study (Nikula et al. 2021). | ||
| Variable | Description | Additional explanation |
| Damage symptoms | Visual assessment of the injury | In case of moose damage: broken or dry top (in the upper half of the crown), technical defects on stem, other crown malformations, defoliation. |
| Degree of damage | Apparent severity of damage at the stand level which was evaluated by change in silvicultural quality of the stand, see next variable row. Damage classes 1, 2 and 3 were utilized. | 0 mild damage, symptoms observed, but the damage does not reduce the silvicultural quality of the stand; 1 intermediate, the stand quality is reduced by one class; 2 severe, the stand quality is reduced by more than one class; 3 total, artificial regeneration is required. |
| Silvicultural quality of the stand | The division was based on species composition, dominant height, even spatial distribution, density and technical quality of the dominant tree storey. | 1 good 2 satisfactory 3 adequate 4 low-productive: the yield is so low that the stand should be regenerated before maturity. |
| Age of damage | The time when the damage has started and the possible continuing effect of the cause in the stand. In this study damage age classes 0, 1 and 3 were utilized which means that there was fresh damage at inventory year. | 0 started less than two years ago; 1 started 2–5 years ago and still continuing; 2 started 2–5 years ago, but ceased; 3 started more than 5 years ago and still continuing; 4 started more than 5 years ago but ceased. |
Causal agents include the most common damaging agents in Finland and are grouped into categories such as abiotic factors, human activity, vertebrates, insects, and fungi. In Finland, browsing damage by ungulates is mainly caused by moose (Alces alces L.), but in southern Finland also by roe deer (Capreolus capreolus L.) and white-tailed deer (Odocoileus virginianus Zimmermann) (Huuskonen et al. 2020; Korhonen et al. 2021). In NFI13, moose and other ungulates were recorded separately, whereas in NFI10 they were not.
To estimate the prevalence of moose damage in Finland over time, we used all sample plots, both permanent and temporal, measured in the NFI10, NFI11, NFI12, and NFI13. For area estimation, we applied the same method as used in official NFI reporting (Tomppo et al. 2011; Korhonen et al. 2013, 2019, 2021, 2024a). The method is based on the number of sample plot centers on land and in the domain of interest (e.g., land use class, development class). The area represented by a single plot was first calculated by sampling region and by NFI round, using the land areas published by the National Land Survey of Finland in the time of each NFI. All estimations were performed using SAS Enterprise Guide. The results are presented only for forests available for wood production (FAWS), meaning that conservation areas and other protected forests were excluded. For each inventory, the data on wood production restrictions at the time of the inventory were used; they were not updated to reflect the present protection status.
For the analyses of stand development following moose damage, we included only permanent plots classified as seedling stands in NFI10, artificially regenerated with Scots pine, and remeasured in NFI13. Furthermore, only those sample plots that could be precisely located in the field in all subsequent inventories (NFI11–NFI13) were included in the analyses. The number of permanent sample plots in a seedling stand artificially regenerated (planted or sown) for Scots pine in NFI10 was 576, and 562 of these were on forest land available for wood production, according to NFI13. To ensure that the forest stand described on the center point of a plot was the same as in NFI10, forest characteristics assessed in the subsequent NFIs were compared. Due to changes in stand delineation in some sample plots, and consequently, conflicting stand characteristics, such as large discrepancies in stand age or mean height, three sample plots were excluded. As a result, the final number of sample plots was 559 (Table 2). In analyzing the influence of moose damage on stand development, only field data from NFI10 and NFI13 were used. When analyzing the persistence of previously recorded damage, we further divided the advanced seedling stands in NFI10 into two classes based on the mean height: those with the mean height of 4 m or less, and those with the mean height greater than 4 m.
| Table 2. Forest characteristics of the seedling stands that were artificially regenerated for Scots pine and recorded on permanent sample plots in the 10th National Forest Inventory (NFI10, 2004–2008), shown both for NFI10 and the remeasurement in the 13th National Forest Inventory (NFI13, 2019–2023). | ||||||
| Young seedling stands in NFI10 | ||||||
| NFI | Variable | N | Mean | Std Dev | Minimum | Maximum |
| NFI10 | Mean height, dm | 228 | 5.8 | 17.3 | 1 | 13 |
| Stand age, yr | 227 | 5.4 | 14.3 | 1 | 23 | |
| Number of seedlings, pcs ha–1 | 228 | 2335 | 4114 | 300 | 5700 | |
| Number of all seedlings, pcs ha –1 | 228 | 10 536 | 42 390 | 1000 | 81 000 | |
| NFI13 | Mean height, dm | 228 | 63.5 | 130.2 | 3 | 153 |
| Mean diameter, cm | 227 | 7.3 | 15.3 | 0 | 17 | |
| Stand age, yr | 228 | 20.4 | 30.0 | 11 | 65 | |
| Number of seedlings, pcs ha –1 | 124* | 1965 | 3066 | 350 | 3800 | |
| Number of all seedlings, pcs ha –1 | 124* | 5566 | 19 107 | 500 | 20 000 | |
| Advanced seedling stands in NFI10 | ||||||
| NFI | Variable | N | Mean | Std Dev | Minimum | Maximum |
| NFI10 | Mean height, dm | 331 | 34.4 | 68.9 | 14 | 80 |
| Stand age, yr | 331 | 15.0 | 24.2 | 5 | 36 | |
| Number of seedlings, pcs ha–1 | 331 | 1994 | 3098 | 100 | 5100 | |
| Number of all seedlings, pcs ha–1 | 331 | 8301 | 32 455 | 0 | 56 000 | |
| NFI13 | Mean height, dm | 331 | 108.3 | 110.0 | 45 | 184 |
| Mean diameter, cm | 331 | 12.8 | 12.6 | 4 | 25 | |
| Stand age, yr | 331 | 30.5 | 33.5 | 16 | 69 | |
| Number of seedlings, pcs ha–1 | 12* | 2116 | 1791 | 1700 | 3094 | |
| Number of all seedlings, pcs ha–1 | 12* | 5575 | 18 683 | 2100 | 15 450 | |
| * Number of seedlings is measured only in seedling stands. | ||||||
3 Results
3.1 Prevalence and severity of moose damage
In NFI10, moose damage was observed on 0.966 M ha, corresponding to 5.2% of the area of FAWS nationwide (Supplementary file S1). Of this affected area, 61% was classified as significantly damaged, indicating a reduction in silvicultural quality. By NFI13, the damage area had increased slightly to 1.116 M ha, or 6.1% of the FAWS. The increase was due to a larger area of mild damage, whereas the area of significant damage remained at approximately 3% of the total area of FAWS.
In the northern boreal zone, moose damage was more frequently classified as significant than in the southern and middle boreal zones (Suppl. file S1). The area of significant damage also increased from 2.7% of the FAWS in NFI10 to 3.9% in NFI13.
Most of the moose damage was observed in advanced seedling stands, 58% of the total area of moose damage in NFI10 and 39% in NFI13 (Fig. 2, Suppl. file S2). The estimated area of moose damage in both young and advanced seedling stands decreased between NFI10 and NFI13, from 173 200 ha to 140 500 ha and from 561 300 ha to 439 900 ha in the whole country, respectively (Fig. 2, Suppl. file S2). The relative area of moose damage has nevertheless remained at the same level, being 13% in young and 23% in advanced seedling stands in NFI13. Over the same period, moose damage increased in young and advanced thinning stands (Fig. 2). However, the relative area of moose damage in young thinning stands is small, 6.3% of the total area of young thinning stands in NFI13 (Fig. 2, Suppl. file S2).
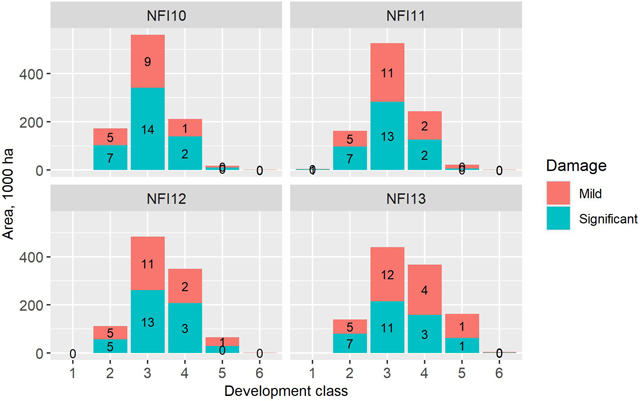
Fig. 2. Area and proportion (labels on bars, %) of moose damage by development class and damage severity in four consecutive National Forest Inventories (NFIs) conducted in Finland: NFI10 (2004–2008), NFI11 (2009–2013), NFI12 (2014–2018), and NFI13 (2019–2023). Development classes are: 1 = regeneration stand (open, seeding, or shelter stand), 2 = young seedling stand, 3 = advanced seedling stand, 4 = young thinning stand, 5 = advanced thinning stand, and 6=mature stand.
Geographically looking, the results in the northern boreal zone differed from the results in the other zones. Both the absolute and relative extent of moose damage in seedling stands increased between NFI10 and NFI13 (Fig. 3), from 14% to 19% of the total area of young seedling stands, and from 16% to 35% in advanced seedling stands, respectively (Suppl. file S2).
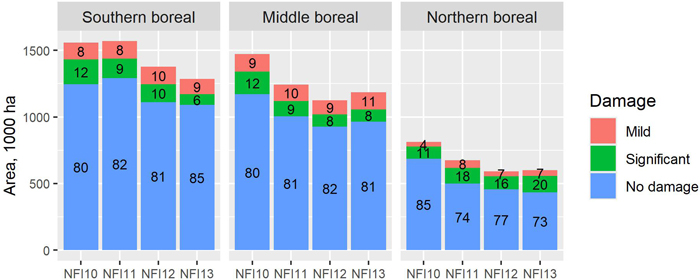
Fig. 3. Area and proportion (labels on bars, %) of moose damage in seedling stands (young and advanced) by damage severity and vegetation zone in Finland in four consecutive National Forest Inventories (NFIs): NFI10 (2004–2008), NFI11 (2009–2013), NFI12 (2014–2018), and NFI13 (2019–2023).
Moose damage was observed most frequently in Scots pine-dominated stands. Nationwide, Scots pine-dominated stands accounted for 73% of the total moose damage area in young seedling stands and 76% in advanced seedling stands in NFI10, compared with 81% and 79%, respectively, in NFI13 (Fig. 4, Suppl. file S3). Moose damage in Norway spruce and broadleaved-dominated stands was observed mainly in the southern boreal zone (Fig. 4).
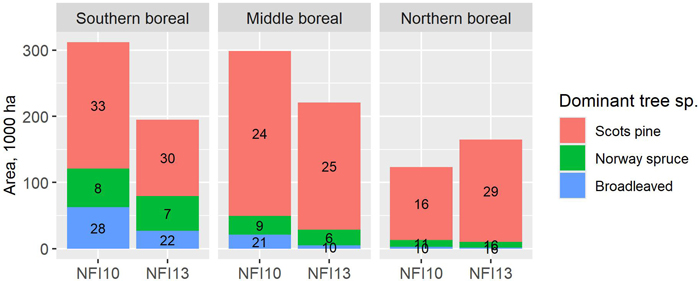
Fig. 4. Area and proportion (labels on bars, %) of moose damage in seedling stands (young and advanced) by dominant tree species and vegetation zone in Finland according to the 10th National Forest Inventory (NFI10, 2004–2008) and the 13th National Forest Inventory (NFI13, 2019–2023). Moose damage includes both mild and significant damage. Proportions were calculated as a percentage of the total area dominated by the respective tree species.
Among Scots pine-dominated seedling stands, moose damage was most frequent in the southern boreal zone, affecting 33% of the area in NFI10 and 30% in NFI13 (Fig. 4, Suppl. file S3). Significant damage accounted for 20% and 14% of the area, respectively (Suppl. file S3). In NFI13, moose damage was also common in the northern boreal zone, affecting 29% of the area of Scots pine-dominated seedling stands, while significant damage affected 21% of the total area. In the southern boreal zone, the proportion of moose damage area in broadleaved-dominated seedling stands was also relatively high, with 29% in NFI10 and 22% in NFI13 (Fig. 4, Suppl. file S3). Because moose browsing may alter tree species dominance, further analyses focused on seedling stands regenerated for Scots pine.
Moose damage was more frequent in seedling stands artificially regenerated for Scots pine (by planting or sowing) than in naturally regenerated stands, particularly at the advanced seedling stage (Fig. 5, Suppl. file S4). In NFI10, total and significant moose damage affected 37% and 25% of the area of artificially regenerated advanced seedling stands nationwide, compared with 21% and 10% of naturally regenerated stands, respectively (Suppl. file S4). In artificially regenerated advanced seedling stands, the proportions remained similar in NFI13 at the national level, but the highest occurrence shifted from the southern boreal zone (44% total and 30% significant damage in NFI10) to the northern boreal zone (40% and 30%, respectively).
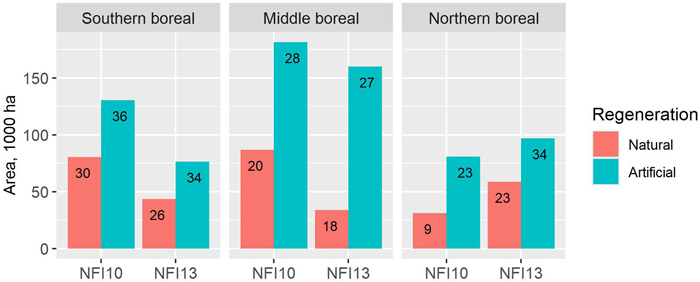
Fig. 5. Area and proportion (labels on bars, %) of moose damage in seedling stands regenerated for Scots pine, by regeneration method and vegetation zone in Finland, according to the 10th National Forest Inventory (NFI10, 2004–2008) and the 13th National Forest Inventory (NFI13, 2019–2023). Moose damage includes both mild and significant damage, and seedling stands comprise both young and advanced seedling stands. Proportions were calculated as a percentage of the total area of Scots pine seedling stands regenerated using each method.
3.2 Impact of moose browsing damage on the development of seedling stands regenerated for Scots pine
Over the fifteen years between NFI10 and NFI13, most young seedling stands artificially regenerated for Scots pine had developed into advanced seedling stands (57% of the area) or further into young thinning stands (37%). Among advanced seedling stands, 90% of the area had progressed to the young thinning stage, in which most trees exceed 8 cm in diameter and the stand has reached the first-thinning phase (Table 2).
According to NFI13, recent moose damage (0–5 years old, or older than 5 years with ongoing browsing) was observed on 16% of the total area of young seedling stands recorded in NFI10 (Fig. 6, Suppl. file S5). Recent moose damage was more common in stands where no damage had been observed in NFI10 (18% of the area). In contrast, among stands with moose damage recorded in NFI10, damage was either not recorded in NFI13 (61% of the area) or was not identified as moose damage, although typical symptoms such as stem defects and broken treetops or branches were observed (7% of the area). Together, the two inventories indicate that moose have affected at least 44% of the total area of young seedling stands artificially regenerated with Scots pine nationwide (Suppl. file S5). The highest proportion was observed in the southern boreal zone, where moose damage was recorded in either inventory on 50% of the area (Suppl. file S5).
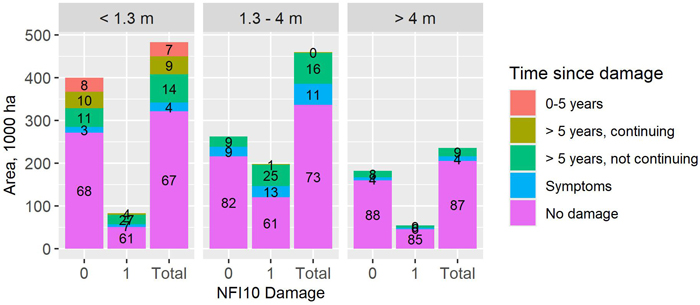
Fig. 6. Area and proportion (labels on bars, %) of moose damage in the 13th National Forest Inventory (NFI13, 2019–2023) in seedling stands artificially regenerated for Scots pine, by development class (young seedling stand, mean height < 1.3 m; advanced seedling stand, mean height 1.3–4 m; and advanced seedling stand, mean height > 4 m), damage class in the 10th National Forest Inventory (NFI10, 2004–2008) (0 = no moose damage observed, 1 = moose damage, Total = all stands), and time since moose damage recorded in NFI13.
In stands classified as advanced seedling stands in NFI10, all moose damage observed in NFI13 was old (over 5 years old, not continuing), except for a small area of ongoing damage observed in the same stands as in NFI10 (Fig. 6, Suppl. file S5). The proportion of old damage was greater in advanced seedling stands with a mean height of 4 meters or less in NFI10 (16% of the area) than taller stands (9%). In many advanced seedling stands where moose damage had been observed in NFI10, no moose damage was recorded in NFI13, either because symptoms of earlier browsing were no longer visible or were not identified as moose damage. For example, in stands with mean height of 4 m or less at the time of NFI10, typical symptoms of moose damage were observed in NFI13, but the damaging agent was unidentified on 13% of the area with moose damage recorded in NFI10. Overall, according to the two inventories, moose had affected 53% of the area of advanced seedling stands up to 4 m in height in NFI10 and 32% of the area of taller stands.
Changes in tree species dominance were more frequent in seedling stands artificially regenerated for Scots pine, where moose damage was observed in NFI10 (Suppl. file S6). In young seedling stands with recorded moose damage in NFI10, tree species other than Scots pine dominated 19% of the area, compared with 6% in stands without moose damage across the country. The proportion was highest in the southern boreal zone, where species other than Scots pine dominated 29% of the area affected by moose damage. By NFI13, tree species other than Scots pine dominated 23% of the area with recorded moose damage in NFI10, compared with 10% of the area without recorded damage (Suppl. file S6). In the southern boreal zone, the proportion increased to 39% in stands where moose damage had been observed in NFI10. It should be noted that factors other than moose browsing may also influence changes in tree species dominance.
In advanced seedling stands in NFI10, no such difference was observed between stands with and without recorded moose damage. The proportion of the total area with a change in the dominant tree species was 12% nationwide (Suppl. file S6). By NFI13, this proportion had increased to 14%, with the highest regional value observed in the southern boreal zone (20%). In both young and advanced seedling stands, the dominant tree species most frequently changed from Scots pine to downy birch (Betula pubescens Ehrh.) (5.3% of the area), followed by Norway spruce (4.0%) by NFI13 (Suppl. file S6). In the southern boreal zone, the most common shift was from Scots pine to silver birch (9.1% of the area).
Moose damage affected the number of crop seedlings, that is, seedlings grown for future growing stock, in both young and advanced seedling stands (Table 3). In general, the number of crop seedlings also remained lower in NFI13 in young seedling stands where notable or severe moose damage had been recorded in NFI10 than in stands without recorded damage (Fig. 7). Moose damage classified as mild in NFI10 had no such effect on the number of crop seedlings (Fig. 7, Table 3).
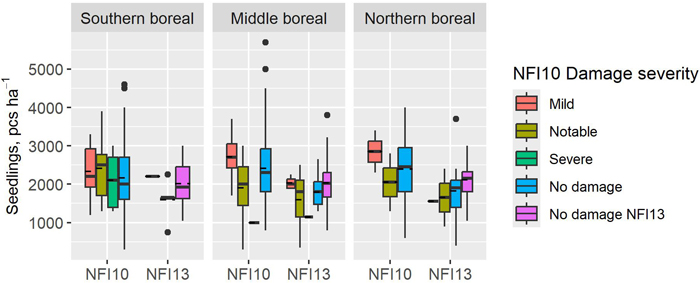
Fig. 7. Number of crop seedlings in young seedling stands, artificially regenerated for Scots pine, by damage severity class in the 10th National Forest Inventory (NFI10) and by vegetation zone in Finland, measured in NFI10 (2004–2008) and remeasured in the 13th National Forest Inventory (NFI13, 2019–2023). “No damage NFI13” denotes stands with no recorded moose damage in either NFI10 or NFI13. Boxes indicate the interquartile range, whiskers the range, dashed horizontal lines the mean, and solid lines within boxes the median.
| Table 3. Mean number of seedlings in seedling stands artificially regenerated for Scots pine in the 10th National Forest Inventory (NFI10, 2004–2008), measured in NFI10 and remeasured in the 13th National Forest Inventory (NFI13, 2019–2023), classified by moose damage severity recorded in NFI10 and vegetation zone in Finland. | |||||
| Young seedling stands in NFI10 | |||||
| Vegetation zone | Damage severity in NFI10 | Number of seedlings in NFI10, pcs ha–1 | Number of seedlings in NFI13, pcs ha–1 | ||
| Crop seedlings | All seedlings | Crop seedlings | All seedlings | ||
| Southern | Mild | 2296 | 14 913 | - | - |
| Notable | 2530 | 10 381 | 2200 | 2700 | |
| Severe | 2028 | 10 094 | - | - | |
| No damage | 2165 | 9919 | 1914 | 5648 | |
| Middle | Mild | 2688 | 21 682 | 2031 | 5181 |
| Notable | 1891 | 13 625 | 1593 | 8314 | |
| Severe | 1000 | 2000 | 1150 | 1250 | |
| No damage | 2407 | 11 695 | 1967 | 5596 | |
| Northern | Mild | 2850 | 5500 | 1550 | 1550 |
| Notable | 2050 | 6000 | 1650 | 2500 | |
| Severe | - | - | - | - | |
| No damage | 2439 | 7496 | 2070 | 5588 | |
| Advanced seedling stand in NFI10 | |||||
| Southern | Mild | 1952 | 9144 | - | - |
| Notable | 2078 | 10 292 | - | - | |
| Severe | 1622 | 11 282 | - | - | |
| No damage | 2156 | 10 227 | 2535 | 10 219 | |
| Middle | Mild | 2141 | 8475 | - | - |
| Notable | 1974 | 8750 | 2019 | 3675 | |
| Severe | 1616 | 6419 | - | - | |
| No damage | 2124 | 7460 | 2051 | 5172 | |
| Northern | Mild | 2175 | 6750 | - | - |
| Notable | 1733 | 15 333 | - | - | |
| Severe | 1000 | 2500 | - | - | |
| No damage | 1678 | 5746 | - | - | |
Overall, both mean height and mean diameter in NFI13 were lowest in young seedling stands where no moose damage had been observed in NFI10 but was recorded in NFI13 (Table 4, Fig. 8 and Fig. 9). The mean height of these stands was also the lowest in NFI10 (Table 4). Among stands without observed moose damage in NFI10, the increase in mean height was notably greater in stands that remained undamaged in NFI13 than in those where moose damage was observed in NFI13 (Fig. 8). For example, in the northern boreal zone, the increase was 44 and 32 dm, respectively (Table 4).
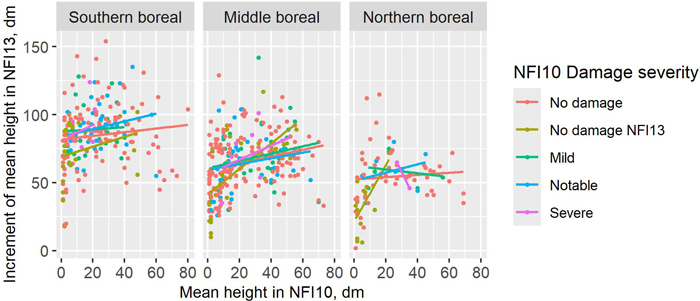
Fig. 8. Increment of mean height of the growing stock between the 10th National Forest Inventory (NFI10, 2004–2008) and the 13th National Forest Inventory (NFI13, 2019–2023) in seedling stands artificially regenerated for Scots pine, classified by moose damage severity in NFI10 and vegetation zone in Finland. “No damage NFI13” denotes stands with no moose damage in either NFI10 or NFI13. Lines represent linear regression fits.
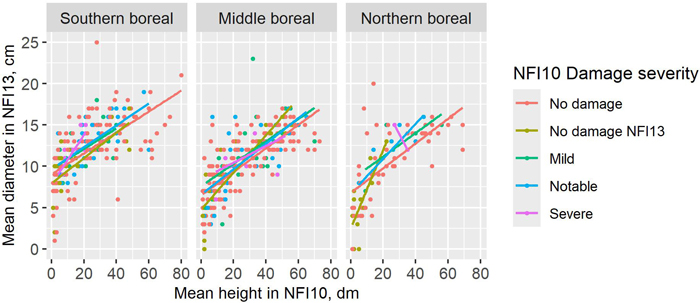
Fig. 9. Mean diameter of seedling stands, artificially regenerated for Scots pine, by damage severity class in the 10th National Forest Inventory (NFI10) and vegetation zone in Finland, measured in NFI10 (2004–2008) and remeasured in the 13th National Forest Inventory (NFI13, 2019–2023). “No damage NFI13” denotes stands with no recorded moose damage in either NFI10 or NFI13. Lines represent linear regression fits.
| Table 4. Mean height and diameter of seedling stands artificially regenerated for Scots pine in the 10th National Forest Inventory (NFI10, 2004–2008), measured in NFI10 and remeasured in the 13th National Forest Inventory (NFI13, 2019–2023), classified by moose damage severity in NFI10, the occurrence of moose damage in NFI13, and vegetation zone in Finland. NFI13 = 0 indicates that no moose damage was recorded in NFI13, whereas NFI13 = 1 indicates that moose damage was recorded in NFI13. | |||||||
| Young seedling stand in NFI10 | |||||||
| Vegetation zone | Damage severity in NFI10 | Mean height in NFI10, dm | Mean height in NFI13, dm | Mean diameter in NFI13, cm | |||
| NFI13 = 0 | NFI13 = 1 | NFI13 = 0 | NFI13 = 1 | NFI13 = 0 | NFI13 = 1 | ||
| Southern | Mild | 8.2 | 7.2 | 99.3 | 85.8 | 10.1 | 11.6 |
| Notable | 7.8 | 7.0 | 87.1 | 88.0 | 9.6 | 11.0 | |
| Severe | 6.0 | 10.5 | 93.1 | 92.5 | 9.1 | 12.0 | |
| No damage | 4.9 | 3.9 | 81.1 | 73.2 | 8.8 | 8.4 | |
| Middle | Mild | 8.7 | 11.7 | 58.9 | 81.3 | 7.0 | 10.0 |
| Notable | 7.7 | 5.5 | 58.1 | 68.3 | 5.9 | 9.1 | |
| Severe | 9.0 | - | 44.0 | - | 6.0 | - | |
| No damage | 5.9 | 5.5 | 65.7 | 51.4 | 7.1 | 5.9 | |
| Northern | Mild | 11.0 | - | 63.0 | - | 8.0 | - |
| Notable | 7.0 | 5.0 | 42.0 | 60.0 | 5.0 | 8.0 | |
| Severe | - | - | - | - | - | - | |
| No damage | 5.1 | 5.1 | 48.8 | 37.1 | 6.3 | 5.1 | |
| Advanced seedling stand in NFI10 | |||||||
| Southern | Mild | 31.4 | 24.0 | 122.3 | 109.0 | 13.8 | 12.1 |
| Notable | 28.2 | 33.4 | 119.8 | 133.3 | 13.3 | 15.1 | |
| Severe | 18.8 | 17.9 | 125.2 | 104.8 | 13.8 | 12.8 | |
| No damage | 36.1 | 36.7 | 124.9 | 117.6 | 13.9 | 13.3 | |
| Middle | Mild | 36.8 | 32.2 | 107.8 | 104.4 | 13.0 | 12.0 |
| Notable | 37.3 | 25.7 | 108.8 | 91.3 | 12.7 | 10.5 | |
| Severe | 29.9 | 22.0 | 103.6 | 89.0 | 11.5 | 13.0 | |
| No damage | 36.3 | 36.2 | 105.4 | 115.6 | 11.9 | 13.3 | |
| Northern | Mild | 35.0 | - | 97.0 | - | 14.3 | - |
| Notable | 33.2 | 14.0 | 95.8 | 80.0 | 13.8 | 12.0 | |
| Severe | 31.0 | - | 86.5 | - | 13.5 | - | |
| No damage | 36.4 | 22.0 | 94.9 | 94.0 | 12.9 | 13.0 | |
In advanced seedling stands, the impact of moose damage on the development of the growing stock was more evident in mean height than in mean diameter (Table 4). In NFI13, mean height was lowest in stands where severe moose damage had been observed in NFI10, and these stands also had the lowest mean height in NFI10 (Table 4). For example, in the southern boreal zone, the mean height was 18 dm in severely damaged stands, compared with 36 dm in stands without observed moose damage in NFI10. Across most NFI10 damage-severity classes, mean height in NFI13 was lower in stands where moose damage was observed in NFI13 than in those without damage (Table 4). For example, in the southern boreal zone, mean heights in the “No damage in NFI10” class were 118 and 125 dm, respectively.
Because mean diameter was not measured in seedling stands in NFI10, only differences in NFI13 could be compared (Fig. 9). Among stands without observed moose damage in NFI10, mean diameter was generally lower in stands where moose damage was observed in NFI13 than in those that remained undamaged (Fig. 9, Table 4). The middle boreal zone was an exception, with mean diameters of 13.3 and 11.9 cm, respectively. The interpretation of effects of moose damage on mean diameter and mean height is complicated by the fact that most seedling stands had undergone cleaning or pre-commercial thinning after the NFI10 field measurements. According to NFI13, thinning or another management operation had been carried out during the preceding 10 years on 72% of the area with moose damage and on 55% of the undamaged area in young seedling stands (at the time of NFI10). In advanced seedling stands, thinning had been conducted on 46% of the area with moose damage and on 36% of the undamaged area. Furthermore, factors other than moose damage, such as other damaging agents and site fertility, may also have influenced stand growth.
4 Discussion
4.1 Effect of moose population fluctuations on damage
Moose browsing damage was observed on a notable portion of forest land, with most of the affected area classified as significantly damaged, indicating reduced silvicultural quality. Between NFI10 and NFI13, the total area of moose damage increased slightly, primarily due to a rise in mild damage, while the extent of significant damage remained stable at the national level.
Regional differences were evident, particularly in the northern boreal zone, where a higher proportion of damage was classified as significant. In this zone, both the absolute and relative areas of significant damage increased over time.
Damage was most frequently observed in advanced seedling stands, although its share declined between inventories. Conversely, damage in young and advanced thinning stands increased, though the relative area affected in young thinning stands remained small. The increase of damage in the thinning stands is probably due to recent observations that moose cause damage to larger stems by debarking (Matala et al. 2025).
Compared with earlier studies (Nevalainen et al. 2016), the proportion of moose damage was slightly higher in the 2000s and 2010s than in the 1990s. The moose population was relatively low in the mid-1990s, which probably reflects in the smaller amount of damage. In the early 2000s, the moose population reached an all-time high of approximately 140 000 individuals, which was also reflected in increased moose damage. Since then, the moose population has roughly halved in Southern and Central Finland, while the change has been smaller in Northern Finland (Fig. 1). However, at the same time, the area of seedling stands has decreased in all areas (Fig. 3), which probably explains partly why the amount of moose damage has remained at quite the same level as when the moose population was higher.
Studies on local and regional factors influencing moose browsing suggest that forage consumption by moose is proportional to the availability of different plant species and therefore varies between regions (Hörnberg 2001a). At the regional scale, the extent of moose damage has been shown to fluctuate with changes in population density, although the damage is not directly proportional to population size (Hörnberg 2001b; Månsson 2009). This is probably explained by the variation of food and other resources for moose from one region to another. Indeed, Nikula et al. (2020) found that in addition to moose population density, moose damage was best explained by total forest area, proportions of plantations and mature forests. Furthermore, the relationship of Scots pine and broadleaved seedling stands to moose number predicts the area of moose damage (Nikula et al. 2020).
4.2 Damage effects on stand development
Our results indicate that moose browsing in forest seedling stands has long-term effects on both the development of individual trees and the tree species composition of stands. Areas where moose browse and cause damage tend to shift as forest succession proceeds. This was evident in our results: according to NFI13, recent moose damage was observed in a significant proportion of stands that had been young seedlings stands at the time of NFI10, particularly in those that were undamaged in NFI10. In some of the stands that had shown damage in NFI10, no identifiable signs of moose damage were observed in NFI13, although in some cases, residual indicators such as stem defects and broken branches were still present. Overall, moose damage was observed in 44% of the area of the young seedling stands regenerated for Scots pine, as recorded in NFI10, with the highest proportion of damaged stands found in the southern boreal zone.
In advanced seedling stands at the time of NFI10, nearly all moose damage recorded in NFI13 was old, with only a small proportion showing ongoing damage in the same stands as in NFI10. In many of those stands that were damaged by moose in the NFI10 measurement, the symptoms were no longer visible or were not attributed to moose in NFI13. According to NFI13, just under half of the advanced seedling stands up to 4 meters tall at the time of NFI10 remained unaffected by moose damage, while nearly 70% of taller stands showed no signs of damage. However, it should be noted that the proportions of affected area could be higher, given that field data of the intermediate inventories (NFI11 and NFI12) were not included.
The results revealed that changes in dominant tree species were frequent, especially in small seedling stands with observed moose damage. Species other than Scots pine dominated 19% of the damaged area in NFI10 and 23% by NFI13. Scots pine had most often been replaced by downy birch or, in the southern boreal zone, by silver birch and Norway spruce. Changes in dominant tree species are likely influenced by both moose browsing and stand management. In moose winter ranges, browsing pressure may cause severe damage, resulting in the loss of most Scots pine seedlings and the recruitment of birches or Norway spruce as crop trees. At the same time, silvicultural treatments were carried out more frequently in damaged stands than in stands without moose damage. During cleaning or thinning operations, naturally regenerated silver birch or Norway spruce may be favored over browsed, low-quality Scots pine seedlings.
The impact of moose damage on stand growth was not as straightforward as might be expected, since stand growth is affected by various interacting factors beyond browsing, including site conditions and management practices. Silvicultural measures often involve removing damaged or poor-quality Scots pine trees affected by moose browsing. According to NFI13, stands affected by moose had undergone silvicultural treatments more often than stands without damage. Furthermore, a shift in the dominant tree species or species composition, as a consequence of browsing, may affect height growth. Site fertility affects stand growth, but it could not be included in the analysis due to the limited number of sample plots.
The results showed that young seedling stands unaffected by moose damage in NFI10 were the shortest in height, and if moose damage was recorded in NFI13, those stands also remained the shortest in NFI13. In the case of advanced seedling stands, those without moose damage in NFI10 were the tallest. Stands in which damage was recorded later in NFI13 were already shorter at the time of NFI10 and generally remained shorter in NFI13 compared to undamaged stands.
As a conclusion, the comparison between NFI10 and NFI13 indicates that while moose damage remains a concern in young and advanced seedling stands, a significant portion of these stands – especially those with taller trees – have remained undamaged. Damage patterns vary by region and stand characteristics, with signs of recovery or reduced impact in many previously affected stands. However, long term experiments have shown that some of the damage will be overgrown and hidden in trunk and thus comes revealed as economic losses only after logs are sawn to timber (Matala et al. 2020). The findings of Komonen et al. (2020) highlight the need for integrated forest and wildlife management in boreal ecosystems, where cervid herbivory – particularly by moose – has significant ecological consequences. High browsing pressure can hinder the regeneration of key tree species such as Scots pine and silver birch, which are both economically and ecologically important. This selective feeding behavior can lead to reduced tree species diversity and simplified forest structures, ultimately altering successional pathways and ecosystem functions.
To address these challenges, forest and wildlife management must consider the balance between moose populations and forest regeneration capacity. This involves setting population targets that align with sustainable forestry goals and applying protective measures in vulnerable stands. The impacts of browsing are context-dependent, varying by region, forest type, and stand structure, which underscores the importance of site-specific management strategies.
4.3 NFI data in studying browsing damage
The sample size of NFI permanent plots is relatively low considering that moose damage are clustered. Local phenomena are not well captured with extensive NFI type of sampling (Ruuhola et al. 2016; Wam et al. 2021). Specifically, in areas with high moose population densities, this may lead to underestimation of the damaged area. However, for large scale studies NFI gives a reliable estimate of damage (e.g. Nevalainen et al. 2016). In NFI, moose browsing damage is assessed on selected crop seedlings of Scots pine, Norway spruce and birches, which represent only a subset of the browsable trees and biomass available to moose. Thus, the effect of stand structure on browsing can only partially be assessed. Despite these limitations, NFI data can still be used to assess changes in tree species composition, especially among commercial tree species, as well as stand structure and forest development over time.
The use of permanent sample plots facilitates the assessment of stand development at the level of individual stands over time. The approach applied in this study enabled the investigation of the long-term effects of moose browsing on seedling stand development, stand structure, and dominant tree species composition, and allowed for the assessment of stand recovery following moose damage. Disturbance effects and recovery processes following other types of forest disturbances, besides moose browsing, could be analyzed in a similar manner. Furthermore, repeated measurements on permanent sample plots provide a means to monitor and assess the effects of, for example, novel or alternative forest management practices on stand structure and development.
4.4 Damage and adaptation to changing climatic condition
In a changing climate, the stand density of growing Scots pine trees is of particularly importance for carbon sequestration. Our results indicated a reduction in crop seedling density due to moose browsing. A decrease in stand density has been shown to significantly affect the potential for carbon sequestration (Bianchi et al. 2024). Thus, moose browsing resulting in lower stand density in the juvenile stage is also a risk from a carbon sequestration perspective. Regarding adaptation to climate change, it is recommended to increase tree species diversity, with greater emphasis on the cultivation of deciduous trees on fertile sites, despite the presence of Norway spruce monocultures over large areas. Furthermore, deciduous trees are also susceptible to browsing by cervids. As the climate undergoes changes, Norway spruce trees in southern Finland are likely to experience increased risk of drought, which in turn will increase the likelihood of subsequent damage. In the past, Norway spruce has been established even on suboptimal, too dry sites to avoid the high risk of moose browsing damage. In addition, our results showed that moose damage can also change tree species dominance from Scots pine to Norway spruce. It is anticipated that the risk of drought at these locations will increase in the future. In the context of a changing climate, it is imperative to consider the diverse objectives associated with forest and wildlife management to ensure both mitigation and adaptation to climate change.
5 Conclusions
Our findings show that moose browsing has long-term effects on dominant tree species composition and stand structure, including mean height, mean diameter, and growing stock density. Damage patterns varied by region and stand characteristics, with signs of recovery or reduced impacts observed in many previously affected stands.
Large-scale forest monitoring systems such as NFIs provide valuable data for detecting changes in browsing intensity and vegetation over time. Long-term monitoring data can inform adaptive forest and wildlife management to mitigate the negative impacts of cervid herbivory while maintaining biodiversity and forest productivity under changing conditions.
Acknowledgements
We would like to thank the NFI field teams and staff members who have contributed to data collection, supervision, and data management over the years. Without the cumulative efforts of numerous individuals across successive inventory cycles, this study would not have been possible.
Declaration of openness of research materials and data
Data are available for scientific purposes with specific agreement with Natural Research Institute Finland (Luke). Access to the plot location data is limited to protect the monitoring system based on revisited permanent plots.
Authors’ contributions
Conceptualization (KTK, SH, HH, MR), methodology (all), formal analyses (HH), interpretation of results (all), visualization (HH, AN), writing – original draft (HH, JM, SH), writing – review and editing (all authors), administration and resources (SH, KTK, MR).
Declaration of generative AI and AI-assisted technologies in the writing process
During the final stages of preparing this article, authors used Microsoft Copilot to check grammar and spelling. After using this tool, the authors reviewed and edited the content as needed and assume full responsibility for the article’s content.
Funding
This study was partly supported by the Ministry of Agriculture and Forestry in Finland (Meka 2.0, Grant number VN/10860/2023-MMM-2), and conducted (HH, KTK, and MR) under Research Council of Finland flagship ecosystem for Forest-Human-Machine Interplay – Building Resilience, Redefining Value Networks and Enabling Meaningful Experiences (UNITE, Grant number 374281 and 359174).
References
Bergqvist G, Bergström R, Edenius L (2003) Effects of moose (Alces alces) rebrowsing on damage development in young stands of Scots pine (Pinus sylvestris). For Ecol Manag 176: 397–403. https://doi.org/10.1016/S0378-1127(02)00288-8.
Bergström R, Hjeljord O (1987) Moose and vegetation interactions in northwestern Europe and Poland. Swedish Wildl Res 1: 213–228.
Bianchi S, Huuskonen S, Hynynen J, Niemistö P (2024) Comparing wood production and carbon sequestration after extreme thinnings in boreal Scots pine stands. For Ecol Manag 553, article id 121641. https://doi.org/10.1016/j.foreco.2023.121641.
Brock C, Morera-Pujol V, Murphy KJ, Nieuwenhuis M, Ciuti S (2023) Predicting forest damage using relative abundance of multiple deer species and national forest inventory data. For Ecol Manag 550, article id 121506. https://doi.org/10.1016/j.foreco.2023.121506.
Cederlund G, Markgren G (1987) The development of the Swedish moose population, 1970–1983. Swedish Wildl Res 1: 55–62.
Corcoran F, Devaney J, Morera-Pujol V, Ciuti S (2026) National forest inventory data reveals differential impacts of deer species on plant growth forms. For Ecol Manag 619, article id 124104. https://doi.org/10.1016/j.foreco.2026.124104.
Côté SD, Rooney TP, Tremblay J P, Dussault C, Waller DM (2004)Ecological impacts of deer overabundance. Annu. Rev Ecol Evol Syst 35: 113–147. https://doi.org/10.1146/annurev.ecolsys.35.021103.105725.
Díaz-Yáñez O, Mola-Yudego B, González-Olabarria JR (2017) What variables make a forest stand vulnerable to browsing damage occurrence? Silva Fenn 51, article id 1693. https://doi.org/10.14214/sf.1693.
Graf L, Bohlin I, Hedwall P-O, Dahlgren J, Felton AM (2026) Mapping cervid forage in Sweden using remote sensing and national forest inventory data. Int J Appl Earth Obs Geoinf 144, article id 104850. https://doi.org/10.1016/j.jag.2025.104850.
Hannertz M, Ekström H (2023) Nordic Forest Statistics 2023: resources, industry, trade, prices, environment and climate. Nordic Forest Research (SNS) secretariat, SLU Alnarp, Lomma, Sweden. https://nordicforestresearch.org/wp-content/uploads/2023/04/Nordisk-skogsstatistik-2023-mindre.pdf. Accessed 13 June 2024.
Hjeljord O, Grønvold S (1988) Glyphosate application in forest—ecological aspects: VI. Browsing by moose (Alces alces) in relation to chemical and mechanical brush control. Scand J For Res 3: 115–121. https://doi.org/10.1080/02827588809382501.
Hörnberg S (2001a) The relationship between moose (Alces alces) browsing utilisation and the occurrence of different forage species in Sweden. For Ecol Manag 149: 91–102. https://doi.org/10.1016/S0378-1127(00)00547-8.
Hörnberg S (2001b) Changes in population density of moose (Alces alces) and damage to forests in Sweden. For Ecol Manag 149: 141–151. https://doi.org/10.1016/S0378-1127(00)00551-X.
Huuskonen S, Domisch T, Finér L, Hantula J, Hynynen J, Matala J, Miina J, Neuvonen S, Nevalainen S, Niemistö P, Nikula A, Piri T, Siitonen J, Smolander A, Tonteri T, Uotila K, Viiri H (2020) What is the potential for replacing monocultures with mixed-species stands to enhance ecosystem services in boreal forests in Fennoscandia? For Ecol Manag 479, article id 118558. https://doi.org/10.1016/j.foreco.2020.118558.
Komonen A, Paananen E, Elo M, Valkonen S (2020) Browsing hinders the regeneration of broadleaved trees in uneven-aged forest management in southern Finland. Scand J For Res 35: 134–138. https://doi.org/10.1080/02827581.2020.1761443.
Korhonen KT, Ihalainen A, Viiri H, Heikkinen J, Hotanen J-P, Mäkelä H, Nevalainen S, Pitkänen J (2013) Suomen metsät 2004–2008 ja niiden kehitys 1921–2008. [Forests of Finland 2004–2008 and their development in 1921–2008]. Metsätieteen aikakauskirja 3/2013: 269–608. https://doi.org/10.14214/ma.6025.
Korhonen KT, Ihalainen A, Ahola A, Heikkinen J, Henttonen HM, Hotanen J-P, Nevalainen S, Pitkänen J, Strandström M, Viiri H (2017) Suomen metsät 2009–2013 ja niiden kehitys 1921–2013. [Forests of Finland 2008–2013 and their development in 1921–2013]. Natural Resources Institute Finland (Luke), Natural resources and bioeconomy studies 59/2017. http://urn.fi/URN:ISBN:978-952-326-467-0.
Korhonen KT, Ahola A, Heikkinen J, Henttonen HM, Hotanen J-P, Ihalainen A, Melin M, Pitkänen J, Räty M, Sirviö M, Strandström M (2021) Forests of Finland 2014–2018 and their development 1921–2018. Silva Fenn 55, article id 10662. https://doi.org/10.14214/sf.10662.
Korhonen KT, Räty M, Haakana H, Heikkinen J, Hotanen J-P, Kuronen M, Pitkänen J (2024a) Forests of Finland 2019–2023 and their development 1921–2023. Silva Fenn 58, article id 24045. https://doi.org/10.14214/sf.24045.
Korhonen KT, Räty M, Haakana H, Heikkinen J, Hotanen J-P, Kuronen M, Pitkänen J (2024b). Forests of Finland 2019–2023 and their development 1921–2023. Supplement file S3: 13th National Forest Inventory of Finland (NFI13) – Field manual. Silva Fenn 58, article id 24045. https://doi.org/10.14214/sf.24045.
Lavsund S (1987) Moose relationship to forestry in Finland, Norway and Sweden. Swedish Wildl Res 1: 229–244.
Lavsund S, Nygrén T, Solberg EJ (2003) Status of moose populations and challenges to moose management in Fennoscandia. Alces 39: 109–130.
Luke (Natural Resources Institute Finland) (2024) Statistics database. [Choose: Statistics database / Forest statistics / Structure and production / Silvicultural and forest improvement work / Seed and seedling statistics / Number of domestic seedlings delivered for planting (1000 seedlings) 1966-]. https://statdb.luke.fi/PxWeb/pxweb/en/LUKE/LUKE__met__methoi__20%20Siemen-%20ja%20taimitilastot/12_Istutukseen_toimitetut_kotim_taimet.px/. Accessed 23 October 2026.
Månsson J (2009) Environmental variation and moose Alces alces density as determinants of spatio-temporal heterogeneity in browsing. Ecography 32: 601–612. https://doi.org/10.1111/j.1600-0587.2009.05713.x.
Markgren G (1974) The moose in Fennoscandia. Le Naturaliste Canadien 101: 185–194.
Matala J, Kilpeläinen H, Heräjärvi H, Wall T, Verkasalo E (2020) Sawlog quality and tree dimensions of Scots pine 34 years after artificial moose browsing damage. Silva Fenn 54, article id 10389. https://doi.org/10.14214/sf.10389.
Matala J, Härkönen M, Korhonen KT (2025) Hirvieläintuhotilanne 2024. [Cervid damage 2024]. In: Sutela S, Ylioja T (eds) Metsätuhot vuonna 2024. Luonnonvarakeskus (Luke), Helsinki. Luonnonvara- ja biotalouden tutkimus 25/2025: 24‒27. https://urn.fi/URN:ISBN:978-952-419-045-9.
Nevalainen S, Matala J, Korhonen KT, Ihalainen A, Nikula A (2016) Moose damage in National Forest Inventories (1986–2008) in Finland. Silva Fenn 50, article id 1410. https://doi.org/10.14214/sf.1410.
Nikula A, Matala J, Hallikainen V, Pusenius J, Ihalainen A, Kukko T, Korhonen KT (2021) Modelling the effect of moose Alces alces population density and regional forest structure on the amount of damage in forest seedling stands. Pest Manag Sci 77: 620–627. https://doi.org/10.1002/ps.6081.
Nygrén T (1987) The history of moose in Finland. Swedish Wildl Res 1: 49–54.
Peltola A, Vaahtera E (2022) Metsien hoito. [Silviculture]. In: Vaahtera E (ed) Metsätilastollinen vuosikirja 2022. [Finnish Statistical Yearbook of Forestry 2022]. Natural Recourses Institute Finland (Luke), Helsinki, pp 59–76. http://urn.fi/URN:ISBN:978-952-380-584-2.
Pusenius J, Ruha L, Kukko T, Högmander H (2024) Hirvikannan seuranta Suomessa: menetelmä ja kannan kehitys tällä vuosituhannella. [Moose census in Finland: methodology and population development during this millenia]. Luonnonvarakeskus, Helsinki, Luonnonvara- ja biotalouden tutkimus 14/2024. http://urn.fi/URN:ISBN:978-952-380-880-5.
Rooney TP, Waller DM (2003) Direct and indirect effects of white-tailed deer in forest ecosystems. For Ecol Manag 181: 165–176. https://doi.org/10.1016/S0378-1127(03)00130-0.
Ruuhola T, Nikula A, Vesa N, Nevalainen S, Matala J (2016) Effects of bedrock and surficial deposit composition on moose damage in young forest stands in Finnish Lapland. Silva Fenn 50, article id 1565. https://doi.org/10.14214/sf.1565.
Tomppo E, Joensuu J (2003) Hirvieläinten aiheuttamat metsätuhot Etelä-Suomessa Valtakunnan metsien 8. ja 9. inventoinnin mukaan. [Forest damage by cervids in South-Finland based on 8th and 9th National Forest Inventories]. Metsätieteen aikakauskirja 4/2003: 507–535. https://doi.org/10.14214/ma.6114.
Tomppo E, Heikkinen J, Henttonen HM, Ihalainen A, Katila M, Mäkelä H, Tuomainen T, Vainikainen N (2011) Designing and conducting a forest inventory – case: 9th National Forest Inventory of Finland. Manag For Ecosyst 22, Springer Dordrecht. https://doi.org/10.1007/978-94-007-1652-0.
Viiri H (2007) Syökö hirvi metsänuudistamisen monimuotoisuuden? [Does the moose browse the diversity of tree species in forest regeneration?]. Metsätieteen aikakauskirja 2/2007: 133–136. https://doi.org/10.14214/ma.6704.
Wallgren M, Bergquist J, Bergström R, Eriksson S (2014) Effects of timing, duration, and intensity of simulated browsing on Scots pine growth and stem quality. Scand J For Res 29: 734–746. https://doi.org/10.1080/02827581.2014.960896.
Wam HK, Solberg EJ, Eriksen R, Granhus A (2021) Monitoring deer food and browsing in forests: coherence and discrepancies between national and local inventories. Ecol Indic 120, article id 106967. https://doi.org/10.1016/j.ecolind.2020.106967.
Total of 39 references.

