Eric R. Labelle  ,
Linus Huß
,
Linus Huß
Creation of value through a harvester on-board bucking optimization system operated in a spruce stand
Labelle E. R., Huß L. (2018). Creation of value through a harvester on-board bucking optimization system operated in a spruce stand. Silva Fennica vol. 52 no. 3 article id 9947. https://doi.org/10.14214/sf.9947
Highlights
- Use of harvester on-board computer bucking optimization remains highly under-utilized in German forestry
- Revenue per tree and harvesting productivity were both statistically higher with automatic bucking as compared to quality bucking during a thinning operation in a spruce dominated stand.
Abstract
Tree bucking, defined as the process in which a stem is segmented into shorter logs of varying lengths, has a significant effect on the value adding potential of a forest enterprise. Because of its importance in terms of correct product and length combinations, improper bucking can lead to financial losses. In this study, two treatments (OFF: quality bucking performed by the operator while using hot keys and ON: automatic bucking using the optimized suggestions from the harvester on-board computer; OBC) were tested in a Norway spruce (Picea abies [L.] Karst.) dominated stand located in Germany. Both treatments had the aim to maximize the value of a stem. The research took place in an 80-year old spruce and beech stand under a regenerative cutting. Fully-mechanized harvesting was performed with an 8-wheel Ponsse Bear single-grip harvester equipped with a H8 harvesting head. Results indicated that the product recovery of the two treatments differed by 4% in undamaged trees (no broken tree-tops or stems) to the benefit of manual bucking. However, the revenue of trees subjected to optimized bucking were up to 4% higher (in average 3%) than those of the manual bucking once expressed on a per cubic meter basis. Moreover, the harvesting productivity of the ON treatment was at the maximum 17% higher compared to the OFF treatment. Based on the results from this case study, the use of an optimization software in Norway spruce dominated stands with the aim to maximize the value of single stems showed promising results.
Keywords
buck-to-value;
processing;
single-grip-harvester;
product recovery;
harvesting productivity
-
Labelle,
Assistant Professorship of Forest Operations, Department of Ecology and Ecosystem Management, Technical University of Munich, Hans-Carl-von-Carlowitz-Platz 2, D-85354 Freising, Germany
E-mail
eric.labelle@tum.de
- Huß, Assistant Professorship of Forest Operations, Department of Ecology and Ecosystem Management, Technical University of Munich, Hans-Carl-von-Carlowitz-Platz 2, D-85354 Freising, Germany E-mail linus.huss@gmx.de
Received 9 January 2018 Accepted 24 July 2018 Published 13 August 2018
Views 72320
Available at https://doi.org/10.14214/sf.9947 | Download PDF

1 Introduction
The predicted change of climate conditions reached the German forestry sector years ago with one of the most controversially discussed tree species being Norway spruce (Picea abies [L.] Karst.). The importance of Norway spruce for the forest and lumber industry is paramount since it represents 43% of the forest area, 51% of the standing volume, and 66% of wood volume sold within forests owned by the Bavarian State Forest (808 000 ha; Bayerische Staatsforsten AöR 2016). However, the volume of spruce will decline in the foreseeable future because of the effects of climate change and the associated warmer and dryer growing conditions in Bavaria (Kohnle 2015). With the expected reduction in Norway spruce volumes (standing and harvested), decreasing earnings of the forest owners are anticipated and solutions to offset the predicted loss of revenue should be considered. Coincidently, a constant and high demand for softwood exists, which predominantly remains fulfilled by Norway spruce. Potential compensatory species, particularly European silver fir (Abies alba Mill.), Douglas fir (Pseudotsuga menziesii (Mirb.) Franco) and grand fir (Abies grandis (Douglas ex D. Don) Lindl.), do not yet have the potential to meet the high demands. A more efficient usage of the wood resource is key to prevent an impending deficit (Mantau 2012a; Mantau 2012b). Hence, it is of both-sided interest to improve product recovery and associated revenues during forest harvesting operations.
Nowadays, most large-scale forest operations performed on terrain slopes below 25% are semi- or fully-mechanized and thus require the use of machines to harvest and extract the wood from the forest. The task of bucking, defined as the procedure in which a stem is cut into shorter log segments, performed during forest harvesting is a possible parameter to raise the net revenue at the early stage of the production chain (Faaland and Briggs 1984; Marshall 2005). Errors made in this important processing step are difficult and sometimes impossible to resolve further on in the value-chain (Pnevmaticos and Mann 1972). Murphy (1987) estimated the possible loss, caused by inadequate bucking, at 20–25% of the standing stand value. Of even greater importance is the development and use of a detailed decision support tool for the respective processor (Kivinen 2004). Attempts were already made in 1984 to simplify the bucking task by using computers with a goal of improving product recovery and value (Geerts and Twaddle 1984; Sessions 1988; Sessions et al. 1989). These computers, referred to as on-board computers (OBC), are mounted directly in the operating cabin of forest machines and have been readily available for the past decades. In summary, Boston and Murphy (2003) stated that improvements in tree bucking can be mainly realized by operator training and enhanced equipment.
Software-based solutions of OBC can be used in mechanized harvesting, which currently represents approximately half of the harvested wood volume in the Bavarian State Forest. Not only are these systems able to acquire diameter and length of the material fed through the harvesting head but they can also calculate the optimal arrangement pattern of various products based on the derivable profile of the tree combined with the specifications of the target assortments (Kivinen 2004). Kivinen (2007) and Marshall (2007) provided an overview on existing mathematical and methodical approaches to the challenges of optimal tree bucking. The principle to make a prediction for the profile of the entire merchantable stem is actually based on the measurement of a first short segment, normally located at the butt end of the stem (Liski and Nummi 1995; Kivinen and Uusitalo 2002). The height of the stem is estimated by means of height-curves, which mostly result from the heights of previously processed trees of the same species. Deviations between actual and predicted diameter are continuously corrected (Uusitalo 2010). Uusitalo et al. (2004) distinguished between two various types of optimization software:
- Automatic bucking – If the quality is homogeneous throughout the run of the stem, the optimization proceeds with bucking without interventions of the operator.
- Automatic quality bucking – The system is being conditioned to qualitative characteristics assessed by the operator (changes in quality are entered into the optimization system). The decisions are automatically carried out by the harvesting head. This type of optimization tends to be slower (Uusitalo et al. 2004).
Besides these two types of optimization, the conventional method is known as quality bucking. It refers to when an operator decides the sequence of assortments to be produced from each tree by pressing the corresponding pre-programmed “hot keys” on the operating joysticks, which are located near the arm rests of the operator seat. Such hot keys are linked to a specific species and assortment combination. During quality bucking, log length information continues to be measured by the harvesting head but optimized bucking solutions are not provided by the OBC. Currently, this is the most commonly used method in Germany.
With the use of OBC optimizations systems, two main matrices can be used as input for decision making; price-matrix or a combination of the price-matrix and a demand-matrix. When the aim is to maximize the value of a stem by an optimal assortment-formation, the method is called buck-to-value (Marshall 2005; Kivinen 2007; Dems et al. 2013). The base for calculations is through the input of a price-matrix for the assortments to be processed, differentiated by length and diameter (Liski and Nummi 1995). With the purpose to generate certain assortments in a pre-determined quantity, orientated towards market or customer requirements, a demand-matrix is applied in addition. According to Marshall (2005) this method is referred to as buck-to-order. The optimization software continuously compares already cut assortments to the objectives and adapts the further bucking accordingly (Kivinen and Uusitalo 2002). This procedure considers stand and company parameters, because the optimal bucking procedure for one tree does not correlate to the optimal solution for a higher level (Marshall 2005). Despite the expanded use of optimization software during mechanized harvesting in Scandinavia and parts of North-America, their application in Germany remains rather sporadic and in niche areas. Main reasons for this are the lack of local data to establish region specific stem curve equations, higher single-tree volumes (often in excess of 2 m3 per tree), varying tree architecture and a divergent harvest and sorting practice. For example, Labelle et al. (2017) concluded that the use of the optimization software Opti4G in Scots pine (Pinus sylvestris L.) was not advisable for now in Bavaria/Germany since the crown form dominating the study sites could not be covered appropriately by stem form prediction algorithm, which was designed for Scandinavian pines. However, first results for Norway spruce did indicate a possible surplus by using the software (Labelle et al. 2017).
The aims of the study were i) establish a basis for an extended application in Germany and an associated increase of value added by the use of valid statements about the usage of OBC optimization systems in spruce for mid-European conditions; ii) quantify and compare harvesting productivity (m3 PMH0–1), product recovery (m3 tree–1) and revenue (€/m3) for manual and automatic bucking, performed through the use of an optimization software in a spruce dominated stand.
2 Material and methods
2.1 Forest stand measurements and study design
The study site, owned and managed by the Bavarian State Forest Enterprise (Bayerische Staatsforsten AöR; BaySF), was located in central Bavaria, Germany (48°55´N, 11°06´E). The 80-year old forest stand is dominated by Norway spruce (93%), followed by European beech (Fagus sylvatica L.) (4%) and the remaining 3% is shared between European oak (Quercus robur L.) and birch (Betula pendula Roth). Standing volume was about 543 m3 ha–1 with an approximate annual growth rate of 11 m3 ha–1.
Within the forest stand, a 13.2 ha harvest block with an elevation of approximately 550 m above sea level was selected for the study. The silvicultural treatment chosen by BaySF was a regeneration harvest where approx. 35% of the standing volume was to be harvested using a semi-mechanized system. A total of ten adjacent and pre-existing machine operating trails were selected for the study with an average length of 440 m and each spaced by 30 m between trail centerlines (Fig. 1). These trails allowed the movement of forest machines within the forest stand and enabled the extraction of timber to roadside. Both ends of the machine operating trails were connected to the forest road network. The ten machine operating trails were randomly assigned to one of the two treatments studied (OFF and ON). Two plots measuring 100 m in length and 30 m in width were established within each operating trail (Fig. 2) and the total of 20 plots combined for an approximate area of 6 ha. The beginning and end-points of each plot were identified and marked on trees with the use of aerosol paint and flagging tape. Within each plot, every tree selected for removal by the district forester was given a unique alpha-numeric identification code painted on the tree at a height of 3 m. During the pre-harvest field inventory campaign, the following attributes were assessed and recorded; tree species, diameter at breast height (dbh) obtained by averaging two perpendicular diameter measurements at a height of 1.3 m above ground, and tree height recorded at 0.5 m accuracy with a digital height, distance and inclination instrument. The standing volume per tree was calculated based on the parameters height and dbh with the use of form factors, i.e. species and diameter specific reduction factors to account for stem taper in tree volume calculation (Referat Forst- und Jagdhoheit 2011).
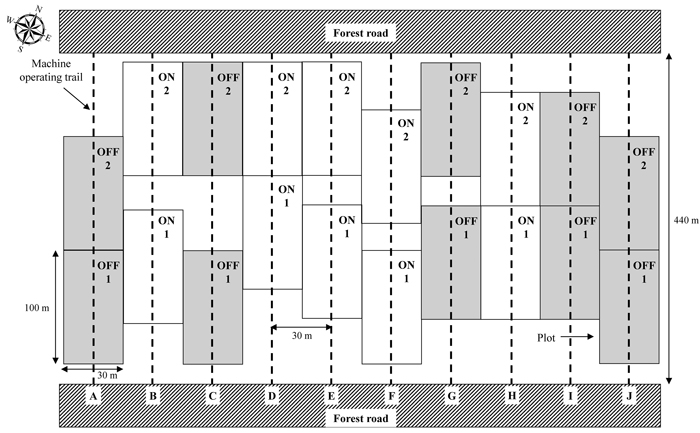
Fig. 1. Schematic of the study design indicating the location of machine operating trails and treatment plots. Grey shaded plots were subjected to quality bucking (OFF) whereas white plots were subjected to automatic bucking (ON).
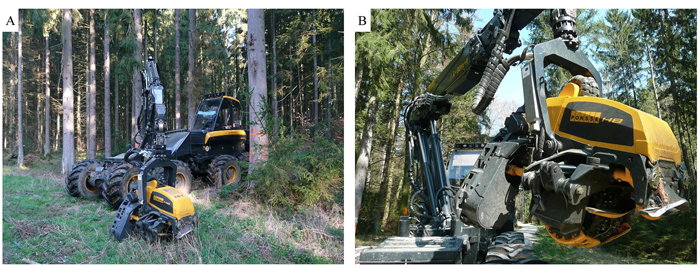
Fig. 2. A. Ponsse Bear single grip-harvester, B. Ponsse H8 harvesting head.
2.2 Machinery specifications, operating parameters and procedure
Harvesting operations were performed in April 2016 with a 2016 8-wheel Ponsse Bear single-grip harvester equipped with a H8 harvesting head and the Opti4G on-board information and optimization system (Fig. 2 and Table 1). Beyond the reach of the 10 m harvester boom, trees were felled motor-manually with the use of a Husqvarna 560 XP-G chain-saw.
| Table 1. Harvesting machine specifications (Ponsse). | ||
| Dimensions | Minimal and usual weight | 23 800 kg; 24 500 kg |
| Engine | Engine output | 260 kW (350 hp) |
| Torque | 1400 Nm (1300–1600 rpm) | |
| Traction | 230 kN | |
| Boom C6 | Slewing torque (gross) | 67 kNm |
| Lifting moment (gross) | 310 kNm | |
| Reach | 10 m | |
| Harvesting head Ponsse H8 | Weight (depending on the equipment) | 1250 kg |
| Maximum felling diameter | 800 mm | |
| Feeding speed | 5 m/s | |
| Maximum opening of front and rear knives | 740 mm / 780 mm | |
Once a tree was felled and processing began in the ON plots, the OBC compared the actual stem diameter value, received from the measurement devices located on the harvesting head, to those of the last 180 stems of the same tree species, deposited and continuously updated in a database. From that database, the eight stems with the closest diameter and taper profile to the tree being processed were averaged and their mean length was used to predict the further course of the present stem (Fig. 3). This initial decision is based on the first few meters of the stem profile and every ten seconds, the forecast or prediction was adapted to the actual values measured. According to the expected stem taper, the optimization system calculated all possible bucking options and proposed, in case of this study, the solution that maximized value per tree. If the operator decided against the optimized solution proposed by the OBC, out of qualitative reasons for example, the system would automatically adjust and present the next most profitable bucking solution (Fig. 3). Detailed information on the optimization procedure is available in Kivinen (2007). The prioritization of assortments was performed with the assistance of a price-matrix, which related the price of a given product to a length and diameter combination. Both OFF and ON treatments were assigned an identical assortment list to ensure comparability (Table 2). For the automatic bucking (ON), the price-matrix was entered in the OBC where every assortment had its own specific length and minimal diameter values. Only in case of qualitative constraints or stem forms not detectable by the system did the harvester operator intervene in the bucking decision. For confidentiality reasons, assortment prices will not be disclosed but rather presented as a ratio where the price of the most valuable assortment “large diameter sawlog” was set to 100% as reference.
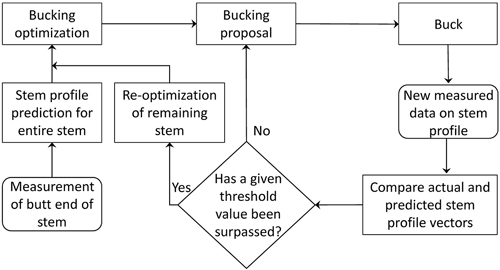
Fig. 3. Flowchart indicating the general steps of the bucking optimization proposal (Uusitalo 2010).
| Table 2. Assortments, diameters, and lengths used in the study along with a percentage based price-matrix where the products of highest value were set at 100%. | ||||||||||
| Assortments | Top diameter (without bark) [cm] | Length [m] | Diameter class (range in cm) | |||||||
| 1b | 2a | 2b | 3a | 3b | 4 | 5 | 6 | |||
| (15–19) | (20–24) | (25–29) | (30–34) | (35–39) | (40–49) | (50–59) | (60+) | |||
| Pulpwood | ≥ 10 | 2 + 3 | 68% | 68% | 68% | 68% | 68% | 68% | 68% | 68% |
| Low grade pulpwood | ≥ 7 | 2 + 3 | 44% | 44% | 44% | 44% | 44% | 44% | 44% | 44% |
| Pallet | ≥ 25 | 3.6 | 62% | 67% | 74% | 74% | 74% | 74% | 41% | 41% |
| Sawlog | ≥ 14 | 4 + 5 | 77% | 86% | 95% | 95% | 95% | 95% | 95% | 95% |
| Large diameter sawlog | ≥ 40 | 5 | - | - | - | - | - | 100% | 100% | 100% |
To perform quality bucking (OFF), the harvester operator linked the assortments to the existing hot keys on the joysticks. During quality bucking, the operator had the same instructions to maximize value per tree but was not able to make use of the optimization system. Instead, the operator relied on the same price-matrix, readily available in the harvester cabin, and his previous experience. Operating the saw and the order in which to fell and process trees marked for removal remained the responsibility of the operator for both treatments. The same operator used for both treatments was considered very experienced because of his long-term employment in mechanized harvesting operations. All operations were performed during regular working hours and only during day-shifts. The machine on-board measurement system was calibrated by the operator at the beginning of the study and once per treatment during the operations.
Because of the distance between adjacent machine operating trails and the limited reach of the harvester boom, motor-manual felling was required within the middle section of the leave strips, which entailed a three-step operation;
- an initial pass was performed by the single-grip harvester where all trees selected for removal that were within boom reach were felled and processed,
- trees selected for removal that were located beyond the reach of the harvester were felled with chain-saws (motor-manual),
- a second harvester pass was performed to process all trees that were felled motor-manually.
Once all trees marked for removal were felled and processed, a forwarder was used to transport processed logs from the machine operating trails to a wood landing located on a truck accessible road. To preclude conceivable learning-effects, the trails allocated to the treatment OFF were completed before starting with the automatic bucking treatment.
Harvesting productivity was based on video time and motion study using the continuous timing method. Video footage was obtained by a digital video camera aimed at the harvesting head and held by a researcher located inside the harvester cabin. To link all datasets, the identification number marked on target trees was mentioned aloud by the operator and then linked to the OBC-counter. Therefore, the assortments and associated time requirements could be related to the respective individual stem in the following analysis.
2.3 Data collection and analysis
Video footage was evaluated by tree, which constituted a cycle, with the aid of the software TimeStudy T1. Individual cycles were differentiated into work cycle elements and seconds were chosen as the measuring unit (Table 3). Data concerning the assortments, length, diameter, and volume per log were acquired through ASCII- and pri-files compiled by the harvesters OBC. Existing data sets (pre-harvest inventory, harvester protocol, time and motion data) were merged in Microsoft Excel to create a master file. Because of the high frequency of Norway spruce (93%) within the harvest site, other tree species selected for harvesting were not included in this study.
| Table 3. Description of work cycle elements. | ||
| Work cycle element | Start | End |
| Boom-out | Boom extending towards tree | Harvesting head positioned at base of tree or start of processing motor-manually felled trees |
| Felling | Head is in vertical position and saw is activated | Tree crown touches the ground or feed rollers are activated |
| Processing | Feed rollers are activated with stem in harvesting head | Tree-top is released |
| Manipulation1 | Other boom tasks | |
| Moving | Traction system is activated | Traction system is deactivated or other elements, e.g. Boom-out, Manipulation2 dominates |
| Delay3 | Tasks, which could not be allocated to another work cycle element | |
| 1 Movements of the boom, which cannot be allocated to the processing element: building a brush-mat, sorting/piling processed logs, etc. 2 Meaning: If the boom moves away from the vehicular-middle while the machine still continues moving, the task “Moving” ends in favor of the task “Boom-out”/”Manipulation”. 3 Interruptions which are not part of the pure working time: repairs, phone calls, influences due to the study, etc. Because of the chosen unit stating the productivity in PMH0, all delays were removed for analysis. | ||
Within the pre-harvest inventory, some tree-top breakages caused by snow were detected. We also noticed that several stems broke at these pre-existing flaws during harvesting. The corresponding top parts were often located beyond harvester boom reach and could not be processed under normal operating conditions. For this reason, all trees exhibiting broken parts that were left in the forest and thus could not be processed were omitted from the study. Contingent on the work organization and the occurrence of broken tops, which resulted mainly from stem breaks, the analyses were distinguished between four subgroups:
- fully-mechanized system with no broken tops or other breakages (undamaged trees),
- fully-mechanized system with broken tops or other breakages (damaged trees),
- semi-mechanized system (motor-manual felling and processing by the harvester) with no
broken tops or breakages (undamaged trees),
- semi-mechanized system with broken tops or breakages (damaged trees).
In this context, the term damaged combined actual broken stems and trees with old crown breakages since both options restrained further processing, in particular the bucking task performed by the harvester. To obtain revenue, merchantable volume of the respective diameter classes was multiplied by the associated assortment price per cubic meter. Afterwards, the result was divided by the absolute product recovery.
Statistical analyses were performed using Minitab version 17 and SPSS version 21. The underlying significance level used in all tests was 5%. When necessary, Fisher-LSD was used as the post-hoc-test. The calculations of harvester productivity were based on standardized values. This was necessary since some work elements (“Manipulation” and “Moving”) were not common for every tree. For example, the harvester could remain in a static position and process several stems. Since the moving to this point was conduced to the processing of various trees, the accrued time consumption had to be allocated equally. The standardized values were then assigned for each cycle instead of the respective measured value. Work cycle element “Manipulation” was dealt in the same manner. The regression functions of harvesting productivity were based on polynomial second order referring to the recommendations of Visser et al. (2009) and forced a zero intercept. Beyond the actual volume of a tree and the method used for felling, other factors such as breakages/broken tops could also influence productivity. Therefore, a linear multivariate regression was also performed to provide an indication of the influence of the independent variables “volume [m3 with bark]” and “treatment (OFF/ON)” on harvesting productivity.
3 Results
3.1 Pre-harvest tree inventory
A total of 403 spruce trees were selected for removal within the 10 plots, which translated to an average harvested volume of 194 m3 ha–1 (with bark). From those trees, 220 trees with an average individual volume of 2.9 m3 were located in OFF plots, whereas 183 trees (2.8 m3 per tree) were in ON plots. However, due to operational logistics, the dataset used in this article focused on 173 spruce trees in the OFF plots and 113 trees in ON plots for which pre-harvest tree inventory was available (Table 4). The attribute tree dbh was normally distributed for both treatments and featured equal variances. Trees in the OFF plots (average dbh 46.6 cm) had a slightly smaller diameter as compared to those in the ON plots (47.0 cm). The average dbh reached a maximum of 48.9 cm in the treatment OFF (trail C) and 51.9 cm in the treatment ON (trail D), whereas the lowest values were 43.9 cm (trail I) and 43.0 cm (trail H). The average tree dbh per trail did not differ significantly (p = 0.712) between both treatments. The measured heights did not follow a normal distribution. Average tree heights ranged between 31.0 m and 35.5 m in OFF plots and between 32.0 m and 34.3 m in ON plots. Despite the spread in tree height, no statistical difference (p = 0.375) existed between treatments. A Kruskal-Wallis-test revealed significant differences (p = 0.002) between the average tree heights in the OFF trails, whereas the ON trails did not show this pattern. Standing volume per tree (m3, with bark) was normally distributed by trail as well as by treatment with the exception of trail B. Maximum tree volume was 3.2 m3 and 3.5 m3, whereas the lowest values were 2.5 m3 and 2.4 m3 per tree, for OFF and ON treatments respectively.
| Table 4. Pre-harvest tree inventory data with sample size (number of trees harvested), dbh, height, standing volume per tree, and respective standard error by treatment. | |||||||||
| Treatment | Operating trail | N | dbh [cm] | Height [m] | Single-tree volume [m3 with bark] | ||||
| Average | SE | Average | SE | Average | SE | ||||
| OFF | A | 10 | 48.4 a1 | 3.42 | 35.5 a | 0.58 | 3.2 ab | 0.47 | |
| C | 50 | 48.9 a | 1.47 | 33.5 ab | 0.67 | 3.1 a | 0.17 | ||
| G | 45 | 45.2 a | 1.52 | 32.5 b | 0.55 | 2.6 ab | 0.19 | ||
| I | 41 | 43.9 a | 1.58 | 33.3 ab | 0.52 | 2.5 b | 0.18 | ||
| J | 27 | 48.0 a | 2.57 | 31.0 b | 0.85 | 2.8 ab | 0.27 | ||
| ON | B | 29 | 48.6 a | 1.41 | 33.9 a | 0.46 | 3.0 a | 0.19 | |
| D | 16 | 51.9 a | 3.04 | 34.4 a | 0.80 | 3.5 a | 0.41 | ||
| E | 34 | 47.4 a | 1.98 | 33.5 a | 0.79 | 3.0 a | 0.24 | ||
| F | 11 | 43.6 a | 2.39 | 32.7 a | 0.66 | 2.4 a | 0.26 | ||
| H | 23 | 43.0 a | 2.27 | 32.0 a | 0.81 | 2.4 a | 0.25 | ||
| Total | |||||||||
| OFF | All | 173 | 46.6 a | 0.83 | 32.9 a | 0.31 | 2.8 a | 0.01 | |
| ON | All | 113 | 47.0 a | 0.99 | 33.3 a | 0.34 | 2.9 a | 0.12 | |
| 1 Different lower case letters indicate a statistical difference at α = 5% in means from each attribute (dbh, height, and single-tree volume) between operating trails within a respective treatment based on Fisher’s LSD test. | |||||||||
During operations, 484 m3 (with bark) were harvested in OFF plots and 326 m3 in ON plots. Total volume corresponding to tree diameter classes 1b (15–19 cm), 3a (30–34 cm) and 7 (70–79 cm) were higher for the ON treatment whereas the other diameter classes provided higher volumes in the OFF treatment (Fig. 4A). Different trends were noticed when considering the cumulative total per treatment (Fig. 4B). The automatic treatment had a 3% higher volume in diameter classes 3a, 5 and 7 whereas the OFF volumes were higher in diameter classes 2b and 3b (1%) and 4 (2%). A maximum difference of 4% from OFF to ON resulted in the diameter class 6. With 89% (OFF) and 86% (ON) of the total volume, the harvesting yield was concentrated in diameter classes 4, 5 and 6, thus providing a similar distribution for both treatments. Consequently, the pre-harvest inventory would also support a comparable average total revenue.
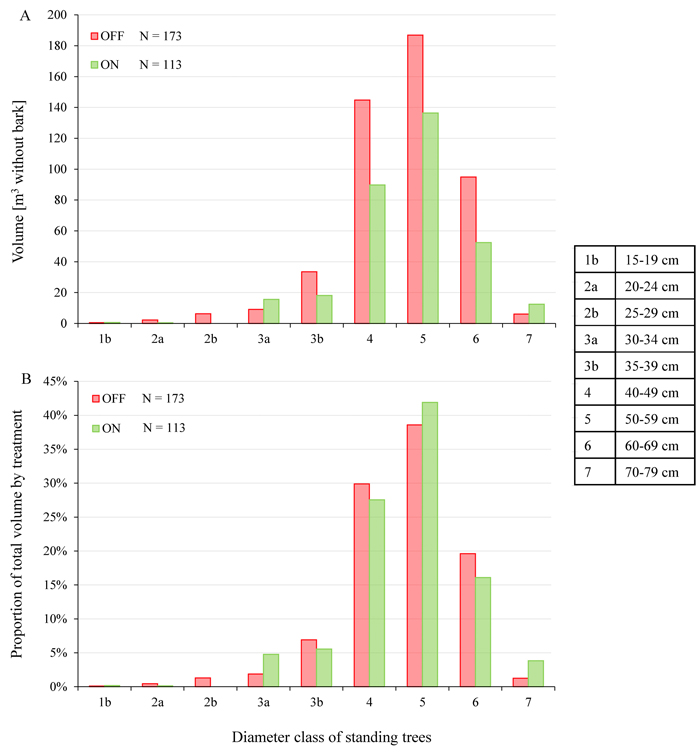
Fig. 4. A. Volume [m3 without bark] by diameter class and treatment, B. Proportion of total volume by treatment and diameter class; all harvested trees with pre-inventory data.
3.2 Product recovery
Table 5 shows the frequency distribution of harvested trees per subgroup and is subdivided by diameter classes and treatment. In this analysis, information from the OBC was used to present the recovered volume (merchantable wood) without bark. The proportion of trees harvested motor-manually was about 39% and of this proportion, 35% had broken tops. The remaining trees (approx. 61%) were felled and processed with the single-grip harvester. By tendency, broken tops primarily occurred in the higher diameter spectrum starting from diameter class 4. The subgroups with damaged trees showed a slightly higher average single-tree volume (+0.1 m3), but were not statistically different between subgroups. Relative product recovery was defined as the ratio of merchantable volume in m3 without bark to standing volume in m3 with bark. The lowest product recovery of 65% was detected in the subgroup of fully-mechanized, damaged trees (OFF) whereas a maximum of 72% was reached in the subgroup fully-mechanized-undamaged (OFF). The product recovery of undamaged stems bucked manually was 7% higher than that of the subgroup with broken tops (fully-mechanized system). In case of the automatic bucking (ON), 54% of the trees were processed following manual felling.
| Table 5. Sample size by harvesting system, tree shape, diameter class, and treatment; in brackets volume in m3 without bark. | ||||||||
| Diameter class | Harvesting system | |||||||
| Fully-mechanized | Semi-mechanized | |||||||
| Undamaged | Damaged | Undamaged | Damaged | |||||
| OFF | ON | OFF | ON | OFF | ON | OFF | ON | |
| 1b | 1 (0.2) | 1 (0.2) | - | - | 1 (0.2) | 1 (0.1) | - | - |
| 2a | 2 (0.8) | - | - | 1 (0.4) | 2 (0.7) | - | - | - |
| 2b | 6 (3.5) | - | - | - | 1 (0.5) | - | 1 (0.8) | - |
| 3a | 3 (2.7) | 5 (4.5) | - | 2 (1.8) | 4 (3.3) | 5 (4.7) | 1 (0.7) | 1 (0.8) |
| 3b | 12 (16.8) | 3 (3.7) | 2 (2.7) | - | 5 (6.6) | 7 (7.4) | 1 (1.1) | 1 (1.3) |
| 4 | 26 (43.5) | 12 (20.6) | 11 (16.6) | 6 (10.2) | 14 (24.2) | 11 (18.6) | 8 (13.9) | 8 (13.3) |
| 5 | 23 (56.2) | 13 (28.9) | 7 (16.2) | 3 (8.0) | 10 (24.4) | 15 (35.4) | 12 (29.4) | 5 (13.7) |
| 6 | 8 (26.8) | 4 (12.2) | 4 (12.4) | 1 (3.2) | 6 (21.5) | 5 (14.9) | 1 (2.9) | 1 (3.0) |
| 7 | - | 1 (3.5) | - | - | 1 (4.0) | 1 (3.7) | - | - |
| Total | 81 (150.4) | 39 (73.5) | 24 (47.9) | 13 (23.6) | 44 (85.3) | 45 (84.7) | 24 (48.8) | 16 (32.1) |
| Average single-tree volume | 1.9 a1 | 1.9 a | 2.0 a | 1.8 a | 1.9 a | 1.9 a | 2.0 a | 2.0 a |
| Relative product recovery | 72% a | 68% a | 65% b | 70% a | 68% ab | 66% a | 70% ab | 69% a |
| 1 Different lower case letters indicate a statistical difference at α = 5% in means between treatments (OFF and ON) within a respective attribute based on Fisher’s LSD test. | ||||||||
For the relative product recovery of the undamaged subgroup, a significant difference between the treatments revealed that manual bucking exceeded automatic bucking by 4%. In the direct comparison of all trees per treatment, the relative product recovery accounted for values of 70% and 68% for manual and automatic bucking, respectively. The proportion of harvested volume loss did not rise above 35% for both treatments (Table 6).
| Table 6. Relative product recovery by harvesting system, tree shape, and treatment. | ||
| Harvesting system | Treatment | |
| OFF | ON | |
| Fully-mechanized | 71% a1 | 69% a |
| Semi-mechanized | 69% a | 67% a |
| Undamaged | 71% a | 67% b |
| Damaged | 68% a | 69% a |
| Total | 70% a | 68% a |
| 1 Different lower case letters indicate a statistical difference at α = 5% in means between treatments (OFF and ON) within a respective attribute based on Fisher’s LSD test. | ||
3.3 Distribution of assortments
An analysis of the assortments produced provided an indication of how differences in revenue occurred between treatments. More than 75% of the manually bucked volume was allocated to the assortment 5-m-sawlog over all subgroups (Table 7). The proportion of 4-m-sawlog reached a maximum of 5% (semi-mechanized-damaged). When considering motor-manually felled trees, more volume was bucked in the 4-m-sawlogs as well as in the large diameter sawlog segments. However, the rate of pallet wood was higher in the fully-mechanized system. The most valuable assortments (large diameter sawlog, sawlog-5.0 m and sawlog-4.0 m) accounted for 82% of fully-mechanized-undamaged and fully-mechanized-damaged, whereas these assortments represented 86% of semi-mechanized-undamaged and semi-mechanized-damaged merchantable volume. Consequently, the proportion of low-value assortments differed between 14% and 18%.
| Table 7. Volume in m3 without bark by harvesting system, tree shape, assortment, and treatment; in brackets is the relative frequency expressed in percentage. | ||||||||
| Assortment | Harvesting system | |||||||
| Fully-mechanized | Semi-mechanized | |||||||
| Undamaged | Damaged | Undamaged | Damaged | |||||
| OFF | ON | OFF | ON | OFF | ON | OFF | ON | |
| Large diameter sawlog | 5.5 (4) | 2.0 (3) | 0.9 (2) | 0.7 (3) | 7.2 (8) | 1.1 (1) | 1.8 (4) | 0.9 (3) |
| Sawlog-5.0 m | 115.3 (77) | 27.7 (38) | 37.2 (78) | 8.9 (38) | 63.4 (74) | 32.9 (39) | 37.5 (77) | 12.0 (37) |
| Sawlog-4.0 m | 1.6 (1) | 39.4 (54) | 1.0 (2) | 12.5 (53) | 3.5 (4) | 45.7 (54) | 2.6 (5) | 16.3 (51) |
| Pallet | 20.1 (13) | 1.6 (2) | 6.6 (14) | 0.6 (3) | 7.7 (9) | 2.7 (3) | 4.1 (8) | 2.2 (7) |
| Low-grade pulpwood 2–3 m | 6.2 (4) | 1.4 (2) | 2.0 (4) | 0.3 (1) | 2.2 (3) | 1.1 (1) | 1.7 (3) | 0.5 (1) |
| Pulpwood 2–3 m | 1.7 (1) | 1.4 (2) | 0.2 (0) | 0.6 (2) | 1.4 (2) | 1.0 (1) | 1.2 (2) | 0.3 (1) |
| Total | 150.4 (100) | 73.5 (100) | 47.9 (100) | 23.6 (100) | 85.3 (100) | 84.7 (100) | 48.8 (100) | 32.1 (100) |
By contrast, the automatic treatment focused on both sawlog-assortments. The dominance shifted in direction of the shorter sawlogs where more than half of the respective volume was harvested. During motor-manual felling operation, damaged trees featured a relatively high rate of pallet wood. Apart from this a – in relation to the manual bucking – homogenous pattern of the distribution between the harvesting systems was observed. The group sums of the cumulative frequency maximum differed by about 4% between 91% (semi-mechanized-damaged) and 95% (fully-mechanized-undamaged) for the high-value assortments. Therefore, the proportion of low-value assortments amounted to a maximum of 9%. Because of the identical prices per cubic meter for long and short sawlogs, a monetary benefit resulted for the treatment ON, which was reflected by the revenue setting. The attempt of the operator (treatment OFF) to heighten the proportion of large diameter sawlog segments (about 5% of the total volume) – and to maximize possible revenue per m3 connected therewith – could only counteract this trend marginally. The software “abstained” from a 5 m long sawlog segment to the benefit of another assortment in some circumstances if this corresponded with the objective to generate a maximum revenue for the total stem.
3.4 Harvesting productivity
Harvesting productivity varied between 43 and 61 m3 PMH0–1 (Table 8). Aside from the subgroup “semi-mechanized-damaged”, harvesting productivity during the automatic treatment was consistently higher than in the manual bucking, with a statistical difference between treatments for the fully-mechanized-undamaged group. This impacted the subgroup “fully-mechanized”, and contributed to a statistically different harvesting productivity. As expected, motor-manual felling increased the performance of the harvester since the felling task was already completed. Despite higher averages, no statistical differences in harvesting productivity were detected between treatments (“semi-mechanized”). The optimized bucking statistically exceeded the manual bucking by 8 m3 per hour (16.7%) for undamaged trees. However, harvesting productivity was quite similar for both treatments when considering all damaged stems. In total, a supererogation of about 6 m3 PMH0–1 (12.4%) was verified statistically for the treatment ON.
| Table 8. Harvesting productivity [m3 PMH0–1] by harvesting system and treatment; harvested trees with pre-inventory data. | |||||
| Harvesting system | Treatment | N | Average single-tree volume [m3 without bark] | Harvesting productivity [m3 PMH0–1] | SE |
| Fully-mechanized-undamaged | OFF | 106 | 1.8 a1 | 43.3 a | 1.4 |
| ON | 54 | 1.8 a | 50.3 b | 2.1 | |
| Fully-mechanized-damaged | OFF | 29 | 1.9 a | 45.9 a | 1.8 |
| ON | 14 | 1.8 a | 48.6 a | 3.9 | |
| Semi-mechanized-undamaged | OFF | 92 | 1.8 a | 53.9 a | 2.1 |
| ON | 76 | 1.7 a | 60.6 a | 3.0 | |
| Semi-mechanized-damaged | OFF | 39 | 2.1 a | 58.3 a | 2.7 |
| ON | 25 | 1.9 a | 54.9 a | 2.9 | |
| Fully-mechanized | OFF | 135 | 1.8 a | 43.9 a | 1.2 |
| ON | 68 | 1.8 a | 50.0 b | 1.9 | |
| Semi-mechanized | OFF | 131 | 1.9 a | 55.2 a | 1.7 |
| ON | 101 | 1.7 a | 59.1 a | 2.4 | |
| Undamaged | OFF | 198 | 1.8 a | 48.0 a | 1.2 |
| ON | 130 | 1.7 a | 56.0 b | 1.9 | |
| Damaged | OFF | 68 | 2.0 a | 52.9 a | 1.9 |
| ON | 39 | 1.8 a | 52.6 a | 2.3 | |
| Total | OFF | 266 | 1.9 a | 49.2 a | 1.0 |
| ON | 169 | 1.7 a | 55.3 b | 1.6 | |
| 1 Different lower case letters indicate a statistical difference at α = 5% in means between treatments (OFF and ON) within a respective attribute based on Fisher’s LSD test. | |||||
Harvesting productivity in function of single-tree volume is presented in Fig. 5. The optimal performance level of the harvester was reached between a stem volume of 2 and 3 m3 without bark, independent of the treatment. The motor-manual felling raised the productivity curve and shifted the maximum productivity in direction of a volume between 2.5 and 3 m3 without bark. With increasing single-tree volume, a more pronounced separation between harvesting productivity curves was present, which hinted to the potential influence of other factors (Fig. 5A). Therefore, a linear multivariate regression was performed to assess the influence of the independent variables “volume [m3 with bark]” and “treatment (OFF/ON)” on harvesting productivity. The R2 was the highest with 0.23 in the group “semi-mechanized” (“fully-mechanized”: 0.15) and 20% of the variance was explained by the volume, whereas the treatment explained only 3% (“fully-mechanized”: 5%). In total, 14% of the variance was explained by the volume and 5% by the treatment (R2: 0.20).
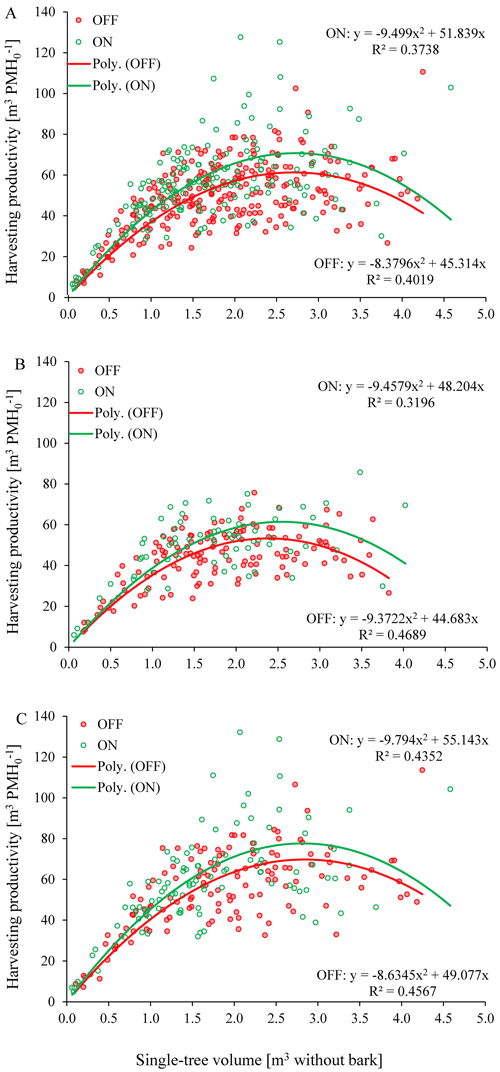
Fig. 5. Harvesting productivity [m3 PMH0–1] in function of single-tree volume: A. “total”, B. “fully-mechanized”, C. “semi-mechanized”; harvested trees with time and motion data.
Illustrating harvesting productivity in function of single-tree volume might not be immediately helpful for practitioners since the attributes height and tree form (in course of form factors) are used in the calculation of this index. A statement based on the mean dbh of the stand, which can be estimated with relatively low resource effort on site, simplifies the usage. The optimal productivity range of the Ponsse Bear single-grip harvester combined with the H8 harvesting head was located at a dbh of 50–60 cm (Fig. 6). A diameter of 55 cm was in proportion to 74% of the maximum possible delimbing diameter of the harvesting head.
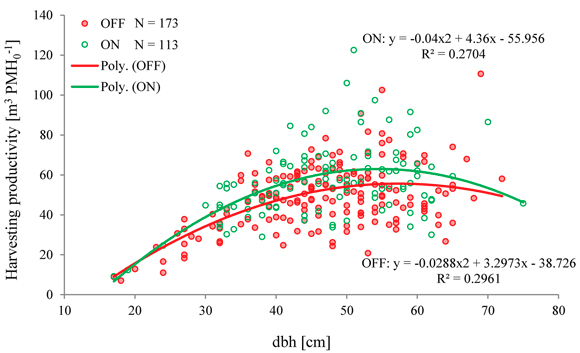
Fig. 6. Harvesting productivity [m3 PMH0–1] in function of tree dbh for all harvested trees with pre-harvest inventory data.
3.5 Revenue recovery
Because of the size and price relationship used in the price-matrix, an increasing revenue was detected with an increase in diameter class (Table 9). The lowest revenue during manual bucking was 63.7 €/m3 in diameter class 1b (fully-mechanized-undamaged), whereas lowest revenue for automatic bucking was 67.4 €/m3 for the same diameter class (fully-mechanized-undamaged). A maxima of 106.5 €/m3 (OFF, diameter class 6, semi-mechanized-damaged) and 102.8 €/m3 (ON, diameter class 5, fully-mechanized-undamaged) were reached in large diameter timber. The average revenue of the manual bucking varied between 95 €/m3 and 99 €/m3 within the four subgroups. This variation was distinctly less in the automatic treatment with a maximum difference of 0.9 €/m3. None of the differences within each treatment were statistically significant. Although the average revenue was higher for automatic bucking, the difference was only statistically significant for the harvester-felled trees without broken tops (fully-mechanized-undamaged). The mean values of the revenues showed a difference of 4.9 €/m3.
| Table 9. Mean revenue [€/m3] per harvesting system, shape, treatment, and diameter class; harvested trees with pre-inventory data. | |||||||||
| Harvesting system | |||||||||
| Fully-mechanized | Semi-mechanized | ||||||||
| Undamaged | Damaged | Undamaged | Damaged | ||||||
| OFF | ON | OFF | ON | OFF | ON | OFF | ON | ||
| Diameter class | 1b | 63.7 € | 67.4 € | - | - | 79.6 € | 69.6 € | - | |
| 2a | 73.9 € | - | - | 81.6 € | 79.4 € | - | - | ||
| 2b | 78.5 € | - | - | - | 79.5 € | - | 91.3 € | - | |
| 3a | 91.3 € | 97.0 € | - | 99.4 € | 96.8 € | 94.3 € | 97.4 € | 95.9 € | |
| 3b | 96.1 € | 99.1 € | 102.8 € | - | 94.7 € | 99.1 € | 95.6 € | 98.1 € | |
| 4 | 96.4 € | 101.0 € | 95.9 € | 101.8 € | 99.5 € | 102.0 € | 96.4 € | 101.0 € | |
| 5 | 98.6 € | 102.8 € | 102.2 € | 100.2 € | 101.1 € | 102.6 € | 100.7 € | 100.6 € | |
| 6 | 102.9 € | 101.4 € | 93.5 € | 96.2 € | 100.6 € | 101.6 € | 106.5 € | 93.4 € | |
| 7 | - | 95.2 € | - | - | 91.4 € | 96.3 € | - | ||
| Ø | 95.1 € a1 | 100.0 € a | 97.9 € a | 99.1 € a | 97.2 € a | 100.0 € a | 98.8 € a | 99.9 € a | |
| 1 Different lower case letters indicate a statistical difference at α = 5% in means between treatments (OFF and ON) based on Fisher’s LSD test. | |||||||||
Reducing the groups used for comparison, further significant differences between OFF and ON were observed. The revenue of the automatic bucking exceeded the revenue of the manual bucking in every case. Except for the category of the motor-manually felled trees and the category of the trees with broken tops, all revenue differences were statistically significant between treatments. The values of the trees with broken tops equaled to a differential amount of 1.2 €/m3 (Table 10). There was a maximum difference of 4.1 €/m3 observed between the two groups without broken tops (undamaged). Over all subgroups, a statistically different mean monetary surplus of 3.3 €/m3 equaling 3%, resulted from the use of automatic treatment as compared to manual bucking. Similar to harvesting productivity, a linear multivariate regression was also performed for the revenue using the same independent variables (volume and treatment). The rate of the variance explained by the model did not reach 0.5, maximum R2 was 0.32 for the group “fully-mechanized”. The variable “volume” could explain at maximum 26% of the variance in the group “fully-mechanized”. In contrast, the influence of the variable “treatment” was relatively low where only 3% (“semi-mechanized”) to 5% (“fully-mechanized”) of the variance was explained. In total (“total”), 23% of the variance could be explained by the volume and only 4% by the treatment (R2: 0.28).
| Table 10. Mean revenue [€/m3] per harvesting system, tree shape, and treatment; harvested trees with pre-inventory data. | ||||
| Harvesting system | Treatment | Difference | Proportional difference to revenue treatment OFF (%) | |
| OFF | ON | |||
| Fully-mechanized | 95.8 €/m3 a1 | 99.7 €/m3 b | +4.0 €/m3 | 4 |
| Semi-mechanized | 97.8 €/m3 a | 100.0 €/m3 a | +2.2 €/m3 | 2 |
| Undamaged | 95.9 €/m3 a | 100.0 €/m3 b | +4.1 €/m3 | 4 |
| Damaged | 98.3 €/m3 a | 99.5 €/m3 a | +1.2 €/m3 | 1 |
| Total | 96.6 €/m3 a | 99.9 €/m3 b | +3.3 €/m3 | 3 |
| 1 Different lower case letters indicate a statistical difference at α = 5% in means between treatments (OFF and ON) within a respective attribute based on Fisher’s LSD test. | ||||
4 Discussion
4.1 Product recovery
A significant difference in the relative product recovery was manifested within the fully-mechanized system (treatment OFF), where product recovery for damaged trees was 7% lower than for undamaged trees. A priori, we believed this could be explained by the identification of five trees where crowns were not processed completely during the operations, thereby reducing the recovered volume. Despite an intensive examination of the video footage to try and identify what happened to those respective trees, no affirmative clues could be detected. However, removing the respective five trees from the analysis did not affect the average recovery, which remained constant at 65%.
The relative product recovery from both treatments was quite similar. However, the treatment OFF performed slightly better for the entire comparison (70% versus 68%) and a statistically significant difference in favor of OFF treatment was linked to trees that were not damaged. When using quality bucking, the operator was able to extract a higher merchantable volume (diameter > 7 cm) per tree as compared to the automatic bucking even though the latter could produce a higher net value. This could occur since the objective of the optimization system was to maximize value per stem and not product recovery. The motives of the operator were more diverse: i) attempt to reduce the amount of waste material and ii) work in a resource-efficient manner while following best practice guidelines. In comparison to the optimization software, the operator’s strength to consider several interests simultaneously could be perceived in both a positive and negative light. Positive in the sense that when focusing on a single target, which is the case for automatic bucking, other factors are not taken into consideration which simplifies the task and negative since the multi-facetted approach by the operator can make it more difficult to maximize value per tree. In all cases, operator experience holds great importance and should not be discounted.
In general, relative product recovery calculated in this study seemed to be somewhat low with maximum values of around 70%. This is likely caused by potential errors in accuracy linked with pre-harvest inventory height measurements with the use of the digital height, distance and inclination instrument.
4.2 Harvesting productivity
The calculated harvesting productivity in this study was on a high level. When considering the entire dataset, the higher frequency of motor-manually felled trees in the ON treatment plots has to be considered because of the time reduction per cycle entailed by having pre-felled trees. The motor-manual support could indeed rise the harvester’s performance by approx. 26% (OFF) and 18% (ON) compared to the fully-mechanized system. Contrary to the opinion of Heindl (2006), even with motor-manual felling the productivity declined beyond a single-tree volume of about 3–3.5 m3 without bark (Fig. 5). The unexpected increase of the performance of the manual bucking in damaged stems may be attributed to their 0.2 m3 higher single-tree volume. Walsh (2012) found a 9% increase in harvester productivity using an optimization software in a radiata pine stand, which corresponds well with results from our study.
Most publications dealing with the productivity of harvesters concentrate on clearly smaller dimensioned stands. Neither the mass per tree nor the machine used are comparable to the conditions of this study. All the better it is to have performance indices of the same operator working with his accustomed harvester in a similar stand. This is the case for this study and the one by Labelle and Windisch (2016) using a TimberPro 620-E single-grip harvester. The TimberPro 620-E and the Ponsse Bear belong to the same category regarding engine power and the specifications of the harvesting head LogMax 7000 conforms to the features of the H8. With a mean single-tree volume of 1.18 m3 without bark (clear-cut) and 2.03 m3 without bark (thinning), harvesting productivities of 34.5 m3 PMH0–1 and 29.9 m3 PMH0–1, respectively were reported for Norway spruce (only fully-mechanized harvested trees) in Labelle and Windisch (2016). The performance in the clear-cut corresponded to the results of the subgroup “fully-mechanized-undamaged”, treatment OFF. In the thinning, the result ranked at the lower end of the range and could be explained by the higher travel time with the TimberPro.
Feller et al. (1997) estimated the performance of the tracked harvester IMPEX 1880 “Hannibal”, while harvesting tree-length material in a spruce stand with a mean dbh of 40 cm, at slightly above 41 m3 PMH15–1. In the study of Schöttle et al. (1998), the same harvester was only able to reach 28.8 m3 PMH15–1 without bark in a marginally higher average diameter stand combining cut-to-length and tree-length assortments. Heindl (2006) observed a maximum performance level of 38 m3 PMH12.5–1 without bark with a wheeled Valmet 941 single-grip harvester (cut-to-length, 2 m3 without bark mean single-tree volume). All these harvesting productivity values are situated in the bottom third of the results of the present study.
Variation in harvesting productivity increased as tree dbh and volume increased. This trend was also shown by Metz (2012) combining various publications. In his view, the specialization of different machine-combinations to a certain field of application causes the increasing variance in the performance (Metz 2012). That indeed does not explain why the different systems are so close to each other in the lower diameter and volume range. It is more likely that differences referring to shape and position of the trees to the harvester can be more easily normalized by the technique presented in this paper. The stronger and more vigorous the tree, the more influence the individual characteristics and dimensions of the single-tree have. An even slightly thicker and more pronounced root collar with an identical diameter otherwise can lead to more movements with the harvesting head during the felling task. On the other hand, a marginal tree can form large diameter branches, which cannot be felled in a single motion or without gaining momentum.
4.3 Distribution of assortments and revenue recovery
The average revenues per m3 showed higher variation within the manual bucking (between 95.1 € and 98.8 €) than within the automatic bucking treatment (99.1 € and 100.0 €). This finding can be explained by the more complex decision behavior of the operator when using manual bucking. The optimization exceeded the manual bucking for every comparison of the four subgroups of both treatments and the difference was significant in the group “fully-mechanized-undamaged”. The assumption of Labelle et al. (2017) that the use of an optimization software would improve the revenue situation in spruce dominated stand was validated by the present study where an average and statistically significant gain of 3 €/m3 (+ 3%) was found. These findings are very similar to those reported by Walsh (2012) where a 3% increase in the value of radiata pine logs was measured when using automatic bucking. Olsen et al. (1991) and Conradie et al. (2003) reported an increase of 10% up to 19.6% in value recovery between automatic and quality bucking. In particular, the analysis of the cut assortments provided insight into the occurrence of the difference between OFF and ON treatments. The automatic bucking differentiated from the result of the manual bucking by three substantial characteristics: 1 – reduction of the proportion of 5 m logs and large diameter sawlogs, 2 – increase of the proportion of 4 m logs, and 3 – reduction of the proportions of pallet- and pulpwood.
The proportion of pulpwood was within a similar range. Whereas the shift in the direction of shorter sawlog segments can be linked to improved bucking by the software, the clear decline of the rate of low-value assortments is not linked to obvious reasons. Pallet-, pulpwood and non-merchantable segments were bucked because of dimensional constraints on the one hand, and on the other hand by reason of qualitative defects. Latter factors are not detectable by the measurement devices of the harvester and are thereby only controllable by the machine operator.
In 112 of 266 cases (entire collective treatment OFF), a pallet-, pulpwood or non-merchantable segments were initially cut from the ground-end of the stem. During the treatment ON this only happened 10 times. Hence, the texture of the wood (healthy vs. rotted) in the plots of treatment OFF would have to be worse or alternatively the quality was similar and the operator did not intervene in the bucking decision of the optimization system. Both cases remain unlikely on this scale. A third case was the operator’s habit to first buck one of these three assortments when certain signs appeared based on his operational routine.
Requirements of the customer and the manager, which can lead to a change of the assortment distribution in the direction of 5 m sawlog, have some influence in the bucking decision of the operator. When discussing with the responsible forester, he indicated a preference for a higher proportion of 5 m sawlogs. Thereafter it was understandably difficult to hide this statement and to make an impartial choice only considering the criterion of the revenue. The entrepreneur himself aimed to reach the highest harvesting productivity possible. Fewer cross-cut per stem, through a preference for 5 m long logs, can positively impact productivity. Conradie et al. (2003) found a similar result in favor of fewer and longer segments comparing to the pattern of the optimal bucking.
5 Conclusion
Harvesting operations influence all subsequent processing steps, starting with the logging and piling of the logs at the landing up to the transport to the saw-mill and ensuing processing. Due to the utmost importance of bucking activities in mechanized harvesting operations along with the comprehensive list of potential assortment and diameter combinations, the use of optimized bucking algorithms available in OBC is gaining popularity in German forestry. Despite some operational challenges linked to maintaining a continuous cover forest with mixed species composition and different age cohorts, the use of optimized bucking (ON) on harvesting productivity, product recovery, and value recovery was assessed and compared to quality bucking (OFF) both performed in a spruce dominated stand in Bavaria, Germany. In summary, the following points based on this study are made:
- Product recovery from both treatments did not differ significantly except for the comparison of trees with undamaged stems in which case a 4% higher product recovery was observed for manual bucking.
- Revenue of products stemming from the automatic bucking was higher than for manual bucking in every comparison. The finding was significant for fully-mechanized felled trees and those without breakages (4% higher revenue of the treatment ON in relation to the treatment OFF) or both combined. There was a 3% surplus independent of the method of felling and the shape of the trees.
- Harvesting productivity in the automatic treatment was higher. Significant differences pertained to those subgroups, which had statistically significant differences in the revenue too.
Based on our results, two essential practice related recommendations follow:
- Using the optimization software with the aim to maximize the value of the single-stem is an asset concerning comparable, spruce-dominated stands. Negative impacts are conceivable if sole consideration is to maximize product recovery with less regard for value.
- The higher the proportion of trees harvested with a fully-mechanized system the better since manual felling reduced the potential benefit of the optimization.
The results of the present study can showcase the feasibility of utilizing optimized bucking solutions from harvester OBC in close-to-nature and continuous cover forestry and promote an increased usage, particularly in spruce dominated stands.
Acknowledgements
This work was supported by the Assistant Professorship of Forest Operations at the Technical University of Munich. The authors first wish to extend gratitude to Wolfgang Mayer and Norbert Harrer. The underlying study would not have been possible without their willingness to participate. We also thank Moritz Bergen for his support during the beginning of the time study as well as Dr. Johannes Windisch and Dr. Herbert Borchert for assistance with data analysis. The authors also extend gratitude to the anonymous reviewers for their insightful comments and suggestions to improve the quality of the article.
References
Bayerische Staatsforsten AöR (2016). 2015: Bayerische Staatsforsten Statistikband. [2015: Bavarian State Forest Statistics book]. Regensburg.
Boston K., Murphy G. (2003). Value recovery from two mechanized bucking operations in the Southeastern United States. Southern Journal of Applied Forestry 27(4): 259–263.
Conradie I.P., Greene W.D., Murphy G. (2003). Value recovery with harvesters in southeastern USA pine stands. In: Wide M.I., Baryd B.(eds.). Arbetsrapport. Raw material utilization. Uppsala. p. 55–63.
Dems A., Rousseau L.-M., Frayret J.-M. (2013). Effects of different cut-to-length harvesting structures on the economic value of a wood procurement planning problem. Annals of Operations Research 2015(232): 65–86. https://doi.org/10.1007/s10479-013-1336-1.
Faaland B., Briggs D. (1984). Log bucking and lumber manufacturing using dynamic programming. Management Science 30(2): 245–257. https://doi.org/10.1287/mnsc.30.2.245.
Feller S., Weixler H., Pausch R. (1997). Holzernte in Fichtenaltbeständen mit einem Raupenharvester. [Wood harvesting in spruce stand with a tracked harvester]. AFZ-Der Wald 52(9): 478–481.
Geerts J., Twaddle A. (1984). A method to assess log value loss caused by crosscutting practice on the skidsite. New Zealand Journal of Forestry Science 29(2): 173–184.
Habereder R. (2015). Vorstellung des Forstbetriebes Kelheim. [Presentation of the Forest division Kelheim]. Exkursionshandout, Kelheim.
Heindl U. (2006). Studie zum “Königsbronner Harvesterverfahren” mit dem Radharvester VALMET 941 im Großhaager Forst. [Study on the “Königsbronner Harvesterverfahren” with the Valmet 941 wheeled harvester in the Großhaager forest]. Diplomarbeit. Technische Universität München, Freising.
Kivinen V.-P. (2004). A genetic algorithm approach to tree bucking optimization. Forest Science 50(5): 696–710.
Kivinen V.-P. (2007). Design and testing of stand-specific bucking instructions for use on modern cut-to-length harvesters. Dissertation. University of Helsinki, Helsinki. 65 p.
Kivinen V.-P., Uusitalo J. (2002). Applying fuzzy logic to tree bucking control. Forest Science 48(4): 673–684.
Kohnle U. (2015). Fichte im Klimawandel – was tun? [Spruce in climate change – what to do?]. FVA-einblick 19(3): 13–16.
Labelle E.R., Windisch J. (2016). Productivity of a single-grip TimberPro 620 harvester with a LogMax 7000 harvesting head in a beech dominated stand. In: From theory to practice: challenges for forest engineering. Proceedings and abstracts of the 49th symposium on forest mechanization. p. 77–82.
Labelle E.R., Bergen M., Windisch J. (2017). The effect of quality bucking and automatic bucking on harvesting productivity and product recovery in a pine-dominated stand. European Journal of Forest Research 136(4): 639–652. https://doi.org/10.1007/s10342-017-1061-4.
Laroze A. (1999). A linear programming, tabu search method for solving forest-level bucking optimization problems. Forest Science 45(1): 108–116.
Liski E.P., Nummi T. (1995). Prediction of tree stems to improve efficiency in automatized harvesting of forests. Scandinavian Journal of Statistics 22(2): 255–269.
Mantau U. (2012a). Holzrohstoffbilanz Deutschland: Entwicklungen und Szenarien des Holzaufkommens und der Holzverwendung von 1987 bis 2015. [Production trade and use balance in Germany: Developments and scenarios of timber production and use of wood from 1987 to 2015]. Hamburg.
Mantau U. (2012b). Is there enough wood for Europe? Thinkforest, Hamburg.
Marshall H. (2005). An investigation of factors affecting the optimal output log distribution from mechanical harvesting and processing systems. Dissertation. Oregon State University, Oregon.
Marshall H. (2007). Log merchandizing model used in mechanical harvesting. In: Weintraub A., Bjørndal T., Epstein R., Miranda J., Romero C. (eds.). International Series In Operations Research and Management Science: Vol. 99. Handbook of operations research in natural resources. Springer Science+Business Media LLC, Boston, MA. p. 379–389. https://doi.org/10.1007/978-0-387-71815-6_19.
Metz S. (2012). Literaturanalyse und Vergleich von Zeitstudienergebnissen bezüglich Zeitbedarf und Produktivität von Harvestern. [Literature analysis and comparison of time study results in terms of time needed and productivity of harvesters]. Bachelor-thesis. Technische Universität München, Freising.
Murphy G. (1987). An economic analysis of final log manufacturing locations in the steep terrain Radiata pine plantations of New Zealand. Dissertation. Oregon State University, Oregon.
Olsen E., Pilkerton S., Garland J., Sessions J. (1991). Computer aided bucking on a mechanized harvester. International Journal of Forest Engineering 2(2): 25–32. https://doi.org/10.1080/08435243.1991.10702625.
Pnevmaticos S.M., Mann S.H. (1972). Dynamic programming in tree bucking. Forest Products Journal 22(2): 26–30.
Referat Forst- und Jagdhoheit (2011). Leitfaden zur Vorratsermittlung von Waldbeständen und zur Bewertung forstrechtlicher Sachverhalte. [Guideline for inventory determination of forest stocks and assessment of forest legal issues]. Halle (Saale).
Schöttle R., Pfeil C., Kapahnke F. (1998). Vollmechanisierung der Holzernte schreitet auch im Starkholz voran: Einsatz von Starkholz-Raupenharvestern in naturverjüngten Altholzbeständen. [Full mechanization of wood harvesting is also progressing in the field of hardwoods: the use of tracked harvesters in naturally regenerated old growth hardwood forests]. AFZ-Der Wald 53(19): 981–984.
Sessions J. (1988). Making better tree-bucking decisions in the woods. Journal of Forestry 86(10): 43–45.
Sessions J., Garland J., Olsen E. (1989). Testing computer-aided bucking at the stump. Journal of Forestry 87(4): 43–46.
Uusitalo J. (2010). Introduction to forest operations and technology. JVP Forest Systems Oy, Tampere.
Uusitalo J., Kokko S., Kivinen V.-P. (2004). The effect of two bucking methods on Scots pine lumber quality. Silva Fennica 38(3): 291–303. https://doi.org/10.14214/sf.417.
Visser R., Spinelli R., Saathof J., Fairbrother S. (2009). Finding the “Sweet-Spot” of mechanised felling machines. 2009 Council on Forest Engineering (COFE) Conference Proceedings: “Environmental Sound Forest Operations“, Lake Tahoe.
Walsh D. (2012). Quantifying the value recovery improvement using a harvester optimiser. CRC for Forestry 26: 1–4.
Total of 33 references.
Send to email
