Jaakko Repola  ,
Hannu Hökkä,
Hannu Salminen
,
Hannu Hökkä,
Hannu Salminen
Models for diameter and height growth of Scots pine, Norway spruce and pubescent birch in drained peatland sites in Finland
Repola J., Hökkä H., Salminen H. (2018). Models for diameter and height growth of Scots pine, Norway spruce and pubescent birch in drained peatland sites in Finland. Silva Fennica vol. 52 no. 5 article id 10055. https://doi.org/10.14214/sf.10055
Highlights
- Tree growth strongly correlated with site drainage status
- Between-tree competition had a higher impact on tree diameter growth than on height growth
- Growth predicted by the constructed models were calibrated using NFI11 data to ensure generally applicable growth predictions level in whole country.
Abstract
The aim of this study was to develop individual-tree diameter and height growth models for Scots pine, Norway spruce, and pubescent birch growing in drained peatlands in Finland. Trees growing in peatland sites have growth patterns that deviate from that of trees growing in mineral soil sites. Five-year growth was explained by tree diameter, different tree and stand level competition measures, management operations and site characteristics. The drainage status of the site was influencing growth directly or in interaction with other variables. Site quality had a direct impact but was also commonly related to current site drainage status (need for ditch maintenance). Recent thinning increased growth of all species and former PK fertilization increased growth of pine and birch. Temperature sum was a significant predictor in all models and altitude for spruce and birch. The data were a subsample of the 7th National Forest Inventory (NFI) sample plots representing northern and southern Finland and followed by repeated measurements for 15–20 yrs. Growth levels predicted by the models were calibrated using NFI11 data to remove bias originating from the sample of the modelling data. The mixed linear models technique was used in model estimation. The models will be incorporated into the MOTTI stand simulator to replace the current peatlands growth models.
Keywords
Pinus sylvestris;
Picea abies;
Betula pubescens;
drained peatlands;
forest drainage;
mixed model;
tree growth model
-
Repola,
Natural Resources Institute Finland (Luke), Natural resources, Eteläranta 55, FI-96300 Rovaniemi, Finland
E-mail
jaakko.repola@luke.fi
- Hökkä, Natural Resources Institute Finland (Luke), Natural resources, Paavo Havaksen tie 3, FI-90014 University OF Oulu, Finland E-mail hannu.hokka@luke.fi
- Salminen, Natural Resources Institute Finland (Luke), Natural resources, Eteläranta 55, FI-96300 Rovaniemi, Finland E-mail hannu.salminen@luke.fi
Received 9 October 2018 Accepted 30 November 2018 Published 13 December 2018
Views 142087
Available at https://doi.org/10.14214/sf.10055 | Download PDF

1 Introduction
In Finland, about 5.5 M hectares of peatlands and paludified mineral forests have been drained since 1930s in order to increase productive forest land area and enhance growth of trees in peatland forests (Päivänen and Hånell 2012). Digging of ditches initiates a chain of processes in the soil such as lowered ground water table level, better oxygen availability, higher microbial activity, enhanced mineralization of nutrients (Campbell 1980; Lähde 1969; Lieffers 1988), which is manifested as increased tree growth after drainage (Seppälä 1969; Hånell 1988). It has been estimated that forest drainage activity has increased the annual increment of Finnish forests by 20 M m3 by 1990s (Hökkä et al. 2002).
Predicting the future growth of peatland trees is more challenging than predicting growth of trees growing in mineral soil sites. The most important difference is that on peatlands the site conditions cannot be assumed constant over time. Post-drainage release growth varies by site quality and geographical location and may be moderate or remarkable, depending on the water conditions before drainage (i.e., site type), as shown by Seppälä (1969) and Hökkä and Ojansuu (2004). The change in site productivity following drainage creates a nonlinear pattern in tree growth as a function of time (Hånell 1988). After drainage, site water conditions do not remain stable for decades because ditches tend to erode and become blocked by vegetation (Paavilainen and Päivänen 1995), which may rise the water table level again and affect tree growth (Heikurainen 1980). In practical forestry this has been compensated for by ditch network maintenance operation, i.e., by cleaning the ditches or by digging additional ditches (Sikström and Hökkä 2016). Both the deterioration of ditches (Heikurainen 1980) and ditch network maintenance have their influence on tree growth (Hökkä et al. 1997, 2000; Hökkä and Kojola 2003).
Another related phenomenon is the interdependence between site water conditions, tree stand water use capacity (interception and transpiration), and tree growth (Penner at al. 1995; Jutras et al. 2006; Hökkä et al. 2008). It has been shown that higher stand stocking maintains good drainage status of the soil by its water use thus resulting in a feed-back of better growth rate of the trees (Hökkä et al. 2008, 2012b). Thus, in sufficiently high-stocked stands ditch network maintenance may not be seen as increased growth rate of trees (Sarkkola et al. 2012). This also means that, e.g., thinning of a peatland stand has a direct positive impact on tree growth due to increased growing space, but it may have an indirect decreasing effect due to rising water table level because of lowered stand water use rate, which, in turn, is proportional to the removed volume.
The third complex point is site nutrition. Because peat is formed of more or less decomposed plant residues, it is generally rich in nitrogen (N) but lacks mineral nutrients like phosphorus (P) and potassium (K). Despite a good initial response to drainage, severe imbalance between nitrogen and potassium in peat soil may start to limit tree growth considerably (Moilanen 1993; Silfverberg and Moilanen 2008) in originally poorly stocked, deep-peated and wet sites. In practical forestry in Finland, fertilization has been widely used to treat nutrient imbalances especially in the 1970s. Applying PK fertilizers or wood ash in a N-rich peatland site can have a highly remarkable, long-lasting increasing effect on stand growth (Hökkä et al. 2012a; Moilanen et al. 2015).
Growth models for predicting tree growth in drained peatland sites have been constructed mainly in Finland (Miina et al. 1991; Miina 1994; Hökkä et al. 1997) and Sweden (Hånell 1988), but also in, e.g., Canada (Payandeh 1973) and Poland (Socha 2012). To be used in a stand simulator, growth models should be generally applicable for various locations and in situations including the above-mentioned temporal processes as well as forest management operations that may be encountered in practice. In the Finnish MOTTI stand simulator (Salminen et al. 2005; Hynynen et al. 2014) individual tree peatland growth models developed by Hökkä et al. (1997) and Hökkä (1997a) have been used for the last 20 years. Although they have been proven reliable in many studies (Nuutinen et al. 2000; Kojola et al. 2012; Ahtikoski et al. 2012), the weakness of those models is that, due to two different samples used to construct the modeling data, the less detailed information available from the Southern Finland data set (Hökkä 1997b) constrained the description of different effects in the models. The modeling data also represented peatland forests of 1980s, i.e., mainly small-dimension trees growing in young stands in sites drained 10–30 years ago. Further, the growth period of five years did not well manifest the temporal processes that are so common in peatland forest ecosystems. Since 1990s, the population of drained peatland trees has developed considerably (Korhonen et al. 2017).
The aim of this study was to develop a second generation individual-tree growth model family for drained peatland trees – Scots pine (Pinus sylvestris L.), Norway spruce (Picea abies (L.) Karst.) and pubescent birch (Betula pubescens Ehrh.) – being able to account for the above-mentioned effects related to the site productivity, stand development, and stand management. The data for this study were based on several re-measurements of the permanent growth plots set up in northern Finland in 1984–1988 and in southern Finland in 2001–2003. The new models should replace those of Hökkä et al. (1997) and Hökkä (1997a) in the MOTTI stand simulator.
2 Material
2.1 Sampling of the stands
The study material came from a network of permanent growth plots (SINKA) set up in drained peatland stands as described in Penttilä and Honkanen (1986). The SINKA plots were sampled by stratified systematic sampling from those 7th National Forest Inventory (NFI) sample plots that were located on drained peatlands. Sampling units were stands that were considered to be in satisfactory silvicultural condition and homogeneous with respect to site and stand developmental stage.
In the first stage, SINKA sample plots were established only in northern Finland in 1984–1988 (Penttilä and Honkanen 1986). Due to the structure of the drained peatland forests in northern Finland, young pole age pine stands became overrepresented in the data. To correct this, their proportion was reduced by randomly decreasing their number by 20% after the second measurement and by another 20% after the third measurement. In 2001–2003 the SINKA sample was completed by establishing new plots in southern Finland by utilizing the same NFI7 sampling frame. After these operations different age and size classes and different geographical regions in the whole SINKA data became more evenly represented.
The field measurements were carried out in 1984–2013 in northern Finland and in 2001–2013 in southern Finland. The plots were measured 2–4 times with a five-year interval (five growing seasons). The total monitoring period of the plots (consisting of 1–4 five-year growth periods) varied from five to 20 years, being mostly (63%) 15 or 20 years. The number of stands was 601 in the first five-year period, but it decreased to 439 in the second and to 290 in the third growth period as a consequence of clear-cuts and dropping off part of the northern young stands from the sample.
The sampled stands represented a wide range of stand and site conditions in the field (Table 1). Because the location of the plots was hidden from the land owner, a variety of forest management actions found in practice was also represented. The plots were concentrated in north and central Finland, and there were gaps in the northernmost and southern part of country (Fig. 1). The long-time average annual effective temperature sum (degree-days with +5 °C as the threshold, period 1981–2010) varied between 735 and 1385 dd°C , with a mean of 993 dd°C (Fig. 2).
| Table 1. Stand characteristics at the time of establishment (in first measurement) and at the beginning of the last growth period. | ||||
| First measurement | Last measurement | |||
| Mean, (std) | Range, min–max | Mean, (std) | Range, min–max | |
| N, ha | 1819 (1101) | 174–11426 | 1624 (855) | 315–7474 |
| G, m2 ha–1 | 13.7 (7.6) | 0.6–34.9 | 16.6 (7.4) | 1.3–40.0 |
| D, cm | 12.4 (4.1) | 4.3–31.7 | 14.4 (3.9) | 6.5–26.9 |
| Hdom, m | 10.8 (3.9) | 2.8–24.8 | 12.5 (3.9) | 3.4–24.4 |
| N = Number of stems per hectare, G = stand basal area, D = mean diameter at breast height (weighted by tree basal area), Hdom = stand dominant height (mean height of trees with diameter larger than the basal area median diameter). | ||||
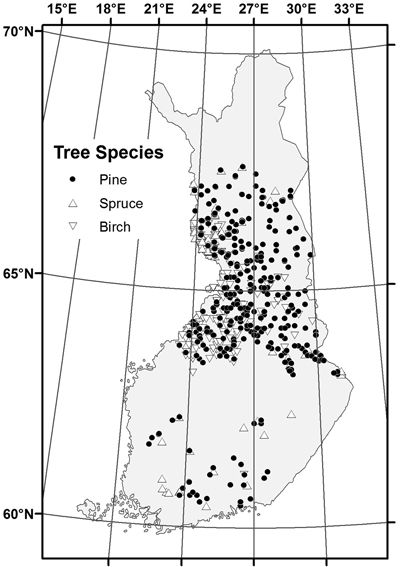
Fig. 1. Location of the sample stands by dominant tree species.
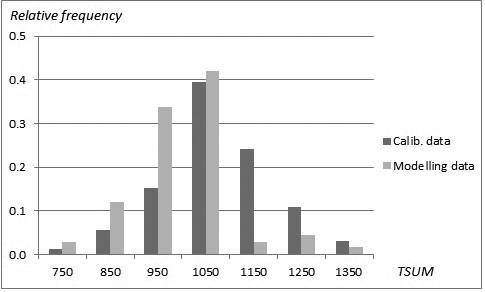
Fig. 2. Distribution (relative frequency) of stands in the modelling data (SINKA) and calibration data (NFI11) as a function of temperature sum.
2.2 Sample plot design and measurements
A SINKA plot was composed of a cluster of three circular sample plots located 40 m apart. The size of the plots was adjusted according to the stand density varying from 28 to 1257 m2 in area (sum of plots 128–3771 m2) so that the whole SINKA plot contained approximately 100 tally trees (i.e., 33 tally trees in each plot). A sub-plot with size of 1/3 was superimposed on the tally tree plot and all trees from the sub-plot and three thickest trees on the tally tree plot were selected as sample trees. The target number of sample trees on each sub-plot was ten. All live trees over 4.5 cm in diameter in stands of past pole age and 2.5 cm otherwise were inventoried on tally tree plot with 1 cm accuracy (1 mm in sample tree plot). Tree age, as well as total height (h) and crown base height were measured from all trees within a smaller sample tree sub-plot. In addition to tree attributes, several variables describing the site properties, former management activities (thinning, fertilization, ditch network maintenance (DNM) and proposals for silvicultural actions in the future (e.g., need for DNM) were also recorded (Penttilä and Honkanen 1984).
In most of the stands the first-time drainage for forestry was made in the 1960s or 1970s, but the oldest drainage operations were carried out in 1910s. At the time of first measurement, DNM had been done in 141 stands (23%). Fertilization, mostly PK-fertilization (phosphorus and potassium) was carried out in 134 stands. Commercial thinning, pre-commercial thinning or other cuttings had been done in 297 stands. During the monitoring period, DNM was carried out in 92 stands and fertilization in 149 stands. Most of the stands (N = 383) were pine dominated, but a significant proportion of those stands were mixed stands, i.e., birch composed 13% and 26% of volume in stands considered pine or spruce dominated, respectively (Table 2).
| Table 2. Proportion of tree species (% of basal area) at establishment. | ||||
| Dominant tree species | Number of stands | Pine %, | Spruce % | Birch % |
| Scots pine | 383 | 82.7 (17.8–100) | 4.0 (0–45.2) | 13.0 (0–75.1) |
| Norway spruce | 63 | 7.4 (0–97.0) | 65.0 (1.0–100) | 26.1 (0–75.4) |
| Birch | 155 | 11.6 (0–58.7) | 6.8 (0–39.5) | 79.7 (20.9–100) |
2.3 Data management
The modelling data used in this study consisted of 11 533, 2386, and 6539 pine, spruce and birch sample trees, respectively (referring to the first measurement with 601 stands included). The sample trees represented a high variation in terms of dimensions and growth of each tree species (Table 3). Tree diameter growth at breast height (id5) and height growth (ih5) during a five-year period were obtained as a difference of the sample tree dimensions between successive measurements. The basic stand characteristics such as stand basal area (G m2 ha–1), stand stem number (N, ha–1), basal area weighted median diameter (Dg, cm), and stand dominant height (Hdom, m) were calculated for each plot with the KPL software (Heinonen 1994). Only variables which are available or can be derived from forest inventory data were used as potential independent variables. To reduce the bias related to small-size sample plots (Hynynen and Ojansuu 2003), all trees in the larger tally tree plot were used in calculating stand and tree characteristics (basal area, volume, etc.).
| Table 3. Mean and range of the sample tree characteristics by tree species. | ||||||
| Variable | Scots pine | Norway spruce | Birch | |||
| Mean | Range | Mean | Range | Mean | Range | |
| Diameter, cm | 11.8 | 1.6–39.0 | 12.9 | 0.6–48.7 | 10.6 | 2.0–33.7 |
| Height, m | 8.7 | 1.6–27.8 | 9.6 | 1.5–28.2 | 10.1 | 2.3–23.5 |
| Diameter growth 1, mm | 13 | 0–81 | 13 | 0–68 | 10 | 0–63 |
| Height growth 2, dm | 10.4 | 0–66 | 10.4 | 0–50 | 9.6 | 0–72 |
| Pine 3, % | 85.3 | 1.0–100 | 13.0 | (0–99) | 21.9 | 0–99.4 |
| Spruce 3, % | 3.6 | 0–92.7 | 56.2 | 2.9–100 | 10.7 | (0–97.7) |
| Birch 3, % | 10.9 | 0–99.0 | 21.9 | 0–99.4 | 66.2 | 0.6–100 |
| 1 Diameter growth at breast height during five years period, 2 height growth during the five years period, 3 proportion (%) of basal area (m2). | ||||||
2.4 Site description used in the study
In the current Finnish drained peatland site type classification, drained sites are divided into two main groups, which are indicted by Roman numerals I and II (Laine 1989; Laine et al. 2012). The basis for the division of these groups are the pre-drainage properties of the peatland site type, like the composition of the ground vegetation and the wetness of the site, but also the main tree species and stand stocking in the natural state. So called genuine peatland sites (indicated by Roman numeral I when drained) are naturally productive forests with a rather dry surface and commonly a shallow peat layer. The so called composite sites (Roman numeral II) are naturally deep-peated, wet, and sparsely forested or treeless sites. In either group the dominating tree species can be Norway spruce or Scots pine. Group II sites can also be birch-dominated. However, spruce does not exist in the poorest fertility class (Table 4).
| Table 4. Distribution of study stands by drained peatland site types. | |||||
| Number of stands, N | Dominant tree species, N * | ||||
| Scots pine | Norway spruce | Birch | |||
| Rhtkg I | 74 | 8 | 17 | 49 | |
| Rhtkg II | 57 | 9 | 14 | 34 | |
| Mtkg I | 50 | 13 | 21 | 16 | |
| Mtkg II | 128 | 99 | 3 | 26 | |
| Ptkg I | 157 | 137 | 8 | 12 | |
| Ptkg II | 114 | 96 | - | 18 | |
| Vatkg | 21 | 21 | - | - | |
| Total | 601 | 383 | 63 | 155 | |
| * Number of stands. | |||||
Within the drained peatland site groups I and II, altogether five fertility classes are further distinguished (Laine et al. 2012) reflecting the decrease in peat nutrient pools along the fertility gradient (Westman and Laiho 2003) and described by the composition of the dominant surface vegetation: Herb-rich type – Vaccinium myrtillys type – Vaccinium vitis-idaea type – Dwarf shrub type – Cladonia type. According to Laine et al. (2012), a decreasing trend in the mean growth rate in the NFI10 sample plot data is found along this fertility gradient. The average peat thickness in these data was 70 cm (range: 7–200+ cm), being generally highest in poor mire sites. All SINKA stands are classified as forest land (average volume growth > 1 m3 ha–1 per year in 100 years rotation) at minimum.
In construction of the models, we utilized the division of I and II sites, because tree growth rhythm in these sites has been shown to be quite different (Hökkä and Ojansuu 2004) and also tested possible differences among the five fertility classes.
3 Methods
3.1 Modelling approach
In forest growth studies, the observations are commonly correlated spatially and/or temporally. In order to obtain efficient parameter estimates for the constructed model, it is important to correctly address the correlation structure of the data (Parresol 1999). In our study, the spatial correlation was due to the hierarchically structured data at stand, plot, and tree levels. Because the measurements had been performed two to four times for the same trees, also temporal correlation between the growth periods existed. Utilization of these correlations provides considerable efficiency gains in model estimation (McCulloch and Searle 2001).
The response variables of the models were five-year diameter growth (id5) and five-year height growth (ih5) of individual sample trees. To obtain normally distributed residuals with homogenous variance and to transform the model into linear form, logarithmic transformation was used. Before logarithmic transformation, a constant z was added when necessary to the observed growth variable. To account for cross-sectional and longitudinal data structure and obtain unbiased tests for variables at each level, the following linear mixed model (Searle 1987) with both fixed and random effects was formulated:
![]()
where yijkt is the response variable (id5 or ih5), a0 is the intercept, a, b and c are vectors of fixed regression coefficients, SITE is a vector of different site characteristics at stand level i, and PLOT is a vector of different stand characteristics at plot j level in stand i and TREE is a vector of tree characteristics in stand i in plot j in tree k, ui is the random effect of stand i, vij is the random effect of plot j in stand i, and eijkt is the residual error at period (time) t for plot j in stand i. The covariance structure of the successive five-year growth periods at a tree level was assumed to follow the first-order autoregressive (AR-1) structure. The random parameters (ui, vij) and residuals errors (eijkt) were assumed to be uncorrelated and to be identically distributed Gaussian random variables with a mean of 0, and also follow constant variances at each level.
Independent variables explaining growth described effects related to between-tree competition (e.g., basal area of trees larger than the target tree), stand structure and phase of stand development (e.g., stem number, dominant height), site productivity (e.g., site type groups and fertility classes, temperature sum, altitude) and forest management (e.g., DNM, thinning or fertilization) in combination with time since the last treatment.
The maximum likelihood (ML) method in the MIXED procedure of SAS (SAS Institute Inc. 1999) was used in the estimation of the models. Values that minimized the –2 × log-likelihood and gave minimum Akaike information criteria (AIC) for the whole model were chosen. Models residuals were then visually inspected, and possible trends related to explanatory variables were removed during the course of model construction via variable transformations. The aim was to formulate the models so that the predictions would be logical throughout the range of the material and logical values were obtained even outside the range of the modelling data, i.e., in cases where the models were extrapolated.
When applying the models, a variance correction term, (var(ui) + var(uij) + var(eijk))/2) should be added to the intercept to correct for bias due to the logarithmic transformation of the response variable. This correction factor tended to lead to an overestimation owing to the unsymmetrical distribution and the large variance in random parameters (var(ui) + var(uij) + var(eijk))). When overestimation was observed, an unbiased correction was performed by applying an empirical correction term:

where y is the measured growth, and ŷ is the fixed prediction of growth in logarithmic scale (Snowdon 1991). The unbiased prediction on the arithmetic scale is: ŷ = eln(ŷ) × c.
3.2 Calibration of the models with NFI10 data
To ensure growth predictions to be generally applicable and as unbiased as possible, a specific calibration procedure was conducted (see Hynynen et al. 2002, 2014). Growth levels predicted by the constructed models were calibrated using 11th National Forest Inventory data (NFI11) (2009–2013) which are the most recent and extensive whole country forest data available in Finland. The calibration data was composed of NFI11 sample plot stands located on drained peatlands with large range of tree variables (Table 5). The total number of sample plots was 4426 with the average annual effective temperature sum varying between 711 and 1365 dd°C, with a mean of 1074 dd°C (Fig. 2). The number of sample trees were 5249, 1770 and 318 for pine, spruce and birch, respectively. The actual ring width data was smoothed by using a 30-year-period in order to even out short-term variation caused by year-to-year changes in climate, and the resulting growth indices were introduced as observed values in to the calibration phase.
| Table 5. Tree variables in 11th National Forest Inventory data (NFI11). | ||||||
| Variable | Scots pine | Norway spruce | Birch | |||
| Mean | Range | Mean | Range | Mean | Range | |
| Diameter, cm | 17.1 | 1.0–47.0 | 17.5 | 1.1–50.2 | 13.1 | 0.6–41.3 |
| Height, m | 13.1 | 1.6–30.4 | 14.0 | 1.7–31.3 | 12.8 | 2.0–31.0 |
| Diameter growth 1, mm | 11 | 0–66 | 17 | 0–85 | 11 | 0–65 |
| Height growth 2, dm | 12.7 | 0–34 | 15.3 | 0–43 | 10.7 | 0.33 |
| 1 Diameter growth at breast height during five years period, 2 height growth during the five years period. | ||||||
In the calibration, the diameter growth of a NFI11 sample trees were species-wise predicted by the constructed models (1) and then the prediction bias – difference between observed and predicted values – was evaluated against the variables referring to variation in site and geographical location and climatic conditions (e.g., temperature sum, altitude, site fertility, sea and lake indices (Ojansuu and Henttonen 1983)). Biases were corrected to zero by developing calibration models, i.e., regression models for bias correction (see Hynynen et al. 2002, 2014). Calibration was carried out only for diameter growth models, because height growth information of individual trees in the NFI-data was considered too unreliable for calibration purposes. The constructed calibration model for diameter was estimated as follows:
![]()
where yij is the observed and ŷij the predicted diameter growth (id5, cm), a is a constant added when necessary to the response variable, β is a vector of fixed regression coefficients, Xij is vector of independent variables for tree j in plot i, wi is the random effect of plot i, εij is the residual error for tree j in plot i. In the application, calibrated growth prediction (id5calib) was obtained by adding the predicted bias to the initial prediction as follows:

4 Results
4.1 Diameter growth models
Before making logarithmic transformation, a constant having a value of 2, 4, and 4 were added to the five-year diameter growth of pine, spruce and birch, respectively (Table 6). Tree diameter at breast height, depicting the status of the tree, was a highly significant predictor of diameter growth for all tree species. The relationship was nonlinear and was expressed with a logarithmic transformation for pine and birch and an additional power term (3/2) for pine. For spruce linear and quadratic transformation (d2) proved to be the most suitable expression of d (Table 6).
| Table 6. Parameter estimates of models for diameter (id5, mm) growth of pine, spruce and birch. Standard error of the estimates is presented in parenthesis. | |||
| Pine ln(id5 + 2), mm | Spruce ln(id5 + 4), mm | Birch ln(id5 + 4), mm | |
| Variable | Estimate | Estimate | Estimate |
| Intercept | 3.035 (0.010) | 2.250 (0.139) | –7.332 (1.341) |
| d | 0.046 (0.004) | ||
| ln(d) | 0.987 (0.043) | 0.666 (0.041) | |
| d1.5 | –0.0011 (0.000) | ||
| d2 | –0.00071 (0.000) | ||
| ln(BA) | –0.271 (0.018) | –0.132 (0.024) | –0.172 (0.017) |
| BAL | –0.011 (0.003) | ||
| BAL2 | –0.00028 (0.000) | ||
| BALspruce | –0.022 (0.002) | ||
| BALdeciduous | –0.022 (0.001) | ||
| Hdom | –0.074 (0.004) | ||
| ln(Hdom) | –0.680 (0.054) | ||
| d/Hdom | –0.658 (0.034) | –0.564 (0.050) | |
| (d/Hdom)2 | –0.115 (0.015) | ||
| 1 – exp(–1 × (TS/1000)4) | 0.949 (0.092) | 1.228 (0.184) | |
| ln(TS) | 1.471 (0.193) | ||
| ALT | 0.00076 (0.000) | 0.0013 (0.0002) | |
| DR0-5 × TS≥1000 | 0.271 (0.043) | ||
| DR0-10 | 0.148 (0.024) | ||
| DR11-15 | 0.081 (0.015) | ||
| DR5-15 | 0.106 (0.012) | ||
| DR>20 | –0.075 (0.010) | –0.037 (0.011) | |
| DR>25 | –0.060 (0.017) | ||
| DNM0-5 | 0.052 (0.013) | ||
| DNM × TS<1050 | 0.092 (0.028) | ||
| DNMTS>800 × (Mtkg II, Ptkg) | 0.070 (0.019) | ||
| NDNM | –0.297 (0.036) | ||
| NDNM × ln(BA) | 0.090 (0.014) | ||
| THIN0-5 | 0.033 (0.012) | ||
| THIN6-10 | 0.044 (0.017) | ||
| Unthinned | –0.085 (0.022) | ||
| Rhtkg | 0.064 (0.027) | ||
| Rhtkg, Mtkg I × ln(d) | –0.076 (0.032) | ||
| Mtkg II, Ptkg × ln(d) | –0.112 (0.030) | ||
| Ptkg Ipoor × ln(d) | –0.024 (0.010) | ||
| Mtkg × Hdom | –0.0088 (0.004) | ||
| Ptkg × Hdom | –0.011 (0.004) | ||
| Vatkg × Hdom | –0.056 (0.008) | –0.049 (0.020) | |
| RIMPI | –0.442 (0.152) | ||
| PK<20 × (Mtkg II, Ptkg II) | 0.057 (0.018) | ||
| PK<25 × (Mtkg II, Ptkg II) | 0.239 (0.043) | ||
| var(ui) | 0.055 | 0.054 | 0.038 |
| var(vij) | 0.026 | 0.021 | 0.014 |
| corr(eijkt) | 0.288 | 0.363 | 0.391 |
| var(eijk) | 0.186 | 0.122 | 0.139 |
| d, tree breast height diameter (cm); BA = basal area (m2 ha–1); BAL, basal area of trees larger than the target tree (m2); BALspruce, basal area of spruce trees larger than the target tree (m2); BALdecidious, basal area of deciduous trees larger than the target tree (m2); Hdom, height of dominant trees (m); Dg, mean diameter weighted with tree basal area (cm); TS, temperature sum with a +5 °C threshold (dd); ALT, altitude, height above sea level (m a.s.l.); DRT1-T2, dummy variable for time from the last original ditching (T1 and T2 indicate time period in years); TS≥1000, dummy variable for area with temperature sum ≥ 1000 dd, DNMT1-T2, dummy variable for time from the last ditch network maintenance (T1 and T2 indicate time period in years); DNMTS>800, dummy variable for ditch network maintenance in the location with temperature sum > 800 dd; NDNM, dummy variable referring to need for ditch network maintenance; THINT1-T2, dummy variable for time from the last thinning (T1 and T2 indicate time period in years); Unthinned, dummy variable for stands with no thinning; Rhtkg, Mtkg I, Mtkg II, Ptkg I, Ptkg II and Vatkg, dummy variable of site type; Rhtkg, dummy variable for site types Rhtkg I and II, Mtkg, dummy variable for site types Mtkg I and II, Ptkg, dummy variable for site types Ptkg I and II; Ptkg Ipoor, dummy variable for the unfertile site types of Ptkg I (PSK, PKgK, PsR, KgR, PKR); RIMPI, dummy variable for the complementary site variables indicating the occurrence of flarks; PK<T, dummy variable for PK fertilization (phosphorus, potassium) with time since the treatment < T years; var(ui) variance od random stand effect; var(vij); variance of random plot effects; corr(eijkt) autocorrelation of the successive growth periods; var(eijk) error variance. | |||
The effect of between-tree competition on diameter growth was described with tree and stand variables, and their interactions. Logarithm of stand basal area (BA) represented a broad measure of competition (site occupancy) and when higher, it decreased growth of all species, mostly for pine (Table 6). The competition status of an individual tree in a stand was accounted for with basal area of trees larger than the target tree (BAL). In general, a high BAL indicated lower diameter growth of all tree species. For pine, all tree species were included in BAL, but for spruce and birch only basal area of larger spruce trees (BALspruce) or birch trees (BALdeciduous) were involved (Table 6). In the pine model, the second power of BAL was also used. Inter-tree competition was additionally described by different interaction effects between d and Hdom for all species. Dominant height (Hdom) indicating the phase of stand development was also used as a main effect and an interaction term with some of the drained peatland site type classes for all species. In general, higher dominant height indicated lower diameter growth for all tree species.
Increasing temperature sum had a clear increasing effect on tree diameter growth for all species; diameter growth was higher with a higher temperature sum. In the birch model, logarithmic transformation was made for temperature sum (TS) which produced almost linear response to growth. For pine and spruce the response was s-shaped and expressed with the nonlinear transformation:

where n is a constant determining the shape of the curve. Value for the power term n was obtained by the grid search method in which 4 was found to give the best fit for both species. Diameter growth response to TS was higher for spruce than for pine.
The site productivity was described with categorical variables, referring to drained peatland site types (Table 3). When necessary the site categories were combined or applied separately as dummy variables (group indicator variables). In general, drained peatland site type was not well explaining differences in intercept: a significant effect was found only in the birch model, in which site Rhtkg showed higher diameter growth than the other sites. For conifers, the interaction term with d and Hdom were used to describe the differences in productivity among the sites, or grouped sites. For pine, the site classes were grouped into four categorical variables (Rhtkg and Mtkg I, Mtkg II and Ptkg I-II, Ptkg Ipoor, Vatkg). The slope (interaction) effect with log(d) was used for all site type groups except Vatkg for which slope effect was described with Hdom. For spruce, the interaction effect with Hdom was used for combined class including three original site classes (Mtkg I-II, Ptkg I-II, Vatkg). Of the complementary site variables the abundant occurrence (>30% of surface area) of flarks (RIMPI) showed a significantly lowering effect in the model for pine.
The effect of drainage conditions (DR) on tree growth was accounted for by using dummy variables for five year time categories since original ditching (DR0-5, DR6-10, DR11-15, DR16-20, DR21-25, DR>25) or from last ditch network maintenance (DNM) operation (DNM0-5, DNM6-10, etc.). Additionally, a dummy variable indicating the observed need for ditch network maintenance (NDNM) was used. For pine and birch, three DR dummy variables showing decreasing diameter growth with increasing time since ditching, were applied (Table 6). For pine, a group indicator variable DR0-5 was applied in combination with another dummy, indicating region where the average temperature sum in the sample stand exceeded 1000 dd°C, and 0otherwise. For spruce, stands drained less than 25 years ago seemed to have equal growth, but DR>25 showed lower diameter growth rate.
The response to DNM was different for each trees species (Table 6). For pine, DNM0-5 indicated a higher level of growth. DNM showed a significant interaction with a region indicated by a temperature sum limit; with TS < 1050 dd°C growth of spruce was higher if DNM was done. For birch, if TS > 800 dd°C, DMN showed higher growth only in sites Mtkg II and Ptkg I-II.
For pine, stands showing need for ditch network maintenance (NDNM) had a lower diameter growth. The interaction between NDNM and BA was significant suggesting a compensating effect of high basal area in poorly drained sites (Table 6). For other species, NDMN was not significant.
The effects of thinning and fertilization were expressed in a similar manner as the DR variable. For pine, a thinning response was detected in stands which had been thinned 6–10 years earlier (THIN6-10). A dummy variable THIN0-5 increased diameter growth of birch. For spruce no time-dependence was found, but thinned stands grew better than un-thinned stands as indicated by a dummy variable (Table 6). Fertilization effect was detected for pine and birch; dummy variables PK<20 and PK<25 in combination with dummies for medium-productive II type sites (Mtkg II and Ptkg II) showed higher growth after fertilization for pine and birch for 20- and 25-year period, respectively.
In general, the variance of random effects in all levels was significant, and the tree level variance (eijk) was highest and plot level variance (vij) lowest in all models (Table 6). The variance of random effects was highest for pine at each level. For spruce, tree-level (eijk) variance was lowest (0.122) of all tree species. For birch, between-stand variance, ui (0.038) was lower than that of conifers. The total error variances, i.e., the sum of the variances of random effects of different levels (stand, plot and tree level) were 0.267, 0.197 and 0.190 for pine, spruce and birch, respectively. The correlation between the successive growth periods (eijkt) were statistically significant being 0.289, 0.363 and 0.395 for pine, spruce and birch, respectively.
4.2 Height growth models
Before logarithmic transformation, a constant having value 2 was added to the height growth of birch, while no addition was applied for pine and spruce. Tree height growth was nonlinearly related to diameter at breast height and this was described with a logarithmic transformation, ln(d) for all tree species and an additional term (d1.5) for spruce (Table 7).
| Table 7. Parameter estimates of models for height (ih5, dm) growth of pine, spruce and birch. Standard error of the estimates is presented in parenthesis. | |||
| Pine ln(ih5), dm | Spruce ln(ih5), dm | Birch ln(ih5 + 2), dm | |
| Variable | Estimate | Estimate | Estimate |
| Intercept | 0.841 (0.088) | –1.024 (0.268) | –14.659 (1.673) |
| d1.5 | –0.0021 (0.000) | ||
| ln(d) | 0.830 (0.042) | 0.937 (0.085) | 0.679 (0.052) |
| BAL | 0.015 (0.003) | ||
| BAL2 | –0.00085 (0.000) | ||
| BALspruce | –0.034 (0.006) | ||
| ln(BALspruce) | 0.121 (0.033) | ||
| BALdeciduous1.3 | –0.0060 (0.001) | ||
| Hdom | –0.091 (0.005) | –0.079 (0.005) | |
| d/Hdom | –0.760 (0.037) | –0.666 (0.120) | –0.753 (0.059) |
| N/d | –0.00022 (0.000) | ||
| ln(N) | 0.142 (0.021) | ||
| BIRCH | 0.196 (0.059) | ||
| 1 – exp(–1 × (TS/1000)4) | 1.965 (0.142) | 3.598 (0.442) | |
| Hdom × TS/1000 | –0.102 (0.026) | ||
| ln(TS) | 2.294 (0.240) | ||
| ALT | 0.0018 (0.0003) | ||
| DR0-5 × TS<1050 | –0.177 (0.083) | ||
| DR0-5 × Rhtkg | 0.226 (0.076) | ||
| DR5-15 × Mtkg, Ptkg | 0.118 (0.024) | ||
| DNM × TS<1050 | 0.320 (0.056) | ||
| DNM0-10 × Ptkg | 0.145 (0.032) | ||
| DNMTS>800 × (MtkgII, Ptkg) | 0.257 (0.020) | ||
| DNMTS>800 × Vatkg | 0.195 (0.048) | ||
| NDNM | –0.093 (0.017) | ||
| THIN6-10 | 0.082 (0.025) | ||
| MtkgII, PtkgI × ln(d) | –0.065 (0.018) | ||
| PtkgII × ln(d) | –0.083 (0.021) | ||
| Rhtkg × Hdom | 0.063 (0.027) | ||
| Mtkg, Ptkg × Hdom | 0.054 (0.027) | ||
| Vatkg × Hdom | –0.033 (0.009) | ||
| Rhtkg × PINE | –0.421 (0.095) | ||
| Rhtkg × Dg | 0.0093 (0.003) | ||
| Mtkg × Dg | 0.0065 (0.003) | ||
| PK0-15 × Ptkg | 0.130 (0.054) | ||
| PK5-20 × Mtkg II, Ptkg II | 0.094 (0.022) | ||
| var(ui) | 0.145 | 0.133 | 0.059 |
| var(vij) | 0.037 | 0.049 | 0.016 |
| corr(eijkt) | 0.042 | –0.103 | –0.014 |
| var(eijk) | 0.296 | 0.444 | 0.208 |
| c | 1.251 | 1.183 | 1.187 |
| d, tree breast height diameter (cm); BA, basal area (m2 ha–1); BAL, basal area of trees larger than the target tree (m2); BALspruce, basal area of spruce trees larger than the target tree (m2); BALdecidious, basal area of deciduous trees larger than the target tree (m2); Hdom, height of dominant trees (m); N, stem number per hectare; Dg, mean diameter weighted with tree basal area (cm); BIRCH, birch proportion of basal area (0-1); TS, temperature sum with a +5 °C threshold (dd); ALT, altitude, height above sea level (m a.s.l.); DRT1-T2, dummy variable for time from the last original ditching (T1 and T2 indicate time period in years); TS<1050, dummy variable for area with temperature sum < 1050 dd; ); DNMT1-T2, dummy variable for time from the last ditch network maintenance (T1 and T2 indicate time period in years); TS≥1050, dummy variable for area with temperature sum ≥1050 dd; DNMTS>800, dummy variable for ditch network maintenance in the location with temperature sum > 800 dd; NDNM, dummy variable referring to need for ditch network maintenance; THINT1-T2, dummy variable for time from the last thinning (T1 and T2 indicate time period in years); Rhtkg, dummy variable for site types Rhtkg I and II; Mtkg I, Mtkg II, Ptkg I, Ptkg II and Vatkg, dummy variables for drained peatland site types; Mtkg, dummy variable for site types Mtkg I and II; Ptkg, dummy variable for site types Ptkg I and II; PINE, pine proportion of basal area (0-1); PKT1-T2, dummy variable for time from the last PK fertilization (phosphorus, potassium) (T1 and T2 indicate time period in years); var(ui) variance of random stand effect; var(vij); variance of random plot effects; corr(eijkt) autocorrelation of the successive growth periods; var(eijk) error variance; c, empirical correction term. | |||
BAL with or without transformation was used to describe the competition status of an individual tree for all tree species. For pine, BAL, regardless of the species of the larger trees, showed first higher height growth with increasing BAL but then growth began to decrease with higher BAL values. The trend for spruce was similar but weaker, and only the BAL of spruce trees (BALspruce) was significant. For birch, only the basal area of larger deciduous trees (BALdeciduous) proved to be significant by resulting lower height growth with increasing BALdeciduous (Table 7).
For all tree species the between-tree competition was additionally described with an interaction term between d and Hdom (Table 7). The stand variables as the main effect were significant only in the pine and birch models. For pine, Hdom and proportion of birch (BIRCH) of basal area indicating positive effect on height growth were significant. In addition to Hdom, stem number (N) was included into the birch model.
For all tree species, TS had a positive effect on height growth (Table 7). The relation was described with the similar transformation for TS as used in the diameter growth models: logarithmic transformation for birch and s-shaped response for pine and spruce (Eq. 5). For birch, also altitude from the sea level (ALT) increased height growth.
Dummy variables explaining the intercept and interaction terms influencing the slope were used to describe the differences in productivity among sites. In the birch model, Ptkg (I and II combined) and Vatkg sites showed lower height growth than the other sites. The proportion of pine (PINE) had a negative effect on birch height growth in the most fertile sites (Rhtkg). Mean diameter (Dg) as interaction term showed positive height growth effect for Rhtkg and Mtkg. For conifers, the effect of site type was described with interaction of d and Hdom. For pine, three dummy variables, composing of different drained peatland sites (Mtkg II and Ptkg I, Ptkg II, Vatkg), were used. The slope effect with ln(d) was used in groups Mtkg II and Ptkg I, Ptkg II, and a slope effect with Hdom in site type Vatkg. For spruce, drained peatland site types were combined into three groups (Rhtkg, Mtkg and Ptkg combined, Vatkg). The interaction effect with Hdom was used in two groups (Rhtkg, Mtkg and Ptkg combined) to describe differences in height growth pattern among site types.
The effect of drainage status on height growth was described in a similar way than in diameter growth models, i.e., with the interaction of dummy variables DRt1-t2, DNMt1-t2 and site types and possibly with regions described by dummies based on TS categories. For pine, time from the original ditching (DR) was not significant for any age class, but NDNM indicating need for ditch network maintenance showed lower height growth (Table 7). For birch, dummy variable DR0-5 indicated higher growth in Rhtkg, and DR5-15 and the combined site type Mtkg and Ptkg. For spruce, DR0-5 showed lower growth in the region, where the average temperature sum was ≤ 1050 dd°C, i.e., in northern Finland.
The effect of DNM was not time-dependent for conifers. For pine former DNM operation showed higher growth with different strength of response in combined site type Mtkg II and Ptkg and in site type Vatkg in region with TS > 800. For spruce, DNM indicated significantly higher growth when TS was <1050 dd°C, i.e., in northern Finland. For birch, DNM0-10 was found significant in site type Ptkg (Table 7).
Thinning was not significant for pine and spruce height growth (Table 7). Dummy variables THIN6-10 indicated significantly better growth for birch, respectively. The effect of PK-fertilization, with interaction of site type was detected only for pine and birch. For pine, height growth showed to be higher for 5–20 years after PK-fertilization (PK5-20) in medium productive composite sites (Mtkg II, Ptkg II). PK-fertilization during the past ten years (PK0-10) increased height growth of birch in site type Ptkg.
The total error variances were 0.478, 0.626 and 0.283 for pine, spruce and birch, respectively. The random effects of the models for conifers and birch were not comparable because a constant was added for birch height growth before logarithmic transformation. Tree level variance (eijk) was clearly highest and plot level variance (vij) lowest in all models. The variances at the different levels were quite similar for pine and spruce. The correlation between the successive growth periods (eijkt) differed statistically from null for pine and spruce, and were very low for all tree species; 0.042, –0.103 and –0.014 for pine, spruce and birch, respectively.
Due to the large estimated error variances the correction factor var/2 tended to lead to overestimation of the height growth. A more robust correction term (c) was calculated from the data and resulted in 1.251, 1.183, and 1.187 as correction terms for pine, spruce and birch, respectively. The prediction can then be retransformed with the correction term as follows: y = c × eln(ŷ) (Snowdon 1991).
4.3 Calibration models
In the constructed models, almost non-significant differences in growth, especially as a main effect, were found among the site type groups and fertility classes. In the calibration data, however, a clearer trend in growth as a function of site quality was observed for all tree species. The need for calibration in the different site types was highest for birch, and especially in fertile site types (Rhtkg, Mtkg I and Mtkg II) (Fig. 3).
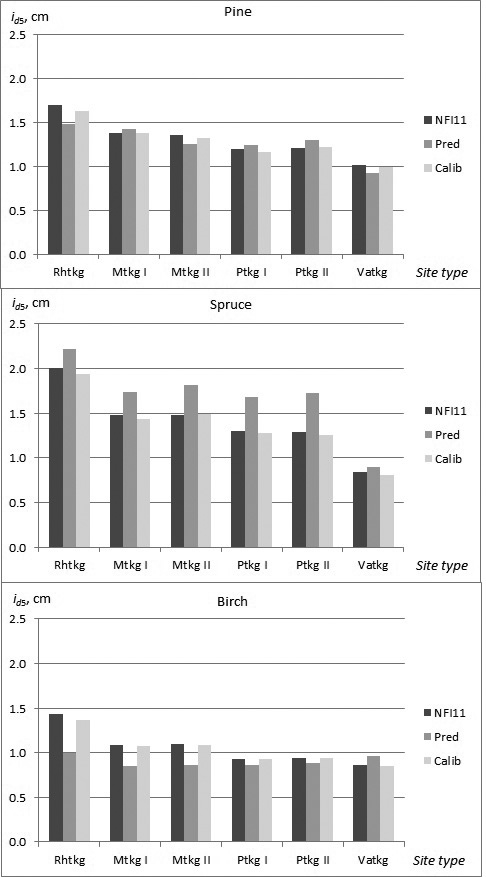
Fig. 3. Observed and predicted diameter growth of pine, spruce and birch in the calibration data (NFI11) in the different site types (NFI11; observed values, Pred; prediction obtained by the constructed model, Calib; prediction calibrated with NFI11).
The calibration process showed that the effect of temperature sum (TS) was overestimated in the constructed models for all tree species, especially for spruce with high temperature sum values (Table 8). Altitude (ALT) was also incorporated in the calibration model for all tree species. Sea index (SEA) and lake index (LAKE), referring to the proportional coverage of sea or lakes within a distance of 20 km radius showed positive effect on growth, sea index for pine and spruce, and lake index for birch. The effect of method of establishment (natural, seeded, planted) on tree growth could not be incorporated in the constructed models because the number of planted or seeded trees was very few in the modelling data. However, in the calibration data the effect of planting (PLANT) indicated clearly higher growth for pine and spruce, and for pine this effect was higher with lower temperature sum.
| Table 8. Parameter estimates of the calibration models for diameter growth (id5, cm) of pine, spruce and birch. Standard error of the estimates is presented in parenthesis. id5Pred is predicted growth. | |||
| Pine ln((id5 + 2)/(id5Pred + 2)), cm | Spruce ln((id5 + 1)/(id5Pred + 1)), cm | Birch ln((id5 + 1)/(id5Pred + 1)), cm | |
| Variable | Estimate | Estimate | Estimate |
| Intercept | 0.044 (0.035) | 1.011 (0.096) | –0.189 (0.217) |
| TS/100 | –0.0099 (0.003) | –0.095 (0.008) | –0.027 (0.007) |
| ALT/10 | 0.0014 (0.000) | –0.010 (0.002) | –0.0052 (0.001) |
| Rhtkg | 0.051 (0.013) | 0.646 (0.206) | |
| Mtkg I-II | 0.590 (0.206) | ||
| Mtkg II | 0.044 (0.008) | ||
| Ptkg I-II | –0.084 (0.020) | 0.510 (0.206) | |
| Vatkg | 0.051 (0.006) | 0.429 (0.208) | |
| LAKE | 0.308 (0.084) | ||
| SEA | 0.241 (0.072) | 0.381 (0.147) | |
| PLANT | 0.492 (0.107) | 0.327 (0.039) | |
| PLANT × (TS/100) | –0.037 (0.010) | ||
| var(uk + eik) | 0.028 | 0.081 | 0.076 |
| ALT, altitude, height above sea level (m a.s.l.); LAKE, lake index; referring to the proportional coverage of lakes within a distance of 20 km radius; SEA, sea index; referring to the proportional coverage of sea within a distance of 20 km radius. | |||
5 Discussion
5.1 Material
In this study empirical models for stand simulator purposes were compiled for diameter and height growth of Scots pine, Norway spruce, and pubescent birch growing in drained peatlands in Finland. Specific peatland growth models are justified because factors determining growth of trees as well as trees responses to management operations are not similarly important in drained peatlands and mineral soils. Some management actions are specific for peatlands only (especially ditch network maintenance and PK-fertilization). For models used in forest simulator, an ideal data would be a representative sample of the forests in the region in which the models will be applied. But at the same time, the data should cover a wide range of site conditions in order to have a high variation in independent variables, which is a prerequisite for reliable parameter estimates (Wykoff 1990; Lappi 1993). Third, capturing the temporal growth dynamics presumes longitudinal data instead of survey data. For these reasons we chose the SINKA data base (Penttilä and Honkanen 1986) formerly used by e.g., Hökkä (1997b) but after rearranging the sample and including southern Finland peatland growth plots which were established in early 2000s. Furthermore, several five-year growth periods from most of the plots were used for utilizing the time-series information of the modeling data. The monitoring periods of mainly 15–20 years gave a more reliable description of growth dynamics than the chronosequence data used in the previously published growth models (Hökkä 1997b).
5.2 Model specification
Models applied in growth simulators should have only commonly measured or easily predictable variables that can be derived from forest inventory data (Wykoff 1990). Growth dynamics of a tree was described by using variables related to tree size and status, between-tree competition, site productivity, stand structure, and different management treatments (thinning, ditching, or fertilization). Although the following discussion is trying to address the role of different effects, it is important to bear in mind that their coefficients are conditional to the whole model and thus they do not solely represent independent effects of one factor.
Generally, tree age and size are tightly connected (Assmann 1970), but in peatland trees this dependency is weaker due to high within-stand (spatial) variation in growth conditions causing high variability in growth of trees of similar age (Hökkä et al. 2012b). Thus, tree diameter with different transformation was the only tree level variable included in diameter and height growth models as the main effect or as an interaction term with other variables (e.g., site quality).
In growth models between-tree competition is divided into two components: a broad level of competition within the target stand reflecting the level of sites occupancy usually described with BA or N (Miina 1995; Penner et al. 1995; Hökkä et al. 1997), and the competition status of single trees reflected by the target trees hierarchical position within the stand such as d/Hdom or BAL (Wykoff et al.1982). In general, between-tree competition had a higher impact on tree diameter growth than on height growth. In this study stand basal area had a negative impact on diameter growth of all species with highest effect on pine and lowest on birch. Hökkä et al. (1997) reported a similar effect on pine, but no effect on spruce and birch. The different result is probably due to the study material of Hökkä et al. (1997) which was concentrated on younger stands where competition didn’t yet significantly limit tree growth.
Stand level competition had no impact on height growth of any species. This is contradictory to results obtained from several height growth modelling studies on mineral soil sites (Wykoff et al. 1982; Huang and Titus 1999; Uzoh and Oliver 2006), in which increasing stand density decreased growth of all trees. However in many Finnish studies, the effects of competition on tree height growth were not important for birch and pine. Low density variation in the managed stands is the probable reasons for this result (Hynynen 1995; Hynynen et al. 2002, 2011).
The competition status of individual trees was accounted for by using basal area of larger trees than the target tree (BAL) and the interaction of tree diameter and stand dominant height
(d/Hdom,) as predictors. BAL is a desirable variable because it logically responds to thinning from below or above (Wykoff 1990). In general, the poor competition status of suppressed trees showed up as lower growth than trees of dominant crown layer. BAL and d/Hdom were significant both in diameter and height growth models for all species. For pine and spruce, some competition even improved height growth, as found also by, e.g., Sharma and Brunner (2016). It was also noticeable that for spruce and birch, the competition effect depended also on the competing tree species, i.e., only BAL of the same tree species indicated lower diameter and height growth, suggesting some growth benefits when these species co-exist in mixed stands (Mielikäinen 1980). For pine the effect of BAL was independent of tree species. Hökkä et al. (1997) also used BAL in the models for diameter growth but without any species-specific effect. The effect of different tree species on the competition was detected for spruce and birch by using the spruce and/or birch proportion of basal area (Hökkä et al. 1997). Similar species-specific effects have been found by Huang and Titus (1999) for white spruce and aspen height growth in Alberta mixed stands.
Site quality was described with categorical variables referring to drained peatland site types, which basically are based on the ground vegetation associations, dominant tree species and wetness of the site in natural stage. In general, the most fertile (Rhtkg) and poorest (Vatkg) sites differed from the other classes, and the largest differences among site classes were detected for pine and smallest for birch. As the effect of drained peatland site types on the model intercept were mostly non-significant, there were significant differences in slope among some of the combined classes, i.e., tree diameter had different coefficients for different site type groups. This is in accordance with Hökkä et al. (1997) who used the interaction of site class and tree diameter to describe differences in the growth rhythm of different sites. Reason for minor differences in growth among site types can be due to the considerable macroscale variation in nutrient characteristics of peat soil both between and within site types (Westman and Laiho 2003; Laiho et al. 2008; Rydin and Jeglum 2006). The used site type classification served only as a broad measure of site fertility status. One supplement site variable, indicating extreme wetness, i.e., presence of flarks (RIMPI), significantly reduced diameter growth of pine.
On peatlands, drainage conditions play an important role in site productivity. Growth response to drainage has shown to follow a nonlinear pattern as a function of time since ditching (Seppälä 1969; Hånell 1988). Such a trend with a peak point was not detected in our study, probably because time since the original ditching was on average 23 years and recently made original ditching were rather few in the study material. However, increasing time since the original ditching indicated lower diameter growth of all species, which is expectable given the average age of drainage in the data (Seppälä 1969). Growth response to the last ditching operation (i.e., DNM) was expressed as categorical dummy variables for time since last ditching affecting the model intercept or slope in connection with geographical location and site classes. These interaction effects are in accordance with the results of previous studies, which have shown that drainage effect varies by site quality and geographical location (Seppälä 1969; Hökkä and Ojansuu 2004).
The ability of time since the last ditching to describe drainage conditions in a stand is the poorer the longer is the time since ditching. Therefore another variable depicting the current drainage conditions of a site was also used. A group indicator variable defined in the field, reflecting poor ditch condition and need for ditch network maintenance (NDNM) in the near future, was used in the models. If there was a need for ditch network maintenance, diameter and height growth of pine were significantly lower. This effect, however, was not static. In drained peatland forests, site drainage status, total tree volume, and stand growth are known to be interconnected (Penner et al. 1995; Jutras et al. 2006; Hökkä et al. 2008). This recursive relationship was shown as a positive interaction between stand basal area and the dummy variable indicating need for DNM in the diameter growth model. Thus, a higher basal area could compensate for the negative effect of DNM need on growth, i.e., growth was higher in stands where stand stocking (and competition as well) was higher. Parallel to this, Hökkä et al. (2012b) found that basal area of 20 m2 ha–1 was enough to compensate for the negative impact of high July precipitation on diameter growth of pine. As a reverse, this suggests that high stand stocking, i.e., basal area, would indicate deeper water table levels, as shown by Hökkä et al. (2016). The effects are hard to be separately evaluated, but in a model, they can be detected and their impacts illustrated. Site drainage conditions are also influenced by other factors such as soil texture, peat quality, and ditching intensity (Sikström and Hökkä 2016), but they are commonly not available, nor applicable as predictors in growth models.
In the previous studies, geographical location and climate have shown to respond significantly to both diameter and height growth (Hökkä 1997b; Hynynen et al. 2002, 2014). This effect was accounted for by temperature sum (TS) and altitude from the sea level (ALT). For all tree species, the temperature sum had a positive effect on tree growth and the s-shaped response was detected for pine and spruce and almost linear response for birch. Heikurainen (1973) has expressed the relative increase in growth of drained peatland stands as a function of temperature sum using similar non-linear relationship. The effect detected from the modeling data was however too strong, because in the calibration models there was a need to restrict the impact if TS was high. The need of this correction probably reflected the uneven distribution of the modeling data over the temperature sum gradient in Finland.
In peatlands, other management actions than DNM are thinning and fertilization. Recent thinning, depicted with different categorical time variables (THIN0-5, THIN6-10), showed better diameter growth for pine and birch. Thinned spruce stands showed better diameter growth than un-thinned stands. In height growth models, thinning (THIN6-10) influenced growth of birch, but not pine and spruce. In drained peatlands, commercial thinning and ditch network maintenance are commonly carried out concurrently, which makes it difficult to evaluate their independent effects. It is also necessary to note that stand basal area is lowered in thinning, thus causing reduced overall competition in the thinned stand, and eventually, a thinning effect of some magnitude will be mediated even without separate thinning response variable.
Former fertilization with PK showed a long-lasting (15–25 years) increased diameter growth in deep-peated group II sites (composite sites) for pine and birch and also height growth of pine. These results are in line with those observed in previous studies (Hökkä et al. 2012a) although the typical temporal patterns of growth could not be found. Group II sites are those that are most prone to nutrient imbalance with abundant N resources in the peat but lack of P and K (Kaunisto and Paavilainen 1988; Moilanen et al. 2015), due to which they have been targets of PK fertilization (Moilanen et al. 2015). Long-term responses to PK fertilization have been observed in several fertilization studies (Moilanen 1993; Moilanen et al. 2005; Hökkä et al. 2012a; Moilanen et al. 2015). Tree stands in these sites are mixtures of pine and birch. In spruce mire sites, the stands have more balanced nutrition and PK fertilizations have been less frequent. Thus no response is to be expected. In these data there was no information on the doses and combination of used fertilizer. However, it is known that N has a marginal impact and PK causes the growth response. The estimated fertilization effect is thus conditional to the representativeness of the sample with respect to practical fertilization activity.
5.3 Model calibration
Compared to data used by Hökkä et al. (1997) a wider range of tree dimensions and stand conditions was included in this study. Despite this, Southern Finland in general, and some poorest sites were poorly represented in the modeling data. Therefore calibration models with the newest national forest inventory data (NFI11) were constructed to have up-to-date tree growth level at different site and stand conditions. During growth model construction, almost non-significant differences in growth were found among the site types. In the calibration data, however, a clearer trend in growth as a function of site quality was observed. It suggest that for some reason, only the best growing stands in poorer sites were included in the sample which levelled out the growth differences. The calibration also showed that the model predictions in terms of average growth within drained peatland site types and temperature sum were necessary to adjust with the calibration models.
Acknowledgements
Numerous people from former Metla and Luke have been involved in organizing and measuring the field data since 1980s. We also thank Prof Björn Hånell and an anonymous reviewer for their comments on the manuscript.
References
Ahtikoski A., Salminen H., Hökkä H., Kojola S., Penttilä T. (2012). Optimizing stand management on peatlands: the case of northern Finland. Canadian Journal of Forest Research 42(2): 247–259. https://doi.org/10.1139/x11-174.
Assmann E. (1970). The principles of forest yield study. Pergamon press, Oxford. 506 p.
Campbell T.A. (1980). Oxygen flux measurements in organic soils. Canadian Journal of Soil Science 60(4): 641–650. https://doi.org/10.4141/cjss80-073.
Flewelling J.W., Pienaar L.V. (1981). Multiplicative regression with lognormal errors. Forest Science 27: 281–289.
Hånell B. (1988). Post-drainage forest productivity of peatlands in Sweden. Canadian Journal of Forest Research 18(11): 1443–1456. https://doi.org/10.1139/x88-223.
Heikurainen L. (1973). Soiden metsänkasvatuskelpoisuuden laskentamenetelmä. [A method for calculation of the suitability of peatlands for forest drainage]. Acta Forestalia Fennica 131. 35 p. [In Finnish with English summary]. https://doi.org/10.14214/aff.7565.
Heikurainen L. (1980). Kuivatuksen tila ja puusto 20 vuotta vanhoilla ojitusalueilla. [Drainage condition and tree stand on peatlands drained 20 years ago]. Acta Forestalia Fennica 167. 37 p. [In Finnish with English summary]. https://doi.org/10.14214/aff.7614.
Heinonen J. (1994). KPL – koealojen puu- ja puustotunnusten laskentaohjelamn käyttöohje. Metsäntutkimuslaitoksen tiedonantoja 504. 80 p. [In Finnish]. http://urn.fi/URN:ISBN:951-40-1369-7.
Hökkä H. (1997a). Height-diameter curves with random intercepts and slopes for trees growing on drained peatlands. Forest Ecology and Management 97(1): 63–72. https://doi.org/10.1016/S0378-1127(97)00063-7.
Hökkä H. (1997b). Models for predicting growth and yield in drained peatland stands in Finland (Doctoral thesis). Metsäntutkimuslaitoksen tiedonantoja. Finnish Forest Research Institute, Research papers 651. 45 p. + 3 app. http://urn.fi/URN:ISBN:951-40-1579-7.
Hökkä H., Kojola S. (2003). Suometsien kunnostusojitus – kasvureaktion tutkiminen ja kuvaus. [Ditch network maintenance in peatland forests – growth response and it’s description]. In: Jortikka S., Varmola M., Tapaninen S. (eds.). Soilla ja kankailla – metsien hoitoa ja kasvatusta Pohjois-Suomessa. [On peatlands and uplands – forest management in northern Finland]. Metsäntutkimuslaitoksen tiedonantoja. Finnish Forest Research Institute, Research papers 903: 13–20. [In Finnish]. http://urn.fi/URN:ISBN:951-40-1897-4.
Hökkä H., Alenius V., Penttilä T. (1997). Individual-tree basal area growth models for Scots pine, Norway spruce and pubescent birch on drained peatlands in Finland. Silva Fennica 31(2): 161–178. https://doi.org/10.14214/sf.a8517.
Hökkä H., Alenius V., Salminen H. (2000). Kunnostusojitustarpeen ennustaminen ojitusalueilla. [Predicting the need for ditch network maintenance in drained peatland sites in Finland]. Suo – Mires and Peat 51(1): 1–10. [In Finnish]. http://www.suo.fi/article/9786.
Hökkä H., Kaunisto S., Korhonen K.T., Päivänen J., Reinikainen A., Tomppo E. (2002). Suomen suometsät 1951–1994. Metsätieteen aikakauskirja 2B/2002. 357 p. [In Finnish]. https://doi.org/10.14214/ma.6242.
Hökkä H., Ojansuu R. (2004). Height development of Scots pine on peatlands: describing change in site productivity with a site index model. Canadian Journal of Forest Research 34(5): 1081–1092. https://doi.org/10.1139/x03-275.
Hökkä H., Repola J., Laine J. (2008). Quantifying the interrelationship between tree stand growth rate and water table level in drained peatland sites within Central Finland. Canadian Journal of Forest Research 38(7): 1775–1783. https://doi.org/10.1139/X08-028.
Hökkä H., Repola J., Moilanen M. (2012a). Modelling volume growth response of young Scots pine (Pinus sylvetris) stands to N, P, and K fertilization in drained peatland sites in Finland. Canadian Journal of Forest Research 42(7): 1359–1370. https://doi.org/10.1139/x2012-086.
Hökkä H., Salminen H., Ahti E. (2012b). Effect of temperature and precipitation on the annual diameter growth of Scots pine on drained peatlands and adjacent mineral soil sites in Finland. Dendrochronologia 30(2): 157–165. https://doi.org/10.1016/j.dendro.2011.02.004.
Hökkä H., Uusitalo J., Linden H., Ala-Ilomäki J. (2016). Performance of weather parameters in predicting growing season water table depth variations on drained forested peatlands – a case study from southern Finland. Silva Fennica 50(4) article 1687. https://doi.org/10.14214/sf.1687.
Huang S., Titus S.J. (1999). An individual tree height increment model for mixed white spruce–aspen stands in Alberta, Canada. Forest Ecology and Management 123(1): 41–53. https://doi.org/10.1016/S0378-1127(99)00015-8.
Hynynen J., Ojansuu R. (2003). Impact of plot size on individual-tree competition measures for growth and yield simulators. Canadian Journal of Forest Research 33(3): 455–465. https://doi.org/10.1139/x02-173.
Hynynen J., Ojansuu R., Hökkä H., Siipilehto J., Salminen H., Haapala P. (2002). Models for predicting stand development in MELA System. The Finnish Forest Research Institute, Research Papers 835. 116 p. http://urn.fi/URN:ISBN:951-40-1815-X.
Hynynen J, Repola J., Mielikäinen K. (2011). The effect of species mixture on the growth and yield of mid-rotation mixed stands of Scots pine and silver birch. Forest Ecology and Management 262(7): 1174–1183. https://doi.org/10.1016/j.foreco.2011.06.006.
Hynynen J., Salminen H., Ahtikoski A., Huuskonen S., Ojansuu R., Siipilehto J., Lehtonen M., Rummukainen A., Kojola S., Eerikäinen K. (2014). Scenario analysis for the biomass supply potential and the future development of Finnish forest resources. Working Papers of the Finnish Forest Research Institute 302. 106 p. http://urn.fi/URN:ISBN:978-951-40-2487-0.
Jutras S., Plamondon A.P., Hökkä H., Bégin J. (2006). Water table changes following pre-commercial thinning on post-harvest drained wetlands. Forest ecology and Management 235(1–3): 252–259. https://doi.org/10.1016/j.foreco.2006.08.335.
Kaunisto S., Paavilainen E. (1988). Nutrient stores in old drainage areas and growth of the stands. Communicationes Instituti Forestalis Fenniae 145. 39 p.
Kojola S., Ahtikoski A., Hökkä H., Penttilä T. (2012). Profitability of alternative management regimes in Scots pine stands on drained peatlands. European Journal of Forest Research 131(2): 413–426. https://doi.org/10.1007/s10342-011-0514-4.
Korhonen K., Ihalainen A., Ahola A., Heikkinen J., Henttonen H., Hotanen J.-P., Nevalainen S., Pitkänen J., Strandström M., Viiri H. (2017). Suomen metsät 2009–2013 ja niiden kehitys 1921–2013. Luonnonvarakeskus, Luonnonvara- ja biotalouden tutkimus 59/2017. 86 p. [In Finnish]. http://urn.fi/URN:ISBN:978-952-326-467-0.
Lähde E. (1969). Biological activity in some natural and drained peat soils with special reference to oxidation-reduction conditions. Acta Forestalia Fennica 94. 69 p. https://doi.org/10.14214/aff.7601.
Laiho R., Sarkkola S., Kaunisto S., Laine J., Minkkinen K. (2008). Macroscale variation in peat element concentrations in drained boreal peatland forests. Silva Fennica 42(4): 555–570. https://doi.org/10.14214/sf.233.
Laine J. (1989). Metsäojitettujen soiden luokittelu. [Classification of peatlands drained for forestry]. Suo – Mires and peat 40(1): 37–51. [In Finnish]. http://www.suo.fi/article/9651.
Laine J., Vasander H., Hotanen J.-P., Nousiainen H., Saarinen M., Penttilä T. (2012). Suotyypit ja turvekankaat – opas kasvupaikkojen tunnistamiseen. Metsäkustannus Oy. 160 p. [In Finnish]. ISBN-13 978-952-5694-89-5.
Lappi J. (1991). Calibration of height and volume equation with random parameter. Forest Science 37(3): 781–801.
Lappi J. (1993). Metsäbiometrian menetelmiä. Silva Carelica 24. 182 p. [In Finnish].
Lieffers V.J. (1988). Sphagnum and cellulose decomposition in drained and natural areas of an Alberta peatland. Canadian Journal of Soil Science 68(4): 755–761. https://doi.org/10.4141/cjss88-073.
McCulloch C.E., Searle S.R. (2001). Generalized, linear and mixed models. Wiley, New York. 325 p.
Mielikäinen K. (1980). Mänty-koivusekametsiköiden rakenne ja kehitys. Summary: Structure and development of mixed pine and birch stands. Communicationes Instituti Forestalis Fenniae 99.3. 82 p. http://urn.fi/URN:NBN:fi-metla-201207171129.
Miina J. (1994). Spatial growth model for Scots pine on drained peatland. Silva Fennica 28(1): 15–27. https://doi.org/10.14214/sf.a9159.
Miina J., Kolström T., Pukkala T. (1991). An application of spatial growth model of Scots pine on drained peatland. Forest Ecology and Management 41(3–4): 265–277. https://doi.org/10.1016/0378-1127(91)90108-8.
Moilanen M. (1993). Lannoituksen vaikutus männyn ravinnetilaan ja kasvuun Pohjois-Pohjanmaan ja Kainuun ojitetuilla soilla. [Summary: Effect of fertilization on the nutrient status and growth of Scots pine on drained peatlands in northern Ostrobothnia and Kainuu]. Folia Forestalia 820. 37 p. http://urn.fi/URN:ISBN:951-40-1341-7.
Moilanen M., Silfverberg K., Hökkä H., Issakainen J. (2005).Wood ash as a fertilizer on drained mires – growth and foliar nutrients of Scots pine. Canadian Journal of Forest Research 35(11): 2734–2742. https://doi.org/10.1139/x05-179.
Moilanen M., Hytönen J., Hökkä H., Ahtikoski A. (2015). Fertilization increased growth of Scots pine and financial performance of forest management in a drained peatland in Finland. Silva Fennica 49(3) article 1301. https://doi.org/10.14214/sf.1301.
Nuutinen T., Hirvelä H., Hynynen J., Härkönen K., Hökkä H., Korhonen K.T., Salminen O. (2000) The role of peatlands in Finnish wood production – an analysis based on large-scale forest scenario modelling. Silva Fennica 34(2): 131–153. https://doi.org/10.14214/sf.636.
Ojansuu R., Henttonen H. (1983). Kuukauden keskilämpötilan, lämpösumman ja sademäärän paikallisten arvojen johtaminen Ilmatieteen laitoksen mittaustiedoista. Estimation of local values of monthly mean temperature, effective temperature sum and precipitation sum from the measurements made by the Finnish Meteorological Office. Silva Fennica 17(2): 143–160. https://doi.org/10.14214/sf.a15099.
Paavilainen E., Päivänen J. (1995). Peatland forestry. Ecology and principles. Springer-Verlag, Berlin Heidelberg, New York. Ecological Studies 111. 248 p. https://doi.org/10.1007/978-3-662-03125-4.
Päivanen J., Hånell B. (2012). Peatland ecology and forestry – a sound approach. University of Helsinki, Department of Forest Sciences Publications. Vol. 3. 276 p. ISBN 978-952-10-4531-8.
Parresol B.R. (1999). Assessing tree and stand biomass: a review with examples and critical comparisons. Forest Science 45(4): 573–593.
Parresol B.R. (2001). Additivity of nonlinear biomass equations. Canadian Journal of Forest Research 31(5): 865–878. https://doi.org/10.1139/x00-202.
Payandeh B. (1973). Analyses of a forest drainage experiment in northern Ontario. I: Growth analysis. Canadian Journal of Forest Research 3(3): 387–398. https://doi.org/10.1139/x73-057.
Penner M., Penttilä T., Hökkä H. (1995). A method for using random parameters in analyzing permanent sample plots. Silva Fennica 29(4): 287–296. https://doi.org/10.14214/sf.a9214.
Penttilä T., Honkanen M. (1986). Suometsien pysyvien kasvukoealojen (SINKA) maastotyöohjeet. Metsäntutkimuslaitoksen tiedonantoja 226. 84 p. + 16 app. [In Finnish]. http://urn.fi/URN:ISBN:951-40-0882-0.
Rydin H., Jeglum. J. (2006). The biology of peatlands. Oxford University Press, New York. 343 p. https://doi.org/10.1093/acprof:oso/9780198528722.001.0001.
Salminen H., Lehtonen M., Hynynen J. (2005). Reusing legacy FORTRAN in the MOTTI growth and yield simulator. Computers and Electronics in Agriculture 49(1): 103–113. https://doi.org/10.1016/j.compag.2005.02.005.
Sarkkola S., Hökkä H., Ahti E., Koivusalo H., Nieminen M. (2012). Depth of water table prior to ditch network maintenance is a key factor for tree growth response. Scandinavian Journal of Forest Research 27(7): 649–658. https://doi.org/10.1080/02827581.2012.689004.
SAS Institute Inc. (1999). SAS OnlineDoc version 8 (computer program). SAS Institute Inc., Cary, North Carolina.
Sharma R.P., Brunner A. (2016). Modeling individual tree height growth of Norway spruce and Scots pine from national forest inventory data in Norway. Scandinavian Journal of Forest Research 32(6): 501–514. https://doi.org/10.1080/02827581.2016.1269944.
Searle R.S. (1987). Linear models for unbalanced data. Wiley. 536 p.
Seppälä K. (1969). Kuusen ja männyn kasvun kehitys ojitetuilla turvemailla. [Post-drainage growth rate of Norway spruce and Scots pine on peat]. Acta Forestalia Fennica 93. 88 p. [In Finnish with English summary]. https://doi.org/10.14214/aff.7611.
Sikström U., Hökkä H. (2016). Interactions between soil water conditions and forest stands in boreal forests with implications for ditch network maintenance. Silva Fennica 50(1) article 1416. https://doi.org/10.14214/sf.1416.
Silfverberg K., Moilanen M. (2008). Long-term nutrient status of PK fertilized Scots pine stands on drained peatlands in North-Central Finland. [PK-lannoituksen vaikutus männyn ravinnetilaan Pohjois-Pohjanmaan ojitusalueilla]. Suo – Mires and Peat 59(3): 71–88. http://www.suo.fi/article/9862.
Snowdon P. (1991). A ratio estimator for bias correction in logarithmic regressions. Canadian Journal of Forest Research 21(5): 720–724. https://doi.org/10.1139/x91-101.
Socha J. (2015). Long-term effect of wetland drainage on the productivity of Scots pine stands in Poland. Forest Ecology and Management 274: 172–180. https://doi.org/10.1016/j.foreco.2012.02.032.
Uzoh F., Oliver W. (2008). Individual tree diameter increment model for managed even-aged stands of ponderosa pine throughout the western United States using a multilevel linear mixed effects model. Forest Ecology and Management 256(3): 438–445. https://doi.org/10.1016/j.foreco.2008.04.046.
Westman C.J., Laiho R. (2003). Nutrient dynamics of drained peatland forests. Biogeochemistry 63(3): 269–298. https://doi.org/10.1023/A:1023348806857.
Wykoff W.F. (1990). A basal area increment model for individual conifers in the northern Rocky Mountains. Forest Science 36(4): 1077–1104.
Wykoff W.F., Crookston N.L., Stage A.R. (1982). User’s guide to the stand prognosis model. United States Department of Agriculture, Forest Service. Intermountain Forest and Range Experiment Station, Ogden, UT 84401. General Technical Report INT-133. 113 p. https://doi.org/10.2737/INT-GTR-133.
Total of 66 references.
