Juho Matala  ,
Harri Kilpeläinen,
Henrik Heräjärvi,
Tapio Wall,
Erkki Verkasalo
,
Harri Kilpeläinen,
Henrik Heräjärvi,
Tapio Wall,
Erkki Verkasalo
Sawlog quality and tree dimensions of Scots pine 34 years after artificial moose browsing damage
Matala J., Kilpeläinen H., Heräjärvi H., Wall T., Verkasalo E. (2020). Sawlog quality and tree dimensions of Scots pine 34 years after artificial moose browsing damage. Silva Fennica vol. 54 no. 3 article id 10389. https://doi.org/10.14214/sf.10389
Highlights
- The first controlled, long-term, experimental study on the tree dimensions and sawlog quality after moose damage
- The trees damaged at the seedling stage had a smaller diameter, height, and tree volume at the end of the experiment
- The heavier the clipping treatment, the more likely the stem form deteriorated
- Deteriorated stem form and vertical branches were the most typical defects.
Abstract
Moose (Alces alces L.) browsing causes severe damage in Scots pine (Pinus sylvestris L.) seedling stands. The effects of this damage on the quality of sawlogs were studied in a long-term controlled experiment. This article reports the stem size and external quality characteristics of Scots pine stems 34 years after artificial moose browsing damage. Damaging the trees by clipping the main stem at the seedling stage reduced the diameter, height, and tree volume of the trees at the end of the experiment. The tree growth reduction was dependent on the severity of clipping. The differences between the damaged and the control trees were more obvious in diameter than in height at the time of final felling. Stem form defects and vertical branches were the most typical externally detectable defects caused by clipping. Defects in the butt logs were detected in 71–89% of the damaged trees, depending on the clipping treatment severity. The stronger the clipping treatment, the more likely the stem form was defected and the more commonly were vertical branches and crooks detected in the stems. The results indicate that both tree dimensions and stem quality suffer from moose browsing. The findings of this controlled experiment more likely underestimate than overestimate the damage in comparison to real moose browsing. Further analyses are required to assess the effects of browsing damage on the internal quality of sawlogs and subsequent economic outcomes.
Keywords
Pinus sylvestris;
growth;
timber quality;
Alces alces;
defect
-
Matala,
Natural Resources Institute Finland (Luke), Natural resources, Yliopistokatu 6B, FI-80101 Joensuu, Finland
E-mail
juho.matala@luke.fi
- Kilpeläinen, Natural Resources Institute Finland (Luke), Bioeconomy and environment, Yliopistokatu 6B, FI-80101 Joensuu, Finland E-mail harri.kilpelainen@luke.fi
- Heräjärvi, Natural Resources Institute Finland (Luke), Production systems, Yliopistokatu 6B, FI-80101 Joensuu, Finland E-mail henrik.herajarvi@luke.fi
- Wall, Natural Resources Institute Finland (Luke), Research infrastructure services, Yliopistokatu 6B, FI-80101 Joensuu, Finland E-mail tapio.wall@luke.fi
- Verkasalo, Natural Resources Institute Finland (Luke), Production systems, Yliopistokatu 6B, FI-80101 Joensuu, Finland E-mail erkki.verkasalo@luke.fi
Received 27 May 2020 Accepted 9 July 2020 Published 15 July 2020
Views 69499
Available at https://doi.org/10.14214/sf.10389 | Download PDF

1 Introduction
Scots pine (Pinus sylvestris L.) is the dominant tree species on 65% of forest lands in Finland. Logs are widely used at saw mills, in utility poles, railway sleepers, by construction log manufacturers, and, to a lesser extent, as facing veneers (Vaahtera et al. 2018). Scots pine is also an important winter forage for moose (Alces alces L.) (Hörnberg 2001; Bergqvist et al. 2018). Moose have benefitted from even-aged forestry, which has resulted in vast areas of young Scots pine seedling stands, and increased moose populations have subsequently caused increasing damage to forests in all Nordic countries (Markgren 1974; Heikkilä 2000; Lavsund et al. 2003; Bergqvist et al. 2014; Nevalainen et al. 2016). The 10th National Forest Inventory showed moose damage with quality losses in the area of 608 000 ha in Finland between 2004–2008, and the majority (75%) of the identified moose damage occurred in Scots pine-dominated stands (Nevalainen et al. 2016).
The most typical moose damage on Scots pine is browsing on apical leader shoots at the height of one to three metres when the seedling stand is approximately 10 to 20 years old (Bergqvist et al. 2001; Jalkanen 2001; Nikula et al. 2008). Moose cause damage to trees also by browsing lateral twigs and foliage, both by breaking the seedling stem and by bark peeling. Moose damage can later slow down the growth of damaged trees and emerge different defects, for example, crooks, scars, vertical branches, or sweep. The damage leads to a reduction in the technical quality of timber, growth losses, and retarded development of the stand (Heikkilä and Löyttyniemi 1992; Heikkilä and Härkönen 1996; Bergqvist et al. 2001, 2003, 2013).
There are only a few and still rather short-term experimental results available on how the damage in the leader shoot affects the development of Scots pine (Löyttyniemi 1983; Heikkilä and Löyttyniemi 1992; Långström and Hellqvist 1992; Wallgren et al. 2014). Those studies indicate that Scots pine has a good ability to recover from single leader shoot damage or even stem breakage, especially in terms of height growth. However, there is a slight loss in diameter growth during the early development of seedling after a leader cut off (Heikkilä and Löyttyniemi 1992; Långström and Hellqvist 1992). Mortality due to cutting off a leader shoot once has been negligible (Heikkilä and Löyttyniemi 1992; Långström and Hellqvist 1992), but a heavier and repeated browsing of shoots has caused a mortality of seedlings (Edenius et al. 1995; Wallgren et al. 2014).
In spite of the rather limited effects on growth, some timber quality losses caused by cutting the main stem above or below the uppermost branch whorls were prognosticated, based on the findings of the early development after experimental clippings (Löyttyniemi 1983; Heikkilä and Löyttyniemi 1992; Långström and Hellqvist 1992). Follow-up inventories of the experiments five and ten years after the clipping treatment indicated that the quality defects were more visible in the first inventory, whereas the growth effects became obvious in the later inventory (Löyttyniemi 1983; Heikkilä and Löyttyniemi 1992). In those studies, 93% of the trees that were severely damaged (i.e., stem cut off below the second branch whorl from the top) showed serious crookedness five years after the damage, but the percentage decreased down to 56% ten years after the damage. Stem breakage below the first branch whorl from the top caused crookedness, vertical branches, and forking that would likely reduce the sawlog quality. Stem breakage below the second branch whorl from the top decreased the height and diameter growth too. Moreover, potential future timber quality flaws caused by large knots were expected due to the thickening of the branches below the cutting point. Furthermore, Heikkilä and Löyttyniemi (1992) assumed that signs of severe stem damage would remain visible at the time of the first commercial thinning, but lighter quality flaws would overgrow and the resultant hidden defects become visible not until the butt logs were processed into sawn timber.
Verkasalo and Kilpeläinen (2014) analysed the sample tree data of the 10th National Forest Inventory on standing trees, comparing the technical quality, timber assortment distribution, sawlog percentage, and the reduction in sawlog volume bound to inferior timber quality. They found the proportion of trees with visible technical defects to be 26–29% in naturally regenerated trees, 21–31% in planted trees, and 16–24% in directly seeded trees. Crooks, of which a part can be attributed to moose damage, were the dominant type of defects independent of the regeneration method. Wall et al. (2005) assessed the properties, applicability, and selection criteria of Scots pine thinning stands and stems to be harvested for saw milling as normal or small-sized sawlogs. They noticed that the harvesting yields of logs from the first commercial thinning were only 7–12% and 6–9% of the total harvesting removal on mineral soils and peatlands, respectively. Moose browsing damage was concluded as one cause for the low log percentage. Stöd et al. (2006), who studied Scots pine harvesting yield in the first commercial thinning stands, noticed that stem form defects, partly caused by moose browsing, were the most common reasons downgrading sawlog-sized bolts into pulpwood grade.
Research regarding the effects of moose browsing on wood processing is scarce. Sandgren (1980) studied the effects of moose browsing on the yield and quality of Scots pine sawn timber by grading trees from a stand that had been subjected to documented moose browsing damage. In total, 72% of the seedlings were browsed in their top and side shoots at a height of 90 cm, and 3% only in their side shoots. The sawing experiments by Sandgren (1980) revealed a remarkable decrease in the quality and value of sawn timber 23 years after the browsing damage. Not more than 18% of the butt logs in the browsed trees were estimated to provide high-quality timber in the final cutting, compared with 63% in the non-browsed reference trees. Vertical branches decreased the quality in 83% of the butt logs. Another sawing experiment from the first commercial thinning stands (Nordström 2005) also indicated a low quality and value of Scots pine sawn timber, which was partly attributed to moose browsing.
The aim of this article is to assess how a moose browsing damage at seedling stage affects the further development and technical quality of Scots pine. The study is based on a long-term experiment where the seedlings were artificially clipped to imitate moose browsing and analysed for dimensions and quality 34 years later.
2 Materials and methods
2.1 Experimental design
The Finnish Forest Research Institute (Metla) established artificial moose browsing experiments in seven Scots pine seedling stands throughout Finland in 1980, in locations where no natural moose damage had previously been observed (Fig. 1). The stands were located between latitudes 60°–66°, with their effective temperature sum (reference years 1980–2010) varying from 901 to 1386 degree days (Table 1). The stands were located on mineral soils and they were classified into two fertility types: five medium fertile stands, including three Myrtillus-type (MT), one Vaccinium-Myrtillus type (VMT) and one Hylocomium-Myrtillus type (HTM) stands, and two less fertile Vaccinium type (VT) stands, classified according to the Finnish forest site type classification by Cajander (1949). The age and the dominant height of the stands varied between 8 and 15 years and 2.6 and 3.4 m, respectively, at the time of the artificial browsing treatments.
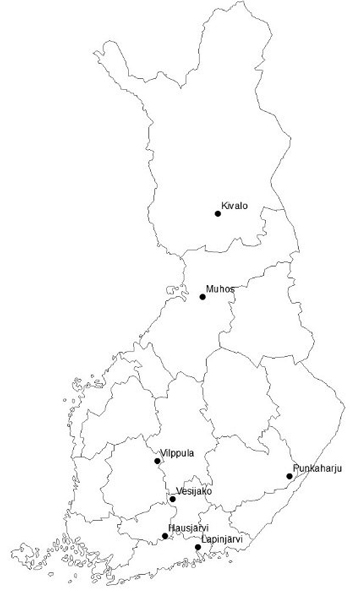
Fig. 1. Locations of the study stands in Finland.
| Table 1. Main characteristics of the study stands at the beginning of the experiment in 1980. | ||||||||
| Stand | Location | Coordinates (WGS84) | Effective temperature sum (DD) | Forest site type | Origin | Number of sample plots | Stand age, yr. | Dominant height, m |
| 1 | Lapinjärvi | 60°31´N, 26°03´E | 1386 | VT | Planted | 4 | 12 | 3.4 |
| 2 | Hausjärvi | 60°41´N, 24°53´E | 1309 | VT | Seeded | 2 | 12 | 3.3 |
| 3 | Vesijako | 61°20´N, 25°07´E | 1256 | VT | Naturally regenerated | 10 | 15 | 2.6 |
| 4 | Punkaharju | 61°45´N, 29°23´E | 1259 | MT | Naturally regenerated | 4 | 10 | 3.4 |
| 5 | Vilppula | 61°60´N, 24°30´E | 1195 | VT | Planted | 7 | 8 | 3.0 |
| 6 | Muhos | 64°53´N, 26°06´E | 1106 | VMT | Planted | 6 | 14 | 2.8 |
| 7 | Kivalo | 66°20´N, 26°43´E | 901 | HMT | Seeded | 6 | 15 | 2.7 |
The seedlings were measured during the establishment from two to ten 5.64 m radius sample plots per stand (Table 1). Every second seedling was randomly selected for cutting treatment.
Three cutting treatments of increasing severity were carried out (Fig. 2): 1) top shoot clipped along with all lateral twigs of the uppermost branch whorl, added with light clipping of branches; 2) main stem cut below the uppermost branch whorl, added with light clipping of branches; 3) main stem cut below the second branch whorl, added with light clipping of branches. In addition, two years following the first treatment, part of the clipped seedlings were trimmed by selecting one side shoot as a forthcoming main stem and clipping off the competing shoots. Sample trees in each stand were divided into different treatments resulting in a total number of sample trees of 76, 62, and 45 in clipping treatments 1–3, respectively. 104 sample trees were left unclipped as the control treatment (Table 2).
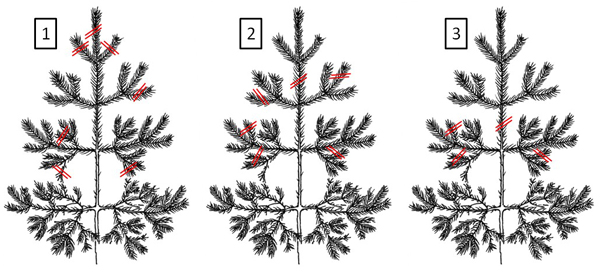
Fig. 2. Presentation of clipping treatments at the beginning of the experiments in 1980: 1) top shoot clipped along with all lateral twigs of the uppermost branch whorl, added with light clipping of branches; 2) main stem cut below the uppermost branch whorl, added with light clipping of branches; 3) main stem cut below the second branch whorl, added with light clipping of branches.
| Table 2. Numbers of the sample trees according to clipping treatments, mean values of diameter at breast height (DBH) and height (standard deviations in the parentheses), and minimum and maximum values in 1980 (beginning of the experiment) and 2014 (felling) in the study stands. | |||||||||
| First measurement in 1980 | Last measurement in 2014 | ||||||||
| Number of sample trees in different treatments | DBH, cm | Height, m | DBH, cm | Height, m | |||||
| Stand | Control | Clipping 1 | Clipping 2 | Clipping 3 | All trees | Mean (Std) Min–Max | Mean (Std) Min–Max | Mean (Std) Min–Max | Mean (Std) Min–Max |
| 1 | 15 | 15 | 9 | 7 | 46 | 2.4 (1.3) | 2.2 (0.6) | 14.0 (2.3) | 12.5 (1.3) |
| 0.0–4.9 | 1.1–3.3 | 9.0–18.8 | 9.9–15.6 | ||||||
| 2 | 6 | 4 | 4 | 2 | 16 | 2.5 (1.0) | 2.5 (0.5) | 14.4 (3.6) | 13.5 (2.0) |
| 0.7–4.7 | 1.5–3.5 | 5.9–22.3 | 7.8–15.8 | ||||||
| 3 | 18 | 13 | 12 | 7 | 50 | 1.3 (1.2) | 1.6 (0.5) | 16.8 (4.5) | 16.6 (2.1) |
| 0.0–4.8 | 0.8–3.2 | 8.1–28.0 | 11.5–20.2 | ||||||
| 4 | 12 | 8 | 8 | 5 | 33 | 3.2 (1.2) | 2.6 (0.7) | 18.7 (5.5) | 18.3 (1.9) |
| 1.4–5.4 | 0.3–4.0 | 9.1–28.9 | 13.6–21.5 | ||||||
| 5 | 18 | 16 | 15 | 12 | 61 | 2.7 (1.0) | 2.3 (0.4) | 15.8 (3.9) | 18.4 (2.0) |
| 1.1–5.3 | 1.6–3.5 | 7.6–23.2 | 12.7–22.2 | ||||||
| 6 | 17 | 12 | 8 | 6 | 43 | 2.1 (1.4) | 2.0 (0.6) | 16.3 (3.3) | 15.2 (1.6) |
| 0.0–5.7 | 0.9–3.7 | 8.2–24.3 | 11.1–19.1 | ||||||
| 7 | 18 | 8 | 6 | 6 | 38 | 1.5 (1.1) | 1.8 (0.5) | 17.4 (3.1) | 12.3 (1.4) |
| 0.0–3.6 | 0.9–2.8 | 10.0–23.1 | 8.7–14.5 | ||||||
| All | 104 | 76 | 62 | 45 | 287 | 2.2 (1.3) 0.0–5.7 | 2.1 (0.6) 0.3–4.0 | 16.2 (4.0) 5.9–28.9 | 15.6 (3.0) 7.8–22.2 |
2.2 Measurements during the experiments
The tree height was measured from every sample tree, and the diameter at breast height (DBH) from the sample trees that were taller than 1.3 m before the clipping treatments in 1980. The average height and DBH of sample trees were 2.1 m (1.6–2.6 m, depending on the stand) and 2.2 cm (1.3–3.2 cm, depending on the stand), respectively (Table 2).
A total of 287 sample trees were felled and their dimensions and quality characteristics were measured in 2014 (Table 2). The over-bark diameters at the heights of 1.3 and 6.0 metres were measured from each tree in two cardinal directions. The tree height, stump height, and the heights of the lowest dead branch and crown base were measured for each felled sample tree. In order to evaluate the annual height growth of each sample tree during the 34 growing seasons (1980–2013) after artificial browsing, the distance between each branch whorl was measured from the stump to the top of the sample tree. Based on the measured DBH, the diameter at 6-metre height, and the tree height, the tree volume of each sample tree (over bark) was calculated using the polynomial taper curve models for Scots pine by Laasasenaho (1982).
Some sample trees had died or had been removed in thinning operations during the experiment. No information about these trees was available. Hence, their numbers were recorded but they were excluded from the growth and quality related analyses. Three still standing sample trees had died just before the measurements and they were included in the data.
Following the tree measurements, one 5-metre-long butt log was cut from each felled sample tree for the detection and measurement of defects caused by the clipping treatments. The base and top diameters (over bark) of each log were measured in two cardinal directions. All defects affecting the bucking of sawlogs were localized and the severity of each defect was evaluated. The following defects that may decrease the quality of a sawlog were recorded: live and dead branches which were too thick, vertical branches, scars, forks, and form defects. The diameters and locations of the thickest live and dead branches, as well as vertical branches, were determined. The vertical length, depth, and mid-point of open and overgrown scars were measured. The taper curve of the tree was used to assess if a scar was situated inside or outside of the top cylinder of the butt log. The vertical locations of forks were recorded as well. Regarding the form, the butt logs were classified as straight, sweep (over 1 cm m–1), single crooked, multiple crooked, and multidimensional crooked (s-crook). The over-bark volume of each butt log was calculated using the tree dimensions and taper curve models for Scots pine (Laasasenaho 1982).
2.3 Analysing defects in butt logs
The defects observed in the butt logs were studied in two ways: 1) whether the clipping caused defects near the damage point of a sample tree, and 2) whether the clipping decreased the quality of a butt log.
In the first case, all defects were identified within the potential browsing damage areas that were located in the height zone one metre up or down from the browsing damage point (Fig. 3). The virtual “damage area” was also defined for untreated control trees because of the modelling purposes. This was located at the height of 2 m above stump level, which was close to the average height of the damage points in the clipped trees. Thus, the “damage area” of the control trees was at 1 to 3 metres similarly to the clipped trees. The following defects were considered if they were located within the damage areas of sawlogs: vertical branches, scars, and forks. Additionally, the thickest green and dead branches were recorded if they were situated within the damage area of a butt log.
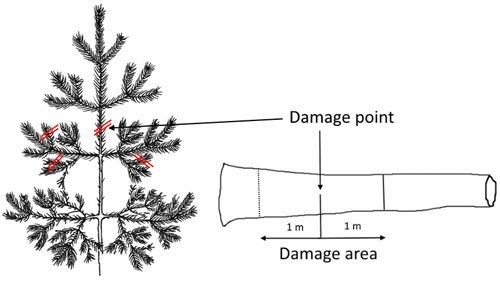
Fig. 3. Location of damage point in a sample tree at the beginning of the experiment, and in a butt log cut from the respective sample tree after 34 years. The damage area is defined one metre downwards and upwards from the damage point.
In the second case, all defects inhibiting bucking for sawlogs were identified in each butt log (Table 3). While common quality requirements for timber assortments are not allowed or published for timber trade, according to the EU and Finnish competition legislation, the requirements applied in this study were compiled based on an inquiry from Finnish forest industry companies on their bucking rules. The requirements (Table 3) are largely consistent with the general bucking rules shown by Metsäkeskus (1999). The following defects were considered: green branches thicker than 60 mm in diameter; dead and vertical branches thicker than 40 mm; scars with the length over 90 cm or inside the top cylinder of a butt log which in this data were due to incompletely overgrown vertical branches or other surface defects; log form defects, or dead tree. One vertical branch less than 40 mm in diameter was accepted in each butt log. Butt logs were classified as straight, sweeped (over 1 cm m–1), single crooked, s-crooked, and multiple crooked according to their form defects.
| Table 3. Quality requirements applied for butt logs of Scots pine in this study. These requirements were applied and generalized from bucking rules used by forest industries in Finland (Metsäkeskus 1999). | |||
| Characteristic | Quality requirements for sawlog grades 1–3 | ||
| Grade 1 | Grade 2 | Grade 3 | |
| Maximum branch diameter (mm) | |||
| - green branches | 15 | 30 | 60 |
| - dead branches | 10 | 25 | 40 |
| - vertical branches | 0 | 25 | 40 |
| Defects allowed | |||
| - only one vertical branch | no | yes | yes |
| - scars (length < 90 cm) *) | no | yes | yes |
| - sweep (over 1 cm m–1) | no | no | no |
| - single crook | no | no | no |
| - multiple crook, s-crook | no | no | no |
| - fork | no | no | no |
| - dead tree | no | no | no |
| *) outside of top cylinder. | |||
The occurrence of each defect near the clipping point (Fig. 3) and within the whole butt log was compared between clipping treatments 1–3 and the unclipped control in terms of percentages of their occurrence in the sample trees. The percentages of form defects were analysed similarly.
2.4 Grading of butt logs
All 5-metre-long butt logs were classified into sawlog grades 1–3 and pulpwood according to their external quality. The log diameter was not taken into account when grading. The quality requirements for the maximum diameters of green, dead, and vertical branches, as well as the maximum lengths of scars were different in each log grade (Table 3). In log grade 1, green branches thinner than 15 mm and dead branches thinner than 10 mm in diameter were accepted, but no scars or vertical branches were not. In grade 2, the maximum diameters were 30 mm for green branches and 25 mm for dead and vertical branches, while the respective diameters were 60 mm and 40 mm in grade 3. Branches which were too thick, over 90-cm-long scars, two or more vertical branches, sweep (over 1 cm m–1), or any crooks were not allowed in sawlogs. Butt logs of poorer quality and those cut from the dead sample trees were classified as pulpwood. Butt logs were also classified into pulpwood-sized logs, with the top diameter measuring less than 15 cm (n = 199), and into sawlog-sized logs, with the top diameter measuring 15 cm at the minimum (n = 88; Table 4).
| Table 4. Number of butt logs in different log grades and top diameter classes (over bark) in this study. | |||
| Sawlog grade | Top diameter less than 15 cm | Top diameter 15 cm or more | All logs |
| Grade 1 | 1 | 0 | 1 |
| Grade 2 | 43 | 5 | 48 |
| Grade 3 | 10 | 26 | 36 |
| Pulpwood | 145 | 57 | 202 |
| Total | 199 | 88 | 287 |
2.5 Statistical analyses
The differences in the dimensions and height growth of the sample trees during the experiment were tested between the treatments using analysis of covariance (ANCOVA). The number and dimensions of sample trees varied considerably between the study stands at the beginning of the experiment, and the number of observations in different stands varied between the clipping treatments. Since soil fertility influences the height growth of trees, the forest site type (MT or VT) and tree height at the beginning of the experiment were taken into account for each sample tree.
First, the DBH (over bark), height, and tree volume of a sample tree in 2014 were estimated when the experiment had been running for 34 years. This was carried out using three ANCOVA models (Eq. 1). Other three ANCOVA models estimated the height increment of a sample tree during the first 5 years (1981–85), during the first 10 years (1981–1990), and during the final 5 years (2009–2013). Finally, ANCOVA was carried out to estimate the maximum diameter of a dead branch in a butt log. The thickest dead branch is usually the most important factor when classifying pine sawlogs according to the external quality (Uusitalo and Isotalo 2005; Uusitalo et al. 2018). Because the sample trees were mostly rather small, the green branches were mainly thin and seldom affected the quality of a butt log. Therefore, the maximum diameter of the green branch was not estimated.
The ANCOVA models were used to test the statistical differences between the clipped and unclipped sample trees in 1) the height growth of the trees during the experiment, 2) the dimensions of the trees, and 3) the diameter of the thickest dead branch in the butt logs at the end of the experiment. The control trees (and butt logs from these trees) were selected as references to which the butt logs of the clipped trees were compared.
The ANCOVA model can be formulated as:
![]()
where yij is a response for the subject (here sample tree or butt log) i in the treatment j, μ is the population grand mean, τj is the effect of the treatment j, β is the regression coefficient, xij is the covariate for the subject i in treatment j, and εij is the associated unobserved error term for the subject i in the treatment j.
Several independent variables were tested in the models, but finally the damage class of a sample tree (i.e., clipping treatment), the forest site type MT (or corresponding type as a dummy variable), and the interaction between the effective temperature sum and site type were selected as predictors in the models based on their significance value of less than 0.05.
Because the most important factors affecting the quality of the butt logs in this experiment were vertical branches and stem form defects, we formulated two logistic regressions (Eq. 2) to study the presence of vertical branches (over 40 mm in diameter) and stem form defects in the butt logs of the clipped and unclipped trees. The presence of vertical branches of any size within the damage areas in the butt logs were tested in the third logistic regression model. Based on the p-value, the damage class (i.e., clipping treatment) and the height of a sample tree at the beginning of the experiment were selected as predictors in the models that estimate the occurrence of vertical branches. However, the effective temperature sum was added in the model when the occurrence of any stem form defect in a butt log was modelled. The occurrence of other defects was estimated, as well, but these models showed no differences between the clipping treatments.
Finally, the probability of bucking a sawlog meeting the quality requirements of log grade 3 was estimated using a logistic regression model, in which the effective temperature sum, the forest site type MT (or corresponding as a dummy), the height of a sample tree in 1980, and the clipping treatment were chosen as independent variables based on their p-values. Clipping treatment was used as a predictor variable in these logistic regressions to test whether it had any effect on the occurrence of vertical branches and stem form defects, or if the butt logs met the quality requirements of sawlog at the end of the experiment.
The general form of a logistic regression model with the logit link function and multiple covariant variables is:

where pj is the probability of the event (here, the defect was detected in a butt log or a butt log met the quality requirements of sawlog grade 3) in a butt log cut from sample tree j, xij is a value of the independent variable i for a butt log in sample tree j, β0,…,βn are the regression coefficients of the model, and εj is the associated unobserved error term for the sample tree j.
The independent variables had significance values less than 0.05 according to the Wald statistic. The applicability of the logistic regression model was evaluated using Nagelkerke’s R2.
Because the data consisted of only seven stands, poorer soil fertility sites (VT or corresponding forest site types) were missing in northern Finland, and only one clipping treatment was subjected to each tree. No random effects, i.e., for a stand or sample tree, were used in the analysis of covariance or logistic regressions. The statistical models were constructed and evaluated using IBM SPSS 25.0 software (IBM Corp 2018).
3 Results
3.1 Dimensions and growth of trees
The mean DBH, height, and tree volume were 16.2 cm, 15.6 m, and 176 dm3, respectively, at the time of felling in 2014 (Table 5). The mean DBH and tree height were 17.6 cm and 15.9 m for the control trees, whereas the clipped trees were 1.8–2.5 cm thinner and 0.4–0.6 m shorter, with the difference depending on the clipping treatment. Subsequently, the tree volume was, on average, 209 dm3 for the control trees, while the clipped trees were 44–58 dm3 smaller. Clipping treatment 2, where the main stem was cut below the uppermost branch whorl, resulted in the largest loss in tree volume, because of poor diameter growth. The average heights of the lowest dead branch and crown base were 1.5 metres and 9.0 metres, respectively, in the control trees. In the clipped trees, on the other hand, the lowest dead branches were on average 0.2–0.5 metres lower, but the crown base was 0.1–0.5 metres higher than that in the control trees, with the differences depending on the treatment.
| Table 5. Number and main characteristics of sample trees and their butt logs according to clipping treatment. Numbers of sample trees and butt logs as well as mean values, standard deviations (in parentheses), and ranges (between minimum and maximum values) of the variables are presented for the different treatments and all data. | ||||||
| Variable | Clipping treatment | All data | ||||
| No damage | Damage 1 | Damage 2 | Damage 3 | |||
| SAMPLE TREES | ||||||
| Number | N | 104 | 76 | 62 | 45 | 287 |
| Diameter at breast height, cm | Mean (Std) | 17.6 (4.0) | 15.8 (3.7) | 15.1 (3.7) | 15.3 (4.4) | 16.2 (4.0) |
| Min-Max | 9.9–28.9 | 8.4–28.0 | 5.9–24.3 | 7.6–23.6 | 5.9–28.9 | |
| Tree height, m | Mean (Std) | 15.9 (3.0) | 15.5 (2.9) | 15.5 (2.9) | 15.3 (3.2) | 15.6 (3.0) |
| Min-Max | 8.7–22.2 | 9.6–21.5 | 7.8–19.9 | 9.1–21.2 | 7.8–22.2 | |
| Height increment 1981–85, dm a–1 | Mean (Std) | 4.4 (1.3) | 4.4 (1.2) | 4.4 (1.3) | 4.2 (1.4) | 4.4 (1.3) |
| Min-Max | 1.1–6.9 | 0.8–7.8 | 1.3–6.2 | 1.6–6.5 | 0.8–7.8 | |
| Height increment 1981–90, dm a–1 | Mean (Std) | 4.5 (1.2) | 4.6 (1.2) | 4.6 (1.2) | 4.6 (1.3) | 4.6 (1.2) |
| Min-Max | 1.3–6.8 | 1.3–7.4 | 1.8–6.3 | 2.1–7.0 | 1.3–7.4 | |
| Height increment 2009–2013, dm a–1 | Mean (Std) | 3.8 (0.7) | 3.6 (0.9) | 3.5 (1.0) | 3.3 (1.4) | 3.6 (1.0) |
| Min-Max | 0.9–5.3 | 0.7–5.2 | 0.0–5.2 | 0.0–5.1 | 0.0–5.3 | |
| Height of the lowest dead branch, m | Mean (Std) | 1.7 (1.1) | 1.5 (1.1) | 1.2 (0.9) | 1.4 (1.1) | 1.5 (1.1) |
| Min-Max | 0.2–6.8 | 0.5–5.9 | 0.2–5.2 | 0.2–5.8 | 0.2–6.8 | |
| Height of the crown base, m | Mean (Std) | 8.8 (3.3) | 8.9 (3.3) | 9.3 (3.1) | 9.3 (3.3) | 9.0 (3.2) |
| Min-Max | 3.1–15.7 | 3.1–15.8 | 3.3–15.3 | 3.9–15.5 | 3.1–15.8 | |
| Tree volume, dm3 | Mean (Std) | 209 (119) | 165 (93) | 151 (83) | 156 (102) | 176 (105) |
| Min-Max | 36–638 | 35–566 | 13–417 | 31–389 | 13–638 | |
| BUTT LOGS | ||||||
| Number of all butt logs | N | 104 | 76 | 62 | 45 | 287 |
| Number of logs with top diameter over 15 cm | N | 45 | 20 | 12 | 11 | 88 |
| Number of logs with top diameter less than 15 cm | N | 59 | 56 | 50 | 34 | 199 |
| Top diameter of log, cm | Mean (Std) | 14.4 (3.6) | 12.8 (3.3) | 12.1 (3.3) | 12.1 (3.8) | 13.1 (3.6) |
| Min-Max | 6.9–25.2 | 6.5–23.8 | 3.0–18.9 | 5.4–19.6 | 3.0–25.2 | |
| Height of the biggest dead branch in a log, m | Mean (Std) | 3.2 (1.2) | 2.8 (1.3) | 2.7 (1.4) | 2.4 (1.5) | 2.8 (1.3) |
| Min-Max | 0.7–5.0 | 0.5–4.8 | 0.6–5.0 | 0.4–4.9 | 0.4–5.0 | |
| Diameter of the biggest dead branch, mm | Mean (Std) | 24.0 (6.9) | 22.1 (5.9) | 21.5 (4.7) | 22.7 (7.2) | 22.7 (6.3) |
| Min-Max | 11.0–46.0 | 9.0–35.0 | 14.0–34.0 | 11.0–49.0 | 9.0–49.0 | |
| Log volume, dm3 | Mean (Std) | 116 (54) | 94 (44) | 86 (41) | 89 (49) | 99 (50) |
| Min-Max | 31–308 | 25–279 | 11–212 | 21–196 | 11–308 | |
| Average sawlog volume, dm3 (based on quality of sawlog grade 3) | Mean (Std) | 45 (66) | 30 (51) | 24 (42) | 10 (32) | 31 (54) |
| Min-Max | 0–308 | 0–179 | 0–165 | 0–155 | 0–308 | |
On average, the annual height growth of the sample trees was 46 cm during the first ten years, but decreased down to 36 cm a–1 during the last five years of the experiment (Table 5). During these periods, the differences between the clipping treatments were minor. The mean annual height growth differed only by 2 cm at the beginning of the experiment and by 5 cm at the end of the experiment between the clipping treatments. The average height growth of the clipped and control trees was similar during the first ten years, but the control trees grew, on average, 2–5 cm a–1 more than the clipped ones during the final five years. The more strongly the trees were initially damaged, the slower their height growth was during the final five years.
3.2 Dimensions and quality of butt logs
The butt logs of the control trees had an average volume of 116 dm3, while those from the clipped trees were 17–30 dm3 smaller, depending on the clipping treatment (Table 5). Similarly to tree volume, clipping treatment 2 – in which the main stem was cut below the uppermost branch whorl – resulted in the smallest log volume. Similar differences were observed in the top diameter.
The thickest dead branch, normally being a good predictor for log quality and value, was, on average, a little thicker in the butt logs of the control trees (24 mm) than in the clipped trees (21.5–22.7 mm). The height of the thickest dead branch was, on average, 3.2 m above the stump level in the control trees, but 0.4–0.8 m lower in the clipped trees. Accordingly, the thickest dead branches were approximately in the middle of the butt logs in the clipped trees, but slightly closer to the top of the butt logs in the control trees.
The effects of clipping on the occurrence of vertical branches, forks and scars, as well as on the diameter of the thickest green and dead branch, were studied within the damage area, i.e., one meter upwards and downwards from the damage point (Fig. 3). The proportions of different defects in the butt logs are presented according to clipping treatment in Table 6. Vertical branches were detected within the damage area in 28% of all the butt logs. While the two strongest treatments, 2 and 3, resulted in a vertical branch within the damage area in almost half of the butt logs, the proportion was only 9% in the untreated control trees. Forks were more common (7%) in the strongest treatment, 3, in which the main stem was cut below the second branch whorl, than in the control or other clipping treatments (0–1.6%). On the other hand, scars were more common in the control and the mildest treatment, 1, (5–6%) than in treatments 2 and 3 (2–3%).
| Table 6. Number of sample trees with different defects in butt logs, and proportions of butt logs with different defects according to clipping treatment and in all data. All defects were recorded within the damaged area of butt logs, but only the critical defects in terms of sawlog quality grading were taken into account. Respective proportions of defect-free butt logs are presented as well. | ||||||
| N | Proportion of butt logs (%) | |||||
| Control | Clipping 1 | Clipping 2 | Clipping 3 | All logs | ||
| Defects within damaged area in the butt log | ||||||
| thickest green branch | 11 | 2.9 | 2.6 | 4.8 | 6.7 | 3.8 |
| thickest dead branch | 124 | 40.4 | 47.4 | 41.9 | 44.4 | 43.2 |
| vertical branch | 80 | 8.7 | 25.0 | 48.4 | 48.9 | 27.9 |
| scar | 13 | 5.8 | 5.3 | 3.2 | 2.2 | 4.5 |
| fork | 5 | 1.0 | 0.0 | 1.6 | 6.7 | 1.7 |
| Defects in butt logs according to the bucking rules | ||||||
| green branch (>60 mm) | 1 | 0.0 | 0.0 | 0.0 | 2.2 | 0.3 |
| dead branch (>40 mm) | 2 | 1.0 | 0.0 | 0.0 | 2.2 | 0.7 |
| vertical branch (>40 mm) *) | 35 | 5.8 | 10.5 | 16.1 | 24.4 | 12.2 |
| scar | 23 | 7.7 | 7.9 | 6.5 | 11.1 | 8.0 |
| fork | 7 | 1.9 | 0.0 | 1.6 | 8.9 | 2.4 |
| form defect | 184 | 53.8 | 63.2 | 72.6 | 77.8 | 64.1 |
| dead tree | 3 | 0.0 | 0.0 | 1.6 | 4.4 | 1.0 |
| Defect-free logs according to the bucking rules **) | 85 | 39.4 | 28.9 | 27.4 | 11.1 | 29.6 |
| *) Only one vertical branch smaller than 40 mm in diameter allowed. **) Log diameter not taken into account in grading. | ||||||
The thickest green and dead branches were more often located within the damage area in the clipped trees than within the corresponding area in the undamaged control trees. In the case of clipped trees, the probability of finding the thickest dead branch within the damage area was 42–47%, compared to 40% in the control trees. The thickest green branch was detected within the expected damage area, with a probability of 3% in the control trees and in the mildest treatment, 1, and with a probability of 5–7% in the stronger treatments, 2 and 3. The probability was generally low, indicating that green branches are seldom observed in 5-metre butt logs of Scots pine trees at the age of 40–60 years.
Stem form defects (sweep, single crooks, s-crooks, multiple crooks), vertical branches (over 40 mm in diameter), and scars (over 90 cm in length) were the most common defects in those butt logs that otherwise met the quality requirements of sawlogs. Stem form defects, vertical branches, and scars were detected in 64%, 12%, and 8% of all butt logs, respectively. However, forks were present only in 2% of the butt logs. Branches did not inhibit bucking of sawlogs in the study stands, while green branches over 60 mm in diameter were detected only in one butt log and dead branches over 40 mm diameter in two butt logs. The butt logs of the sample trees that had died during the final five years of the experiment – one in clipping treatment 2 and two in clipping treatment 3 – were graded as pulpwood.
The stronger the clipping treatment, the more likely the stem form of the damaged trees deteriorated (Fig. 4a). While almost half of the butt logs from the undamaged control trees were straight, the proportion of straight butt logs dropped down to 37% in the case of the mildest treated trees (clipping 1) and down to 27% and 22% in the case of the most strongly treated trees (clippings 2 and 3). While one third of the butt logs had single crooks in the clipped sample trees, the proportion among control trees was approximately 20%. Multiple crooks or s-crooks were detected in every third strongly treated tree (clipping 3) and in every fifth mildly treated tree (clippings 1 and 2). Only 15% of the control trees contained multiple crooks. On the other hand, sweep was more commonly observed in untreated control trees (13% of all butt logs) than in the most strongly treated trees (2%). Those trees that were formative trimmed two years after the original clipping to help a side shoot to become the leader by pruning the other shoots did not differ from the other trees in case of any stem form characteristics.
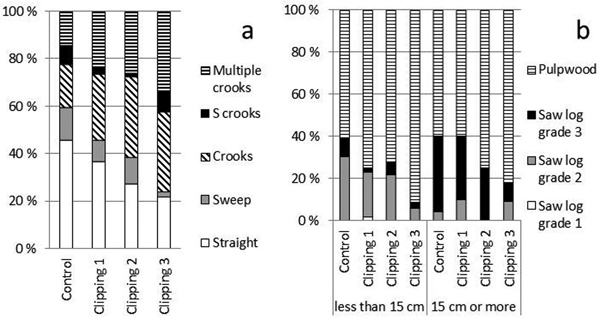
Fig. 4. a) Proportions of straight, sweeped, crooked, s-crooked, and multiple crooked butt logs among sample trees 34 years after artificial moose browsing damage. b) Proportions of different timber assortments (sawlog grades 1–3 and pulpwood) in the grading of butt logs grouped according to a top diameter of under 15 and over 15 cm in the undamaged control and clipping treatments. The log diameter was not accounted for in grading.
Owing to the stem form defects, particularly vertical branches, the butt logs of clipped trees were generally poorer in quality than those of control trees. While almost 40% of the butt logs from the control trees met the minimum quality requirements of sawlog (log grade 3), the proportions were 29, 28, and 11 per cent in clipping treatments 1, 2, and 3, respectively (Table 6). In the case of undamaged control trees, stem form defects decreased the quality of butt logs to pulpwood grade in 54% of the trees and vertical branches in 6% of the trees. In contrast, in the case of clipped sample trees, at least one critical form defect was detected in 63–78% of the butt logs, depending on the treatment. Furthermore, 11–24% of clipped sample tree butt logs had a vertical branch, which degraded the log quality. Scars and forks prevented the bucking of sawlogs more often in the strongest clipping 3 (11% and 9%) than in the control (8% and 2%) and in the milder clippings 1 (8% and 0%) and 2 (7% and 2%).
The clipping treatment not only decreased the sawlog grade of the butt logs but also increased the proportion of butt logs falling into pulpwood grade (Fig. 4b). From the butt logs cut from the control trees, 40% met the minimum requirements of sawlogs and 60% were classified as pulpwood. These proportions did not vary between different sized logs. In addition, in the case of the mildest treated sample trees (clipping 1), approximately 40% of the butt logs with a top diameter of 15 cm or more met the requirements of sawlogs, but the proportion decreased to 25% among smaller logs and both log diameter classes in clipping treatment 2. Only every tenth and every fifth butt log in the strongest treatment (clipping 3) had a sawlog quality in the top diameter classes over and under 15 cm, respectively.
Thick green or dead branches very seldom decreased the grade of a butt log into pulpwood grade, but branches were often the factor defining the sawlog grade. Because of thinner branches, most of the butt logs with a top diameter of under 15 cm fell into log grade 2. This grade contained approximately 30% of the butt logs in this diameter class from the undamaged control trees, and 6–22% of the butt logs from the clipped sample trees, depending on the clipping treatment (Fig. 4b). The proportion of the poorest log grade 3 remained below 10% in all treatments among the butt logs with a top diameter of less than 15 cm. In the case of butt logs with a top diameter of over 15 cm, grade 3 was the most common log grade. This covered 35% of those butt logs from undamaged control trees and 9–30% of butt logs from clipped sample trees. There was typically at least one thicker branch in this log diameter class. Thus, only 4% of the butt logs from the undamaged control trees and 0–10% of the butt logs from the clipped sample trees were classified as log grade 2. Only one butt log met the requirements of log grade 1 among the logs with a top diameter of under 15 cm.
3.3 Model analysis for dimensions and growth of trees in different clipping treatments
According to the ANCOVA models 1–3 (Eq. 1), damage to sample trees at the seedling stage reduced (p < 0.05 for clippings 1–3) the DBH, height, and tree volume of the trees until the stage of measurements. The decrease was most visible in the case of the strongest damaged trees, i.e., clipping treatment 3 (Table 7). This treatment resulted in a decrease of 2.8 cm in DBH, 1.2 m in height, and 68 dm3 in tree volume compared to the untreated control trees. A larger initial tree height, a higher effective temperature sum (1200 DD or more) on fertile sites (MT, VMT, or HMT), and a lower effective temperature sum (below 1200 DD) on poor-fertility sites (VT) had positive effects on the dimensions of the sample trees. The interactions between the site and the effective temperature sum in Models 1–3 were unexpected in northern stands on less fertile sites, because all four study stands on poor-fertility sites were located in southern Finland. Furthermore, the sample trees in two northern stands that were located on fertile sites had grown faster than the sample trees in the two southern stands on poor-fertility sites. We did not use these models to predict the dimensions of the sample trees, but we tested the effects of treatments on their dimensions.
| Table 7. Parameter estimates, standard errors (SE) and p-values for ANCOVA models 1–3 (Eq. 1) predicting the diameter at breast height (DBH), height, and tree volume of trees 34 years after artificial moose browsing damage. | |||||||||
| Variable | Model 1: DBH, cm (r2 = 0.259) | Model 2: Height, m (r2 = 0.713) | Model 3: Volume, dm3 (r2 = 0.341) | ||||||
| Estimate | SE | p | Estimate | SE | p | Estimate | SE | p | |
| Intercept | 27.377 | 4.583 | <0.0001 | 54.695 | 2.109 | <0.0001 | 742.986 | 112.311 | <0.0001 |
| Tree height in 1980, cm | 0.023 | 0.004 | <0.0001 | 0.012 | 0.002 | <0.0001 | 0.603 | 0.087 | <0.0001 |
| Treatment (ref. no clipping) | |||||||||
| - Clipping 1 | –1.589 | 0.534 | 0.0032 | –0.498 | 0.246 | 0.0438 | –40.840 | 13.086 | 0.0020 |
| - Clipping 2 | –2.422 | 0.569 | <0.0001 | –0.867 | 0.262 | 0.0010 | –60.689 | 13.937 | <0.0001 |
| - Clipping 3 | –2.830 | 0.635 | <0.0001 | –1.202 | 0.292 | <0.0001 | –68.654 | 15.564 | <0.0001 |
| Site MT 1) | –12.081 | 5.238 | 0.0218 | –57.079 | 2.410 | <0.0001 | –861.684 | 128.375 | <0.0001 |
| Temperature sum in Site MT 2) | –0.001 | 0.002 | 0.5534 | 0.014 | 0.001 | <0.0001 | 0.199 | 0.060 | 0.0010 |
| Temperature sum in Site VT 3) | –0.012 | 0.004 | 0.0008 | –0.032 | 0.002 | <0.0001 | –0.524 | 0.087 | <0.0001 |
| 1) Values: 1 for a tree in Myrtillus site (or corresponding); otherwise 0. 2) Values: temperature sum (DD) for a tree in Myrtillus site (or corresponding); otherwise 0. 3) Values: temperature sum (DD) for a tree in Vaccinium site; otherwise 0. | |||||||||
The initial tree height, effective temperature sum, and site fertility in Models 4–6 (Eq. 1) predicting the height growth of sample trees during the 34-year experiment (Table 8) had effects similar to those in Models 1–3 that predict the dimensions of sample trees at the end of the experiment. According to Models 4 and 6, damage decreased (p < 0.05) only the height growth of the sample trees in treatments 2 and 3 during the first and final five years of the experiment. On the other hand, the 5-year height growths of the sample trees in clipping treatment 1 did not differ from those of the undamaged control trees (p > 0.20). Clipping treatment did not have any effect on the height growth of trees during the first ten years after clipping (p > 0.10 for all treatments).
| Table 8. Parameter estimates, standard errors (SE), and p-values for ANCOVA models 4–6 (Eq. 1) predicting the annual tree height increment of trees in years 1981–1985, 1981–1990, and 2009–2013. | |||||||||
| Variable | Model 4: Increment in 1981–1985, cm a–1 (r2 = 0.691) | Model 5: Increment in 1981–1990, cm a–1 (r2 = 0.771) | Model 6: Increment in 2009–2013, cm a–1 (r2 = 0.134) | ||||||
| Estimate | SE | p | Estimate | SE | p | Estimate | SE | p | |
| Intercept | 173.413 | 9.411 | <0.0001 | 193.340 | 7.704 | <0.0001 | 67.757 | 11.915 | <0.0001 |
| Tree height in 1980, cm | 0.027 | 0.007 | 0.0003 | 0.023 | 0.006 | 0.0001 | 0.021 | 0.009 | 0.0248 |
| Treatment (ref. no clipping) | |||||||||
| - Clipping 1 | –1.125 | 1.097 | 0.3059 | –0.354 | 0.898 | 0.6937 | –1.739 | 1.388 | 0.2115 |
| - Clipping 2 | –2.858 | 1.168 | 0.0150 | –1.388 | 0.956 | 0.1478 | –2.958 | 1.479 | 0.0464 |
| - Clipping 3 | –4.622 | 1.304 | 0.0005 | –1.748 | 1.068 | 0.1027 | –5.821 | 1.651 | 0.0005 |
| Site MT 1) | –226.552 | 10.757 | <0.0001 | –239.856 | 8.806 | <0.0001 | –53.590 | 13.619 | 0.0001 |
| Temperature sum in site MT 2) | 0.081 | 0.005 | <0.0001 | 0.077 | 0.004 | <0.0001 | 0.019 | 0.006 | 0.0032 |
| Temperature sum in site VT 3) | –0.103 | 0.007 | <0.0001 | –0.117 | 0.006 | <0.0001 | –0.028 | 0.009 | 0.0030 |
| 1) Values: 1 for a tree in Myrtillus site (or corresponding); otherwise 0. 2) Values: temperature sum (DD) for a tree in Myrtillus site (or corresponding); otherwise 0. 3) Values: temperature sum (DD) for a tree in Vaccinium site; otherwise 0. | |||||||||
3.4 Model analysis for quality and dimensions of butt logs from different clipping treatments
According to Model 7 (Eq. 1), damage decreased the diameter of the thickest dead branch in a butt log (p < 0.04) in all clipping treatments, when compared to the control trees (Table 9). The influence was strongest in treatment 2, in which the treatment resulted in a decrease of 2.8 mm in the diameter of the thickest dead branch in a log, compared to the unclipped control. A larger tree height at the start of experiment in 1980 increased the diameter of the thickest dead branch in a butt log significantly. The effects of a lower temperature sum (less than 1180 DD) on VT sites, and a higher temperature sum (1180 DD or more) on MT (or corresponding) sites were similar (p < 0.0001 for all predictors).
| Table 9. Parameter estimates, standard errors (SE), and p-values for ANCOVA model 7 (Eq. 1) predicting the diameter of the thickest dead branch in a butt log 34 years after artificial moose browsing damage. | |||
| Variable | Model 7: Branch diameter, mm (r2 = 0.303) | ||
| Estimate | SE | p | |
| Intercept | 61.297 | 6.940 | <0.0001 |
| Tree height in 1980, cm | 0.025 | 0.006 | <0.0001 |
| Treatment (ref. no clipping) | |||
| - Clipping 1 | –1.842 | 0.812 | 0.0240 |
| - Clipping 2 | –2.816 | 0.861 | 0.0012 |
| - Clipping 3 | –2.102 | 0.972 | 0.0315 |
| Site MT 1) | –62.165 | 7.934 | <0.0001 |
| Temperature sum in site MT 2) | 0.019 | 0.004 | <0.0001 |
| Temperature sum in site VT 3) | –0.034 | 0.005 | <0.0001 |
| 1) Values: 1 for a tree in Myrtillus site (or corresponding); otherwise 0. 2) Values: temperature sum (DD) for a tree in Myrtillus site (or corresponding); otherwise 0. 3) Values: temperature sum (DD) for a tree in Vaccinium site; otherwise 0. | |||
The effects of damage to sample trees on the occurrence of vertical branches in butt logs were studied using two logistic regression models (Eq. 2). We were interested firstly in the vertical branches of all sizes within the damage area of a butt log (Model 8) and, secondly, in the vertical branches of 40 mm or more in diameter in a whole butt log (Model 9; Table 10). According to Model 8, all clipping treatments significantly increased the probability of finding a vertical branch within the damage area. The highest probabilities of encountering a vertical branch, compared to the control trees, were found in clipping treatments 2 (approx. 11–fold, p < 0.0001) and 3 (9-fold, p < 0.0001), and a lower probability in treatment 1 (4-fold compared to the control, p = 0.0029). A larger tree height at the start of the experiment also increased the probability (p = 0.0003) to find a vertical branch near the damage area.
| Table 10. Parameter estimates for the logistic regression models 8–10 (Eq. 2) predicting the probability of vertical branches and stem form defects in a butt log 34 years after artificial moose browsing damage. Model 8: all vertical branches within the damaged area in a butt log. Model 9: vertical branches with diameters of 40 mm or more in a whole butt log. Model 10: all stem form defects (which are not allowed in the sawlogs; see Table 3 for bucking rules) in the butt log. | ||||||
| Variable | Estimate | SE | Wald | df | p | Exp(B) |
| Model 8: | Vertical branches within damage area (all branches) (Nagelkerke R Square = 0.205) | |||||
| Intercept | –4.372 | 0.687 | 40.476 | 1 | <0.0001 | 0.013 |
| Tree height in 1980, cm | 0.009 | 0.002 | 13.179 | 1 | 0.0003 | 1.009 |
| Treatment (ref. no clipping) | 34.899 | 3 | <0.0001 | |||
| - Clipping 1 | 1.337 | 0.448 | 8.889 | 1 | 0.0029 | 3.808 |
| - Clipping 2 | 2.425 | 0.445 | 29.657 | 1 | <0.0001 | 11.306 |
| - Clipping 3 | 2.231 | 0.471 | 22.408 | 1 | <0.0001 | 9.312 |
| Model 9: | Vertical branches in whole butt log (branches of 40 mm or more) (Nagelkerke R Square = 0.109) | |||||
| Intercept | –4.390 | 0.829 | 28.064 | 1 | <0.0001 | 0.012 |
| Tree height in 1980, cm | 0.007 | 0.003 | 5.597 | 1 | 0.0180 | 1.007 |
| Treatment (ref. no clipping) | 8.676 | 3 | 0.0339 | |||
| - Clipping 1 | 0.682 | 0.568 | 1.442 | 1 | 0.2298 | 1.977 |
| - Clipping 2 | 1.189 | 0.550 | 4.676 | 1 | 0.0306 | 3.283 |
| - Clipping 3 | 1.532 | 0.553 | 7.662 | 1 | 0.0056 | 4.627 |
| Model 10: | Stem form defects in whole butt log (any crooks, sweep of 1 cm or more per one meter) (Nagelkerke R Square = 0.267) | |||||
| Intercept | –7.943 | 1.335 | 35.411 | 1 | <0.0001 | 0.000 |
| Temperature sum, DD | 0.005 | 0.001 | 26.029 | 1 | <0.0001 | 1.005 |
| Tree height in 1980, cm | 0.009 | 0.002 | 14.132 | 1 | 0.0002 | 1.009 |
| Treatment (ref. no clipping) | 8.305 | 3 | 0.0401 | |||
| - Clipping 1 | 0.323 | 0.341 | 0.897 | 1 | 0.3435 | 1.382 |
| - Clipping 2 | 0.820 | 0.378 | 4.700 | 1 | 0.0302 | 2.269 |
| - Clipping 3 | 1.100 | 0.458 | 5.777 | 1 | 0.0162 | 3.003 |
According to Model 9, severe damage to sample trees increased the probability of thick vertical branches in the butt log (p = 0.0339). The effect was significant in clipping 3, which increased the probability of vertical branches to approximately 5-fold (p = 0.0059), and in clipping 2, in which the probability was 3-fold (p = 0.0306). Treatment 1 did not have an influence on the occurrence (p = 0.2298) of vertical branches in the butt log section. A larger tree height at the start of the experiment increased the probability of vertical branches in the butt log (p = 0.0180).
The effect of clipping treatment on the occurrence of stem form defects in the butt log section was analysed using logistic regression model 10 (Table 10). Treatments 2 and 3 significantly increased the probability of stem form defects (p = 0.0385), but the negative effect was not as strong as in the case of dimensions, growth, or the occurrence of vertical branches. Similarly to vertical branches, the effect on stem form defects was significant only in treatment 3, increasing the probability of stem form defects to 3-fold (p = 0.0162), and in treatment 2, by increasing the probability to 2-fold (p = 0.0302). The mildest treatment, 1, did not have an influence on the occurrence of stem form defects (p = 0.3435). A higher effective temperature sum (p < 0.0001) and a larger tree height at the beginning of the experiment (p = 0.0002) also increased the probability of finding stem form defects.
The percentage of logs meeting the minimum quality requirements of sawlogs was generally low in the study material (Fig. 4b). Despite this finding, the negative effects of damage to the sample trees were shown also by a logistic regression analysis in Model 11, which predicts the probability of butt log of log grade 3 at the minimum (p = 0.0385; Table 11). However, only the strongest treatment (clipping 3) resulted in a significant decrease in the probability of getting a sawlog (p = 0.0039), where the expected probability decreased by 80% (Table 11). Other clipping treatments did not differ from the control (p > 0.35).
| Table 11. Parameter estimates for the logistic regression model 11 (Eq. 2) predicting the probability of achieving a sawlog quality butt log 34 years after artificial moose browsing damage. The butt log was graded as a sawlog only if the quality requirements for log grade 3 were met. Log diameter was not taken into account in grading. | ||||||
| Variable | Estimate | SE | Wald | df | p | Exp(B) |
| Model 11: | Probability of getting a sawlog according to the bucking rules (only quality notified) (Nagelkerke R Square = 0.283) | |||||
| Intercept | 4.249 | 1.7144 | 6.144 | 1 | 0.0132 | 70.064 |
| Temperature sum, DD | –0.003 | 0.0014 | 5.327 | 1 | 0.0210 | 0.997 |
| Tree height in 1980, cm | –0.007 | 0.0026 | 7.877 | 1 | 0.0050 | 0.993 |
| Site MT 1) | 0.842 | 0.3949 | 4.548 | 1 | 0.0330 | 2.321 |
| Treatment (ref. no clipping) | 8.397 | 3 | 0.0385 | |||
| - Clipping 1 | –0.301 | 0.3560 | 0.715 | 1 | 0.3978 | 0.740 |
| - Clipping 2 | –0.347 | 0.3795 | 0.834 | 1 | 0.3612 | 0.707 |
| - Clipping 3 | –1.611 | 0.5583 | 8.326 | 1 | 0.0039 | 0.200 |
| 1) Values: 1 for a tree in Myrtillus site (or corresponding); otherwise 0. | ||||||
4 Discussion
4.1 Effects of artificial moose browsing damage on tree growth
Clipping the main shoot affected tree growth more during the study period the more severely the tree had been damaged at the beginning of the experiment. The growth effects of damage were more obvious in DBH than in height. With an average annual increment in DBH of 2 mm, trees subjected, for example, to treatments 1 and 2 would need an additional 8 and 14 years, respectively, to reach the same DBH than the control trees. The growth potential of the site (soil fertility and temperature sum) was an important background factor, however, affecting more height and volume growth than diameter increment.
Effects of clipping treatments on tree height growth were investigated separately for the first five-year period after damage and the final five-year period before felling the trees. The height growth differences between the damaged and control trees were modest but significant to both five-year periods. The only exception was the lightest treatment, 1, in which only the topmost shoot was removed, resulting in insignificant height differences between the damaged and control trees at the end of the study period. It should be noted that height growth reduction weakens the competitive position of a tree in a stand, which may accumulate the adverse physiological effects of moose browsing on the vitality, growth potential, and vulnerability to biotic damage in the course of time (Långström and Hellqvist 1992).
Löyttyniemi (1983) noticed that five years after the clipping, the height development of the strongly treated Scots pine trees decreased by 11–45% in comparison to the untreated control trees if the cutting point was 3–5 branch whorls below the leader shoot. If cut above the second whorl of branches from the top, the height growth of trees was almost equal to the growth of the control trees.
In comparison, when the evaluation period of damage was extended up to ten years after damage, no further differences were observed in the height growth between the damaged and the control trees in our results. Heikkilä and Löyttyniemi (1992) also reported that mild clipping of the topmost shoots did not reduce the diameter and height growth of trees in comparison to untreated trees during the ten years following the clipping. The stronger treatments, cutting below second or third branch whorl, on the other hand, caused significant effects on both diameter and height growth (Heikkilä and Löyttyniemi 1992). In this study, we analysed the trees after more than two decades longer than Heikkilä and Löyttyniemi (1992); therefore, our results show the effects more clearly.
4.2 Effects of artificial moose browsing damage on stem quality
In our study, the decreased growth of sample trees caused by cutting the branches and/or leader shoot resulted in smaller branches, expressed by the diameter of the thickest branch in the butt log section. Compared to the control trees, the slower height and diameter growth of the clipped sample trees also resulted in a lower location of the thickest branches in stems, because of the slow development of their crown. Soil fertility and temperature sum had similar parallel effects through their influence on the growth.
The clipping treatments increased the probability of vertical branches and stem crooks in the sample trees. The more severely the trees had been damaged, the more common these defects were in the stems. The occurrence of sweep was not affected by the clipping treatments. The reasons for sweep are typically soil instability that causes poor anchoring of the root system, snow or wind loads, non-centric crown structure caused, for example, by competition, and an unfavourable genetic heritage (Zobel and van Buijtenen 1989). Generally, sweep is not as bad a problem as crookedness in the processes of saw milling, rotary-cutting, or slicing of veneers. Sweep is usually more common in cultivated than in naturally regenerated Scots pine stands, and more common in sparsely spaced stands than in dense stands (Kärkkäinen and Uusvaara 1982).
The occurrence of other technical defects in the butt logs, such as oversized branches, forks, or surface defects, did not differ significantly between the damaged and control trees. However, the butt log sections of the most severely damaged trees (treatment 3) had more forks and surface defects than those of the control trees. Vertical branches were more common in the damaged trees, and they were located nearer to the original damage point. Clipping treatment 2 resulted in the most frequent occurrence of vertical branches in the butt log section. Both stronger treatments 2 and 3 decreased the quality of butt logs considerably by increasing the number of large (>40 mm diameter) vertical branches and stem form defects. Similarly, Heikkilä and Löyttyniemi (1992) noticed a positive correlation between the strength of the clipping treatment and the occurrence of crooks and thick branches.
Löyttyniemi (1983) reported that every third pine seedling has stem defects (crook, vertical branch, fork) five years after breaking the stem above the top whorl. If lower leader shoots were cut, almost all pine seedlings had stem defects five years later. In our study, defects in the butt log section were detected in 71–89% of the damaged trees, depending on the treatment. The smallest stem defects overgrew during the 34-year-long study period.
Although the sawlog quality of butt logs decreased as a result of all clipping treatments, only the strongest treatment, 3, typically downgraded the butt logs into pulpwood grade, when the log size was not considered. It was interesting that the largest-diameter dead branches on the butt log section were detected in the control trees, whereas the smallest branches were in those trees damaged by clipping treatment 2. Thus, if vertical branches are not taken into account, the clipping treatments, in a way, improved the general branchiness quality of the butt logs. However, the effects of the knot size should be examined in relation with the log diameter, which was smaller in the damaged trees than in the control trees.
4.3 Experiment in relation to real-life conditions
This study was based on an experiment in which Scots pine trees were artificially damaged using secateurs. The damage caused by clipping obviously differs from that caused by moose which breaks off, tears, and bends the stems and twigs of the trees in an irregular manner. In addition, here the damage occurred only once, whereas it is typical for moose damage to re-occur several years in the same stand (Bergqvist et al. 2003). In this respect, our results are more likely underestimates than overestimates of the real browsing effects on the stem and timber quality.
In addition to the external defects detected in this study, even larger economic losses probably occur if logs with non-visible internal defects cannot be detected in bucking and end up in sawmills. This was concluded in the study of Nordström (2005), who studied the quality of sawn timber obtained from Scots pine logs from thinning stands in northern Sweden. There moose damage was an important cause of technical defects and losses in the value of sawn timber. Härkönen et al. (2009) observed that birch trees damaged by moose as seedlings suffered not only from visible damage in stem form but also from internal discolouration and decay. Therefore, models predicting the development of the technical quality of stems and their prospective value when felled are needed in order to estimate the economic effects of moose browsing damage. While this paper focused on the external quality attributes, the internal log quality will be studied in a forthcoming paper on further analysis of the same experiment.
5 Conclusions
This research is the first controlled, long-term, experimental study focusing on the sawlog quality and tree dimensions of Scots pine after moose browsing. There have been shorter-period experiments on effects of browsing Scots pine seedlings once at a time (Löyttyniemi 1983; Heikkilä and Löyttyniemi 1992) and one experiment on effects of repeated browsing (Wallgren et al. 2014). Sandgren (1980), Edenius et al. (1995), and Bergqvist et al. (2001, 2003, 2014) also investigated the browsing behaviour of moose and the impacts of browsing damage on the quality of Scots pine trees, however, with a considerably shorter time period between the damages and the analysis of their effects. These studies were not based on long-term control and verification of the original damages or were missing pre-browsing measurements of the trees.
The results show that both stem quality and dimensions suffer from browsing damage. Deterioration of stem form and most often the vertical branches are the most typical externally detectable defects that can be traced to the browsing damages. In terms of forest management and silviculture operations, trees with leader shoot breakage should be removed from seedling or sapling stands or during the first commercial thinning as long as sufficient number of undamaged trees per hectare are available for future growing. Further work is needed to assess the effects of moose browsing damage on the internal quality and economic value of Scots pine.
Acknowledgements
First, we are grateful to the work of past generations of researchers: namely, Professor at Finnish Forest Research Institute (Metla) Dr. Yrjö Vuokila, who originally established the experiment in 1980. The authors gratefully acknowledge the support from the Ministry of Agriculture and Forestry in Finland (project: Moose and forest damage) and Natural Resources Institute Finland (Luke) (project: Wildforest, Integrated planning for wildlife and forestry). Without the work done by many skilful and experienced field personnel of our institute during experiment this research would not have been possible, many thanks for their valuable work. We also acknowledge Maija Wallén for drawing the figures of seedlings.
References
Bergqvist G., Bergström R., Edenius L. (2001). Patterns of stem damage by moose (Alces alces) in young Pinus sylvestris stands in Sweden. Scandinavian Journal of Forest Research 16(4): 363–370. https://doi.org/10.1080/02827580152496759.
Bergqvist G., Bergström R., Edenius L. (2003). Effects of moose (Alces alces) rebrowsing on damage development in young stands of Scots pine (Pinus sylvestris). Forest Ecology and Management 176(1–3): 397–403. https://doi.org/10.1016/S0378-1127(02)00288-8.
Bergqvist G., Bergström R., Wallgren M. (2013). Summer browsing by moose on Scots pine. Scandinavian Journal of Forest Research 28(2): 110–116. https://doi.org/10.1080/02827581.2012.725767.
Bergqvist G., Bergström R., Wallgren M. (2014). Recent browsing damage by moose on Scots pine, birch and aspen in young commercial forests – effects of forage availability, moose population density and site productivity. Silva Fennica 48(1) article 1077. https://doi.org/10.14214/sf.1077.
Bergqvist G., Wallgren M., Jernelid H., Bergström R. (2018). Forage availability and moose winter browsing in forest landscapes. Forest Ecology and Management 419–420: 170–178. https://doi.org/10.1016/j.foreco.2018.03.049.
Cajander A.K. (1949) Forest types and their significance. Acta Forestalia Fennica 56(5): 1–71. https://doi.org/10.14214/aff.7396.
Edenius L., Danell K., Nyquist H. (1995). Effects of simulated moose browsing on growth, mortality, and fecundity in Scots pine: relations to plant productivity. Canadian Journal of Forest Research 25(4): 529–535. https://doi.org/10.1139/x95-060.
Gill R.M.A. (1992). A review of damage by mammals in north temperate forests: 3. Impact on trees and forests. Forestry 65(4): 363–388. https://doi.org/10.1093/forestry/65.4.363-a.
Härkönen S., Pulkkinen A., Heräjärvi H. (2009). Wood quality of birch (Betula spp.) damaged by moose. Alces 45: 67–72.
Heikkilä R. (2000). Männyn istutustaimikoiden metsänhoidollinen tila hirvivahingon jälkeen Etelä-Suomessa. [Silvicultural status of planted Scots pine stands after moose browsing damage in Southern Finland]. Metsätieteen aikakauskirja 2/2000: 259–267. [In Finnish]. https://doi.org/10.14214/ma.6011.
Heikkilä R., Löyttyniemi K. (1992). Growth response of young Scots pines to artificial shoot breaking simulating moose damage. Silva Fennica 26(1): 19–26. https://doi.org/10.14214/sf.a15627.
Heikkilä R., Härkönen S. (1996). Moose browsing in young Scots pine stands in relation to forest management. Forest Ecology and Management 88(1–2): 179–186. https://doi.org/10.1016/S0378-1127(96)03823-6.
Hörnberg S. (2001). The relationship between moose (Alces alces) browsing utilisation and the occurrence of different forage species in Sweden. Forest Ecology and Management 149(1–3): 91–102. https://doi.org/10.1016/S0378-1127(00)00547-8.
IBM Corp. (2018). IBM SPSS statistics for Windows, version 25.0. IBM Corp., Armonk, NY. https://www.ibm.com/support/knowledgecenter/en/SSLVMB_25.0.0/. [Cited 11 June 2019].
Jalkanen A. (2001). The probability of moose damage at the stand level in southern Finland. Silva Fennica 35(2): 159–168. https://doi.org/10.14214/sf.593.
Kärkkäinen M., Uusvaara O. (1982). Nuorten mäntyjen laatuun vaikuttavia tekijöitä. [Factors affecting the quality of young pines]. Folia Forestalia 515: 1–28. [In Finnish with English summary]. http://urn.fi/URN:ISBN:951-40-0567-8.
Korhonen K.T., Heikkinen J., Henttonen H., Ihalainen A., Pitkänen J., Tuomainen T. (2006). Suomen metsävarat 2004–2005. [Finnish forest resources 2004–2005]. Metsätieteen aikakauskirja 1B/2006: 183–221. [In Finnish]. https://doi.org/10.14214/ma.6174.
Laasasenaho J. (1982). Taper curve and volume functions for pine, spruce and birch. Communicationes Instituti Forestalis Fenniae 108. 74 p. http://urn.fi/URN:ISBN:951-40-0589-9.
Långström B., Hellqvist C. (1992). Height growth recovery and crown development in top-damaged Pinus sylvestris trees. Scandinavian Journal of Forest Research 7(1–4): 237–247. https://doi.org/10.1080/02827589209382716.
Lavsund S., Nygrén T., Solberg E.J. (2003). Status of moose populations and challenges to moose management in Fennoscandia. Alces 39: 109–130.
Löyttyniemi K. (1983). Männyn taimen kehitys latvan katkeamisen jälkeen. [Recovering of young Scots pines from stem breakage]. Folia Forestalia 560. 11 p. [In Finnish with English summary]. http://urn.fi/URN:ISBN:951-40-0625-9.
Markgren G. (1974). The moose in Fennoscandia. Le Naturaliste Canadien 101: 185–194.
Metsäkeskus (1999). Puutavaralajien mitta- ja laatuvaatimukset. [Dimensions and quality requirements for timber assortments]. http://www.virtuaali.info/opetusmaatilat/13/file/puutavaranLaatuvaatimukset_1999_www.pdf. [In Finnish]. [Cited 8 June 2020].
Nevalainen S., Matala J., Korhonen K.T., Ihalainen A., Nikula A. (2016). Moose damage in National Forest Inventories (1986–2008) in Finland. Silva Fennica 50(2) article 1410. https://doi.org/10.14214/sf.1410.
Nikula A., Hallikainen V., Jalkanen R., Hyppönen M., Mäkitalo K. (2008). Modelling the factors predisposing Scots pine to moose damage in artificially regenerated sapling stands in Finnish Lapland. Silva Fennica 42(4): 587–603. https://doi.org/10.14214/sf.235.
Nordström G. (2005). Virkeskvalitet hos tall från förstagallringar − en provsågning vid Holmsunds sågverk. [Quality of pine timber from first thinnings – a test sawing at Holmsund sawmill]. Institutionen för skogsskötsel, Sveriges lantbruksuniversitet (SLU), Examensarbeten Trä och fiber 2005:3. 28 p. [In Swedish]. http://urn.kb.se/resolve?urn=urn:nbn:se:slu:epsilon-s-8416.
Sandgren M. (1980). Produktionsförluster och kvalitetsnedsättningar i en älgbetad tallkultur. [Reduction of wood production and tree quality by moose browsing in managed Scots pine forest]. Svergies lantbruksuniversitet (SLU), Institutionen för skogsskötsel, Examensarbete 1980-5. 29 p. + App. [In Swedish].
Stöd R., Kilpeläinen H., Wall T. (2006). Yield and technical quality of Scots pine saw timber from thinnings on drained peatlands and mineral soils in Finland. Baltic Forestry 12(2): 170–183.
Uusitalo J., Isotalo J. (2005). Predicting knottiness of Pinus sylvestris for use in tree bucking procedures. Scandinavian Journal of Forest Research 20(6): 521–533. http://doi.org/10.1080/02827580500407109.
Uusitalo J., Ylhäisi O., Rummukainen H., Makkonen M. (2018). Predicting probability of A-quality lumber of Scots pine (Pinus sylvestris L.) prior to or concurrently with logging operation. Scandinavian Journal of Forest Research 33(5): 475–483. http://doi.org/10.1080/02827581.2018.1461922.
Vaahtera E., Aarne M., Ihalainen A., Mäki-Simola E., Peltola A., Torvelainen J., Uotila E., Ylitalo E. (2018). Metsätilastot – Finnish Forest Statistics. Finnish Natural Resources Institute (Luke). ISBN 978-952-326-701-5. https://stat.luke.fi/sites/default/files/suomen_metsatilastot_2018_verkko.pdf. [In Finnish and English].
Verkasalo E., Kilpeläinen H. (2014). Puutuoteteollisuuden raaka-aineen laatu ja kilpailukyky. [Quality and competitiveness of the raw material for wood product industries] In: Heräjärvi H., Kettunen L., Murtovaara I. (eds.). Uudistuvat puutuotearvoketjut ja puunhankintaratkaisut (PUU) – Tutkimus- ja kehittämisohjelman loppuraportti. Metlan työraportteja / Working Papers of the Finnish Forest Research Institute 284: 9–21. [In Finnish]. http://urn.fi/URN:ISBN:978-951-40-2461-0.
Wall T., Fröblom J., Kilpeläinen H., Lindblad J., Heikkilä A., Song T., Stöd R., Verkasalo E. (2005). Harvennusmännyn hankinnan ja sahauksen kehittäminen. [Development of timber procurement and sawing of Scots pine from thinning stands]. Wood Wisdom -tutkimusohjelman hankekonsortion julkinen loppuraportti. Metsäntutkimuslaitoksen tiedonantoja 943. 129 p. + App. [In Finnish]. http://urn.fi/URN:ISBN:951-40-1977-6.
Wallgren M., Bergquist J., Bergström R., Eriksson S. (2014). Effects of timing, duration, and intensity of simulated browsing on Scots pine growth and stem quality. Scandinavian Journal of Forest Research 29(8): 734–746. https://doi.org/10.1080/02827581.2014.960896.
Total of 34 references.
