Agnese Gailīte  ,
Anita Gaile,
Dainis E. Ruņģis
,
Anita Gaile,
Dainis E. Ruņģis
Genetic diversity and structure of wild Vaccinium populations - V. myrtillus, V. vitis-idaea and V. uliginosum in the Baltic States
Gailīte A., Gaile A., Ruņģis D. E. (2020). Genetic diversity and structure of wild Vaccinium populations - V. myrtillus, V. vitis-idaea and V. uliginosum in the Baltic States. Silva Fennica vol. 54 no. 5 article id 10396. https://doi.org/10.14214/sf.10396
Highlights
- Wild Vaccinium species were studied using EST-SSR and chloroplast SSR markers
- Populations were moderately genetically differentiated, but without higher order clustering of groups of populations
- Genetic diversity of populations growing under different management regimes was similar
- Selection of populations for in situ conservation should focus on rare genotypes, more differentiated populations and geographic coverage.
Abstract
Vaccinium myrtillus L., V. vitis-idaea L. and V. uliginosum L. belong to the genus Vaccinium. These wild species are widely distributed and ecologically important within the Baltic countries but they have not been extensively studied using molecular markers. EST-SSR and cpSSR markers were used to investigate the population structure and genetic diversity of these species to obtain information useful for the development of in situ conservation strategies. Wild Vaccinium species populations are moderately genetically differentiated, with some populations more highly differentiated, but without higher order clustering of groups of populations, indicating that there are no dispersal barriers for these species within the Baltic countries. Genetic diversity of populations growing in protected areas, managed forests and intensively utilised public recreational areas is similar. The results from this study can be utilised for the selection of populations for the in situ conservation of the studied Vaccinium species. In addition, complementary ex situ conservation strategies can be used for the preservation of rare varieties (e.g. V. myrtillus var. leucocarpum).
Keywords
molecular markers;
bilberries;
bog bilberries;
chloroplast SSR;
in situ conservation;
lingonberries;
nuclear SSR
-
Gailīte,
Genetic Resource Centre, Latvian State Forest Research Institute “Silava”, 111 Rigas Street, Salaspils, Latvia, LV-2169
E-mail
agnese.gailite@silava.lv
- Gaile, Genetic Resource Centre, Latvian State Forest Research Institute “Silava”, 111 Rigas Street, Salaspils, Latvia, LV-2169 E-mail anita.gaile@silava.lv
-
Ruņģis,
Genetic Resource Centre, Latvian State Forest Research Institute “Silava”, 111 Rigas Street, Salaspils, Latvia, LV-2169
 https://orcid.org/0000-0001-5173-2912
E-mail
dainis.rungis@silava.lv
https://orcid.org/0000-0001-5173-2912
E-mail
dainis.rungis@silava.lv
Received 15 June 2020 Accepted 18 November 2020 Published 26 November 2020
Views 75556
Available at https://doi.org/10.14214/sf.10396 | Download PDF

Supplementary Files
1 Introduction
The genus Vaccinium consists of approximately 450 species with a wide geographic distribution, from the northern hemisphere to tropical Asia and Central and South America (Song and Hancock 2011). The wild species of this genus distributed in the Europe are V. myrtillus L. (bilberry), V. vitis-idaea L. (lingonberry, cowberry) and V. uliginosum L. (bog bilberry) as well as V. oxycoccos L. (small cranberry). V. myrtillus, V. vitis-idaea and V. uliginosum frequently grow in similar environmental conditions (Nestby et al. 2011) and are competitors. These species are widely distributed across Europe, northern America and Asia (Nestby et al. 2019), in Latvia grow in various forests (mostly pine) and bogs (Priedītis 2014). V. myrtillus and V. uliginosum are perennial deciduous dwarf shrubs. V. myrtillus propagates sexually (by seeds) and vegetatively and can form large clonal patches 5–15 m in diameter (Richie 1956). V. vitis-idaea is a perennial evergreen dwarf shrub, which propagates both by seeds and vegetatively and also can form large patches (Richie 1955b). V. myrtillus and V. vitis-idaea can form natural hybrids (Vaccinium x intermedium Ruthe), with the hybridisation direction always occurring with V. vitis-idaea as the pollen donor, and having morphological features more closely resembling V. myrtillus (Richie 1955a). These wild hybrids have been found in the UK, Finland, Germany, Poland, Denmark, Russia and the Netherlands (Lätti et al. 2011; Ponikierska et al. 2004). V. myrtillus and V. vitis-idaea are diploid (Richie 1955b; Richie 1956), but V. uliginosum has been reported to have great morphological and ploidy level variation (2n = 24, 36, 48, 72), with diploid or tetraploid forms predominating (Alsos et al. 2002; Celka and Szkudlarz 2006; Regele et al. 2017), and at least five subspecies have been proposed (Young 1970). Diploid V. uliginosum is recognized as V. uliginosum ssp. microphyllum Lange and found in Greenland, in the Eurasian mountains and North America (Jacquemart 1996). It is common in alpine and high artic areas (Young 1970). Tetraploid V. uliginosum ssp. uliginosum is more widespread in Eurasia, found in bogs in northern Europe, Iceland, Greenland (Young 1970). A hexaploid V. uliginosum subspecies has been reported in Japan (Jacquemart 1996). Both diploid as well as tetraploid V. uliginosum were found in the European Alps (Regele et al. 2017).
The conservation of plant genetic resources is vital to maintain genetic diversity, and characterization of these resources facilitates utilisation, for example by ensuring the availability of diverse germplasm for breeding. An increasing emphasis is being placed on in situ conservation, as a complement to ex situ conservation efforts (Maxted et al. 2010; Maxted et al. 2015; Phillips et al. 2016). National CWR (crop wild relative) conservation strategies are important for in situ conservation of European diversity (Maxted et al. 2015). In addition, the importance of wild harvested plants, and the ecosystem services that they provide are being recognised (Vari et al. 2020; Schulp et al. 2014). In Northern Europe, V. myrtillus, V. vitis-idaea and V. uliginosum are not only an important feed source for wild animals and birds, but are widely utilised as wild harvested plants and used as local medicine and food. Several V. vitis-idaea cultivars have been developed in breeding programs at the National Botanic Garden of Latvia: “Salaspils Ražīgā”, “Rubīna Lāse”, “Jūlija” (Ripa and Audriņa 2009). In order to develop and implement an in situ conservation strategy for these species, knowledge about the genetic diversity and population structure is required.
DNA markers can provide a more accurate assessment of diversity and structure of populations compared to the use of morphological or other traits. The majority of molecular studies for the genus Vaccinium have been done on species of the section Cyanococcus (Boches et al. 2005; Rowland et al. 2003) whereas V. myrtillus belongs to the section Myrtillus, V. vitis-idaea – to the section Vitis-idaea and V. uliginosum – to the section Vaccinium (Nestby et al. 2011). There are only a few reports about the investigation of these species with molecular markers: RAPD (Bjedov et al. 2015), ISSR (Debnath 2007; Zoratti et al. 2015), AFLP (Albert et al. 2003), and ITS, AFLP and cpDNA (Eidesen et al. 2007). In this study we used EST SSR markers developed for the section Cyanococcus (Boches et al. 2005) as well as chloroplast markers. SSR markers are informative, codominant and transferable among related species, however allele dosage can be difficult to determine for polyploids (Vieira et al. 2016). Chloroplast SSR markers have been widely used in studies of population genetic structure in wild and agricultural species, and species-specific chloroplast markers are reported to be more polymorphic and informative compared to universal markers (Wheeler et al. 2014).
The aim of this research was to investigate the population structure and genetic diversity of V. myrtillus, V. vitis-idaea and V. uliginosum in Latvia as well as in Estonia and Lithuania to obtain information to assist in the development and implementation of in situ conservation strategies for these species.
2 Materials and methods
2.1 Sampling and DNA extraction
Samples of V. myrtillus, V. vitis-idaea and V. uliginosum were collected in over 20 locations in Latvia, 8–9 locations in Lithuania and 5–7 locations in Estonia (see Fig. 1 for details). Leaf samples from 14–56 individuals were collected from each population in Latvia (average 25.5) and from 10–17 (average 15.4) individuals in the other populations. The larger number of individuals collected from Latvian populations was due to sampling of individuals from different forest types, that were located in close proximity to each other. As no genetic differentiation was detected between samples from different forest types within one location, these samples were subsequently analysed as a single population. The majority of Latvian populations were collected from forest stands managed by the Joint Stock Company “Latvia’s State Forests”. Long-term forest management activities (thinning, felling etc.) are present in these areas but they are not heavily utilised for recreational activities or berry picking. An additional two populations were sampled in Latvia: Beberbeķu parks (all three species) and Mežaparks (V. myrtillus), which are protected areas and recreation zones close to the city centre of the capital Riga. This was done with the aim of assessing genetic variation and structure in populations with a significant human impact directly on the target species (e.g. berry picking and other recreational activities). The majority of the Estonian populations were collected from nature reserves. The Lithuanian populations were collected from regional parks, nature reserves as well as managed forests. These Estonian and Lithuanian populations were not close to major population centres, and so presumably human impact on these populations was low, similar to the majority of sampled Latvian populations, with the exception of the previously mentioned Beberbeķu parks and Mežaparks. Due to vegetative propagation and ramet formation, and to limit the possibility of repeatedly sampling one clone, V. myrtillus and V. vitis-idaea leaves for DNA extraction were collected at 15 m intervals. Bog bilberries are not as common or uniformly distributed as bilberries and lingonberries, and therefore the minimum collection interval was decreased to 3 metres to collect the target number of samples, as in some locations bog bilberries were growing in a more irregular distribution compared to V. myrtillus and V. vitis-idaea. Leaves were collected from individuals, and stored at 4 °C prior to DNA extraction. DNA was extracted using a modified CTAB method (Doyle and Doyle 1990).
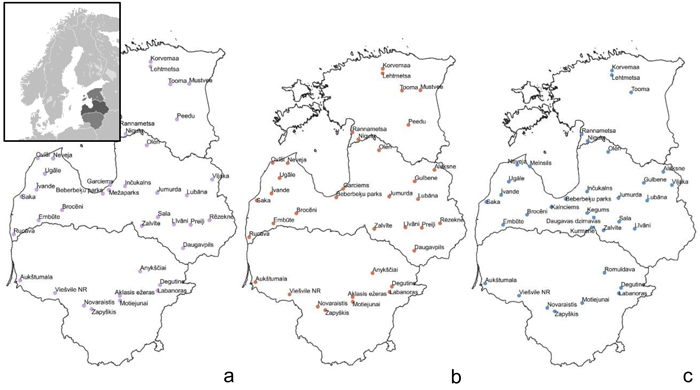
Fig. 1. Sample collection sites within the Baltic states – Estonia, Latvia, Lithuania (from top to bottom) to assess genetic diversity and structure of Vaccinium myrtillus (a), V. vitis-idaea (b) and V. uliginosum (c). View larger in new window/tab.
2.2 EST-SSR analyses
For each species, eight accessions from different populations were tested with 25 EST-SSR markers (Boches et al. 2005), and 8 markers were determined to be suitable for V. myrtillus analyses, 10 markers for lingonberries, and 8 markers for bog bilberries (Table 1). Criteria for selecting markers included amplification in the target species, lack of non-specific/additional fragments and polymorphism in the test panel.
| Table 1. EST-SSR markers used for Vaccinium species analysis. X – marker used in the respective species. | |||||
| Locus | Annealing temperature, °C | Allele size range (bp) | V. myrtillus | V. vitis-idaea | V. uliginosum |
| NA961 | 60 | 174–189 | x | x | |
| CA794F | 58–60 | 238–270 | x | x | |
| CA483F | 58 | 312–322 | x | ||
| CA112F | 58–60 | 170–200 | x | x | x |
| NA741 | 58–60 | 316–360 | x | x | x |
| CA236F | 60–62 | 227–247 | x | x | |
| CA421F | 58–60 | 164–212 | x | x | x |
| VCC_K4 | 60 | 199–265 | x | x | |
| VCC_J9 | 60 | 106–188 | x | x | |
| NA398 | 58 | 219–241 | x | ||
| NA1040 | 60 | 205–247 | x | ||
| CA344F | 60 | 124–184 | x | ||
| CA642F | 60 | 302–354 | x | ||
| VCC_I2 | 60 | 205–219 | x | x | |
PCR reactions for bilberries and bog bilberries were performed in a volume of 10 µl containing approximately 50 ng DNA, 1 µl HOT FIREPol® 10x Buffer B2 (Solis BioDyne), 2 mM MgCl2, 0.2 mM dNTP mix, 0.4 µM forward and reverse primers, 0.1 µl HOT FIREPol® DNA polymerase. PCR was carried out in a thermocycler (Eppendorf Mastercycler epgradient): initial denaturation at 95 °C for 15 min, followed by 30 cycles at 94 °C for 30 sec., annealing temperature of the primer pair (Table 1) for 45 sec., 1 min 72 °C and a final extension at 72 °C for 10 min. Forward primers were labelled with one of three fluorophores (6-FAM, HEX or TAMRA).
PCR reactions for lingonberries with primers NA 741, Na 398 un CA 421F were performed using 5x HOT FIRE Pol® MultiPlex Mix (Solis BioDyne) in a volume of 20 µl containing approximately 50 ng DNA, 4 µl HOT FIREPol® MultiPlex Mix (Solis BioDyne), 0.4 µM forward and reverse primers. PCR was carried out in a thermocycler (Eppendorf Mastercycler epgradient): initial denaturation at 95 °C for 15 min, followed by 25 cycles at 95 °C for 20 sec., annealing temperature 58 °C for 30 sec., 45 sec. 72 °C and a final extension at 72 °C for 10 min. For primer CA 794F reaction was the same as for bilberries and bog bilberries. For the other primers, reactions were the same as for bilberries and bog bilberries but with 25 cycles.
All PCR reaction products were diluted 1:10 with deionized water, and visualised on an Applied Biosystems ABI Prism 3100xl Genetic Analyser. Genotyping was performed using GeneMapper 4.0. (Applied Biosystems). As V. myrtillus and V. vitis-idaea are diploid species, nuclear microsatellite data were encoded as codominant. However, as V. uliginosum individuals could be diploid or tetraploid, microsatellite genotypes were converted to a binary data matrix for analysis, as allele dosage was not determined for tetraploid genotypes. Micro-Checker 2.2 (Van Oosterhout et al. 2004) was used to identify potential null alleles in the codominant data sets (V. myrtillus and V. vitis-idaea). GenAlEx 6.501 (Peakall and Smouse 2012) was used to calculate genetic diversity indices, unbiased pairwise Nei genetic distances and AMOVA and pairwise population differentiation (FST) (using 999 permutations). GenAlEx 6.501 was also used to analyse pairwise unbiased Nei genetic difference matrices by principal coordinates analysis (PCoA), and genetic and geographic distance matrices were compared by Mantel tests using 999 permutations. In addition, for the binary data (V. uliginosum), polymorphism information content (PIC) values were calculated as PIC = 1 – 2 (p2 – q2), where p = fragment frequency and q = no fragment frequency (Nei 1973). STRUCTURE 2.3.4 was used to determine clustering of the populations using a 50000 burnin period, followed by 100000 MCMC steps, K was determined for 1 to 20 with 15 runs for each value of K. The LOCPRIOR model was used, using the sampling location as default information to assist clustering, which is recommended for use with datasets with weak structure signal (Pritchard et al. 2000). The optimal value of K was determined using the ΔK method (Evanno et al. 2005) using STRUCTURE HARVESTER (Earl 2012). Coefficients of membership to the most likely K cluster number were visualized using Distruct via the CLUMPAK server (Kopelman et al. 2015).
2.3 Chloroplast SSR analyses
Six universal angiosperm primer pairs for chloroplast microsatellites – ccmp2, ccmp3, ccmp4, ccmp6, ccmp7, ccmp10 (Weising and Gardner 1999) were tested. In addition, six chloroplast microsatellite markers developed from V. macrocarpon (CP6, CP9, CP12, CP13, CP14 CP16), which were also reported to be transferable to other Vaccinium taxa and non-Vaccinium Ericaceae species (Schlautman et al. 2016), were tested in 16 accessions from different populations for each species. PCR reactions were performed using 5x HOT FIRE Pol® MultiPlex Mix (Solis BioDyne) in a volume of 20 µl containing approximately 50 ng DNA, 4 µl HOT FIREPol® MultiPlex Mix (Solis BioDyne), 0.4 µM forward and reverse primers. PCR was carried out in a thermocycler (Eppendorf Mastercycler epgradient): initial denaturation at 95 °C for 15 min, followed by 25 cycles at 94 °C for 1 min, annealing temperature 55 °C for 1 min, 1 min 72 °C and a final extension at 72 °C for 10 min. Initial testing showed that only the CP6 marker was informative in bilberries, the CP6 and ccmp7 markers were informative in lingonberries and the ccmp7 marker was informative in bog bilberries.
Due to the low diversity and maternal inheritance of the chloroplast markers, a subset of populations representing the entire geographic range of the sampled populations, and a random selection of between 4 to 16 (average 10.2) individuals within these populations were genotyped with the informative chloroplast markers for each species. 192 V. myrtillus accessions from 15 populations (four from Latvia, five from Estonia and six from Lithuania), 186 V. vitis-idaea accessions from 12 populations (six from Latvia, three from Estonia and three from Lithuania) were tested with marker CP6. 233 V. vitis-idaea accessions from 35 populations (19 from Latvia, seven from Estonia and nine from Lithuania) and 237 V. uliginosum accessions from 21 populations (eight from Latvia, five from Estonia and eight from Lithuania) were tested with marker ccmp7.
3 Results
3.1 Vaccinium myrtillus
The V. myrtillus samples were analysed with eight SSR makers (Table 1). A total of 775 individuals from 38 populations were genotyped. Potential null alleles (excess of homozygotes) were identified for locus NA961 in 24 of the 38 analysed populations (63%), and for locus NA741 in 6 populations (16%). Potential null alleles were also identified in most of the other markers (except for locus CA483F), however, these were found in only 1–3 populations and the excess of homozygotes could be due to population-specific processes.
The mean number of alleles over all loci detected by the nuclear microsatellite markers ranged from 2.88 to 4.75 per population (average 3.81). The mean effective number of alleles (Ne) ranged from 1.86 to 2.61 (average 2.16), mean Information index (I) ranged from 0.69 to 0.98 (average 0.83), mean unbiased expected heterozygosity (He) ranged from 0.40 to 0.52 (average 0.46) and mean observed heterozygosity (Ho) varied between 0.30 and 0.53 (average 0.40) (Table 2).
| Table 2. Genetic diversity parameters, obtained using EST-SSR markers in the analysed Vaccinium myrtillus populations. | |||||||||
| Population number | Population | Coordinates (N, E) | No. of indivi- duals | Average no. of alleles (SE) | Average no. of effective alleles (SE) | Average Information index (SE) | Average Unbiased Expected heterozy- gosity (SE) | Average Observed heterozy- gosity (SE) | No. of unique frag- ments |
| Latvia | |||||||||
| 1 | Zalvīte | 56.372, 25.208 | 24 | 4.00 (1.20) | 2.31 (0.43) | 0.89 (0.20) | 0.48 (0.08) | 0.36 (0.10) | 0 |
| 2 | Ugāle | 57.289, 22.047 | 24 | 4.50 (1.27) | 2.09 (0.29) | 0.83 (0.19) | 0.45 (0.09) | 0.39 (0.10) | 1 |
| 3 | Neveja | 57.564, 22.307 | 24 | 3.75 (1.08) | 2.04 (0.31) | 0.78 (0.20) | 0.42 (0.09) | 0.39 (0.10) | 0 |
| 4 | Rucava | 56.195, 21.107 | 24 | 3.88 (0.95) | 1.98 (0.27) | 0.76 (0.16) | 0.42 (0.09) | 0.32 (0.09) | 1 |
| 5 | Oleri | 57.802, 25.414 | 24 | 3.50 (0.87) | 2.10 (0.33) | 0.80 (0.18) | 0.45 (0.08) | 0.39 (0.10) | 0 |
| 6 | Lubāna | 56.892, 26.682 | 24 | 4.00 (1.18) | 2.06 (0.33) | 0.78 (0.18) | 0.43 (0.09) | 0.32 (0.09) | 0 |
| 7 | Jumurda | 56.955, 25.725 | 24 | 4.38 (1.25) | 2.13 (0.30) | 0.86 (0.19) | 0.46 (0.08) | 0.40 (0.09) | 0 |
| 8 | Sala | 56.524, 25.727 | 18 | 4.75 (1.26) | 2.61 (0.68) | 0.98 (0.22) | 0.50 (0.09) | 0.45 (0.11) | 2 |
| 9 | Garciems | 57.110, 24.193 | 24 | 3.50 (0.76) | 1.94 (0.26) | 0.76 (0.17) | 0.42 (0.09) | 0.30 (0.07) | 0 |
| 10 | Inčukalns | 57.084, 24.676 | 24 | 4.00 (1.20) | 2.38 (0.46) | 0.86 (0.23) | 0.47 (0.11) | 0.46 (0.11) | 0 |
| 11 | Preiļi | 56.368, 26.771 | 24 | 3.50 (0.57) | 1.93 (0.25) | 0.75 (0.14) | 0.42 (0.08) | 0.41 (0.10) | 0 |
| 12 | Līvāni | 56.386, 26.235 | 23 | 3.50 (0.80) | 1.95 (0.21) | 0.77 (0.13) | 0.45 (0.06) | 0.44 (0.08) | 0 |
| 13 | Rēzekne | 56.434, 27.378 | 24 | 3.13 (0.64) | 1.86 (0.21) | 0.69 (0.15) | 0.40 (0.09) | 0.35 (0.11) | 0 |
| 14 | Daugavpils | 55.956, 26.497 | 26 | 4.50 (1.27) | 2.20 (0.46) | 0.84 (0.22) | 0.43 (0.10) | 0.40 (0.10) | 1 |
| 15 | Embūte | 56.461, 21.887 | 24 | 3.75 (0.82) | 2.26 (0.26) | 0.91 (0.15) | 0.51 (0.07) | 0.42 (0.06) | 0 |
| 16 | Brocēni | 56.654, 22.638 | 24 | 4.38 (1.02) | 2.23 (0.35) | 0.89 (0.18) | 0.48 (0.08) | 0.40 (0.09) | 0 |
| 17 | Saka | 56.869, 21.304 | 24 | 4.63 (1.27) | 2.26 (0.34) | 0.93 (0.19) | 0.50 (0.08) | 0.49 (0.08) | 0 |
| 18 | Ovīši | 57.564, 21.797 | 24 | 4.00 (1.20) | 2.26 (0.41) | 0.83 (0.23) | 0.44 (0.11) | 0.44 (0.12) | 0 |
| 19 | Īvande | 57.004, 21.792 | 24 | 3.75 (0.65) | 2.16 (0.29) | 0.85 (0.15) | 0.47 (0.08) | 0.32 (0.10) | 0 |
| 20 | Viļaka | 57.155, 27.537 | 23 | 3.63 (0.53) | 2.08 (0.26) | 0.81 (0.15) | 0.46 (0.08) | 0.32 (0.10) | 0 |
| 21 | Beberbeķu parks | 56.952, 23.957 | 24 | 4.25 (0.75) | 2.28 (0.38) | 0.89 (0.18) | 0.48 (0.09) | 0.45 (0.10) | 0 |
| 22 | Mežaparks | 57.012, 24.157 | 24 | 4.25 (1.03) | 2.40 (0.40) | 0.91 (0.20) | 0.50 (0.09) | 0.40 (0.10) | 0 |
| Estonia | |||||||||
| 23 | Rannametsa | 58.134, 24.512 | 16 | 3.13 (0.44) | 2.37 (0.31) | 0.87 (0.15) | 0.52 (0.09) | 0.41 (0.08) | 0 |
| 24 | Lehtmetsa | 59.203, 25.600 | 16 | 3.63 (0.98) | 2.24 (0.37) | 0.85 (0.20) | 0.47 (0.09) | 0.37 (0.10) | 0 |
| 25 | Mustvee | 58.870, 26.919 | 16 | 3.50 (0.73) | 2.02 (0.30) | 0.77 (0.18) | 0.43 (0.10) | 0.32 (0.09) | 0 |
| 26 | Nigula | 58.007, 24.714 | 16 | 3.50 (0.76) | 1.91 (0.26) | 0.74 (0.15) | 0.42 (0.08) | 0.36 (0.09) | 0 |
| 27 | Korvemaa | 59.285, 25.611 | 16 | 4.25 (0.90) | 2.21 (0.40) | 0.85 (0.21) | 0.44 (0.10) | 0.34 (0.10) | 0 |
| 28 | Tooma | 58.876, 26.272 | 16 | 3.38 (0.84) | 1.91 (0.27) | 0.74 (0.17) | 0.41 (0.08) | 0.37 (0.10) | 0 |
| 29 | Peedu | 58.248, 26.453 | 17 | 3.38 (0.84) | 2.14 (0.36) | 0.77 (0.19) | 0.44 (0.10) | 0.35 (0.10) | 0 |
| Lithuania | |||||||||
| 30 | Motiejunai village | 55.051, 24.485 | 13 | 2.88 (0.55) | 1.97 (0.27) | 0.72 (0.17) | 0.43 (0.09) | 0.43 (0.12) | 0 |
| 31 | Anykščiai | 55.566, 25.126 | 16 | 3.88 (0.92) | 2.20 (0.26) | 0.87 (0.16) | 0.49 (0.09) | 0.36 (0.09) | 0 |
| 32 | Degutine forest | 55.315, 25.738 | 16 | 3.75 (0.86) | 2.30 (0.50) | 0.81 (0.22) | 0.43 (0.11) | 0.38 (0.10) | 0 |
| 33 | Aklasis ežeras | 55.135, 24.482 | 16 | 3.50 (0.87) | 2.06 (0.30) | 0.79 (0.19) | 0.44 (0.10) | 0.50 (0.12) | 0 |
| 34 | Zapyškis forest | 54.898, 23.613 | 16 | 3.88 (0.67) | 2.15 (0.30) | 0.87 (0.14) | 0.49 (0.07) | 0.53 (0.10) | 1 |
| 35 | Aukštumala bog | 55.380, 21.367 | 15 | 3.50 (0.54) | 2.05 (0.26) | 0.82 (0.14) | 0.47 (0.08) | 0.43 (0.10) | 2 |
| 36 | Novaraistis | 54.959, 23.373 | 16 | 3.50 (0.73) | 2.42 (0.40) | 0.91 (0.17) | 0.52 (0.08) | 0.52 (0.08) | 0 |
| 37 | Labanoras forest | 55.217, 25.662 | 16 | 3.75 (0.86) | 2.23 (0.39) | 0.82 (0.20) | 0.45 (0.11) | 0.44 (0.11) | 0 |
| 38 | Viešvile NR | 55.176, 22.468 | 16 | 3.75 (0.94) | 2.24 (0.34) | 0.85 (0.19) | 0.48 (0.09) | 0.43 (0.11) | 0 |
There was moderate population differentiation between the analysed V. myrtillus populations. AMOVA indicated that overall FST was 0.056 (p < 0.001). Pairwise population FST values ranged from 0.000 to 0.193 (Supplementary file S1). Principal coordinates analysis (PCoA) of pairwise unbiased Nei genetic distances did not identify any differentiated populations or groups (Fig. 2). There was some evidence for isolation by distance, with a Mantel analysis comparing genetic and geographic distance matrices indicated that there was a significant correlation between genetic and geographic distances (R = 0.277, p = 0.001). The number of private alleles, unique to one population, was low, with eight unique alleles found in six populations (Ugāle, Rucava, Sala, Daugavpils, Zapyškis forest, Aukštumala bog). Only two of these alleles had a frequency of over 0.05 – one in Sala and one in Aukštumala bog. Bayesian clustering analysis implemented in the STRUCTURE software did not identify any clusters or groups (Suppl. file S2). The Beberbeķu parks and Mežaparks populations, located close to the city of Rīga, were not differentiated, indicating that intense anthropogenic use did not impact genetic diversity or structure. The delta K method indicated that the most likely K = 2, with other peaks at K = 4 and K = 7. The maximum mean L(K) was at K = 4. However, the membership coefficient plots did not indicate the clustering or differentiation of groups or individual populations.
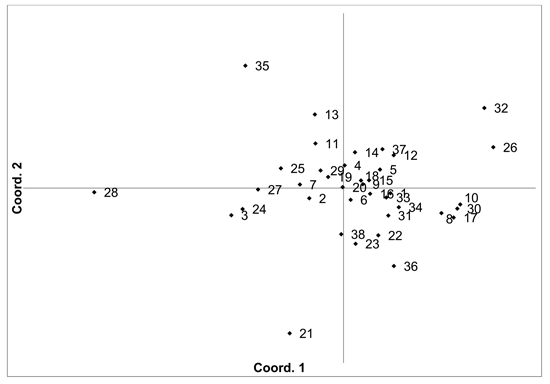
Fig. 2. Plot of Coordinate 1 vs. Coordinate 2 obtained by principal coordinates analysis (PCoA) based on pairwise unbiased Nei genetic distances between Vaccinium myrtillus populations. Population numbers as in Table 2. Variation explained by axis 1: 31.64%, axis 2: 22.82%.
Identical multilocus genotypes were found between individuals from 22 populations. In most cases, the individuals with matching genotypes were from the same population, indicating that they were probably ramets of the same clone. However, in some cases, identical multilocus genotypes were found between individuals from different populations, including geographically distant populations, which suggests that the utilised markers have fairly low informative value, and that distinct genotypes could not be differentiated with the utilised markers.
3.2 Vaccinium vitis-idaea
The V. vitis-idaea samples were analysed with 10 EST-SSR markers (Table 1). A total of 741 individuals from 36 populations were genotyped. Potential null alleles for loci CA112F, CA794F, VCC_J9, NA741, NA398, CA421F, NA961, CA236F, NA1040 and VCC_K4 were found in a large proportion of populations (ranging from 13 to 26), while for the remaining loci (NA741, NA398 and NA1040), potential null alleles were only identified in a few populations (ranging from 1 to 3).
The mean number of alleles over all loci detected by the nuclear microsatellite markers varied between 3.70 and 6.00 per population (average 4.88). The mean effective number of alleles (Ne) varied between 2.35 and 4.05 (average 3.20), mean Shannon’s information index (I) varied between 0.93 and 1.43 (average 1.23), mean unbiased expected heterozygosity (He) varied between 0.51 and 0.71 (average 0.65) and mean observed heterozygosity (Ho) ranged from 0.39 and 0.64 (average 0.53) (Table 3).
| Table 3. Genetic diversity parameters, obtained using EST-SSR markers in the analysed Vaccinum vitis-idaea populations. | |||||||||
| Popula- tion number | Population | Coordinates (N, E) | No. of indivi- duals | Average no. of alleles (SE) | Average no. of effective alles (SE) | Average Information index (SE) | Average Unbiased Expected heterozy-gosity (SE) | Average Observed heterozy- gosity (SE) | No. of unique frag- ments |
| Latvia | |||||||||
| 1 | Preiļi | 56.368, 26.771 | 26 | 5.00 (0.67) | 3.27 (0.35) | 1.27 (0.12) | 0.67 (0.04) | 0.518 (0.050) | 0 |
| 2 | Rēzekne | 56.434, 27.378 | 24 | 5.20 (0.73) | 3.09 (0.48) | 1.24 (0.14) | 0.64 (0.04) | 0.575 (0.082) | 0 |
| 3 | Līvāni | 56.386, 26.235 | 24 | 4.50 (0.52) | 2.74 (0.29) | 1.10 (0.11) | 0.61 (0.05) | 0.508 (0.093) | 0 |
| 4 | Daugavpils | 55.956, 26.497 | 26 | 3.70 (0.45) | 2.56 (0.35) | 0.97 (0.15) | 0.53 (0.08) | 0.446 (0.119) | 0 |
| 5 | Embūte | 56.461, 21.887 | 24 | 5.30 (0.65) | 3.59 (0.36) | 1.36 (0.11) | 0.71 (0.03) | 0.562 (0.074) | 0 |
| 6 | Brocēni | 56.654, 22.638 | 24 | 5.30 (0.76) | 3.45 (0.39) | 1.31 (0.14) | 0.68 (0.05) | 0.487 (0.087) | 0 |
| 7 | Saka | 56.869, 21.304 | 25 | 5.80 (1.04) | 3.72 (0.63) | 1.33 (0.17) | 0.68 (0.05) | 0.531 (0.076) | 0 |
| 8 | Īvande | 57.004, 21.792 | 24 | 3.90 (0.55) | 2.35 (0.27) | 0.93 (0.14) | 0.51 (0.07) | 0.421 (0.095) | 0 |
| 9 | Ovīši | 57.564, 21.797 | 24 | 4.70 (0.70) | 2.81 (0.29) | 1.14 (0.13) | 0.61 (0.05) | 0.491 (0.093) | 0 |
| 10 | Gulbene | 57.217, 26.594 | 24 | 4.30 (0.58) | 2.35 (0.21) | 0.97 (0.11) | 0.54 (0.06) | 0.638 (0.113) | 0 |
| 11 | Alūksne | 57.410, 27.275 | 24 | 5.20 (0.63) | 3.18 (0.27) | 1.27 (0.11) | 0.67 (0.04) | 0.531 (0.080) | 0 |
| 12 | Beberbeķu parks | 56.952, 23.957 | 24 | 5.80 (0.74) | 4.05 (0.55) | 1.43 (0.16) | 0.70 (0.06) | 0.571 (0.069) | 2 |
| 13 | Zalvīte | 56.372, 25.208 | 24 | 5.30 (0.75) | 3.53 (0.51) | 1.31 (0.14) | 0.68 (0.05) | 0.616 (0.078) | 0 |
| 14 | Neveja | 57.564, 22.307 | 24 | 5.10 (0.71) | 3.64 (0.48) | 1.34 (0.13) | 0.70 (0.04) | 0.631 (0.058) | 0 |
| 15 | Ugāle | 57.289, 22.047 | 24 | 6.00 (0.70) | 3.39 (0.52) | 1.31 (0.13) | 0.67 (0.04) | 0.516 (0.089) | 2 |
| 16 | Rucava | 56.195, 21.107 | 24 | 4.60 (0.60) | 3.15 (0.44) | 1.20 (0.14) | 0.64 (0.05) | 0.532 (0.080) | 2 |
| 17 | Garciems | 57.110, 24.193 | 24 | 4.30 (0.56) | 2.64 (0.28) | 1.09 (0.12) | 0.59 (0.05) | 0.461 (0.093) | 0 |
| 18 | Oleri | 57.802, 25.414 | 24 | 5.10 (0.80) | 3.28 (0.36) | 1.24 (0.15) | 0.65 (0.06) | 0.504 (0.078) | 0 |
| 19 | Lubāna | 56.892, 26.682 | 26 | 4.90 (0.74) | 3.11 (0.36) | 1.22 (0.12) | 0.65 (0.04) | 0.485 (0.068) | 1 |
| 20 | Jumurda | 56.955, 25.725 | 24 | 5.20 (0.57) | 3.22 (0.29) | 1.29 (0.10) | 0.68 (0.03) | 0.600 (0.050) | 0 |
| Estonia | |||||||||
| 21 | Nigula | 58.007, 24.714 | 15 | 4.10 (0.53) | 2.70 (0.25) | 1.11 (0.10) | 0.62 (0.04) | 0.534 (0.086) | 0 |
| 22 | Rannametsa | 58.134, 24.512 | 16 | 5.10 (0.81) | 3.59 (0.48) | 1.32 (0.15) | 0.70 (0.04) | 0.608 (0.097) | 0 |
| 23 | Mustvee | 58.870, 26.919 | 16 | 4.70 (0.68) | 3.47 (0.54) | 1.27 (0.14) | 0.68 (0.05) | 0.620 (0.086) | 0 |
| 24 | Korvemaa | 59.285, 25.611 | 16 | 4.80 (0.76) | 3.48 (0.53) | 1.26 (0.15) | 0.67 (0.05) | 0.527 (0.083) | 0 |
| 25 | Peedu | 58.248, 26.453 | 16 | 5.00 (0.83) | 3.34 (0.58) | 1.22 (0.18) | 0.63 (0.07) | 0.478 (0.106) | 1 |
| 26 | Lehtmetsa | 59.203, 25.600 | 16 | 5.00 (0.70) | 3.32 (0.44) | 1.26 (0.15) | 0.66 (0.06) | 0.390 (0.075) | 0 |
| 27 | Tooma | 58.876, 26.272 | 16 | 4.40 (0.54) | 2.91 (0.22) | 1.17 (0.09) | 0.66 (0.03) | 0.544 (0.083) | 0 |
| Lithuania | |||||||||
| 28 | Motiejunai village | 55.051, 24.485 | 16 | 4.60 (0.73) | 3.09 (0.41) | 1.17 (0.16) | 0.63 (0.06) | 0.622 (0.085) | 1 |
| 29 | Degutine forest | 55.315, 25.738 | 16 | 4.70 (0.65) | 3.44 (0.50) | 1.25 (0.15) | 0.66 (0.06) | 0.580 (0.090) | 0 |
| 30 | Anykščiai | 55.566, 25.126 | 16 | 5.70 (0.84) | 3.44 (0.40) | 1.34 (0.14) | 0.68 (0.05) | 0.478 (0.081) | 0 |
| 31 | Zapyškis forest | 54.898, 23.613 | 15 | 4.80 (0.65) | 3.19 (0.38) | 1.24 (0.13) | 0.66 (0.05) | 0.556 (0.078) | 0 |
| 32 | Aklasis ežeras | 55.135, 24.482 | 16 | 5.10 (0.67) | 3.30 (0.46) | 1.26 (0.14) | 0.66 (0.05) | 0.466 (0.102) | 2 |
| 33 | Novaraistis | 54.959, 23.373 | 16 | 4.40 (0.43) | 2.91 (0.24) | 1.18 (0.09) | 0.66 (0.04) | 0.557 (0.071) | 1 |
| 34 | Labanoras forest | 55.217, 25.662 | 16 | 4.80 (0.53) | 3.21 (0.41) | 1.24 (0.12) | 0.66 (0.05) | 0.506 (0.086) | 0 |
| 35 | Viešvile NR | 55.176, 22.468 | 16 | 4.80 (0.59) | 3.47 (0.33) | 1.32 (0.11) | 0.71 (0.03) | 0.600 (0.084) | 1 |
| 36 | Aukštumala bog | 55.380, 21.367 | 16 | 4.60 (0.43) | 3.31 (0.38) | 1.25 (0.12) | 0.67 (0.05) | 0.479 (0.087) | 0 |
There was higher overall population differentiation between the analysed V. vitis-idaea populations compared to the V. myrtillus populations. AMOVA indicated that overall FST was 0.096 (p < 0.001). Pairwise population FST values ranged from 0.020 to 0.171 (Suppl. file S1). However, three populations were more differentiated compared to the others, with the Daugavpils, Gulbene and Īvande populations having high pairwise FST values compared to the other populations (average pairwise FST values were 0.098, 0.118 and 0.116, respectively). The differentiation of these three populations was also indicated by PCoA of pairwise unbiased Nei genetic distances (Fig. 3). As a result, Mantel analysis did not determine a significant correlation between population pairwise genetic and geographic distance matrices (R = 0.077, p = 0.126). Thirteen private alleles, unique to one population, were found in nine populations (Ugāle, Rucava, Lubāna, Beberbeķu parks, Aklasis ežeras, Novaraistis, Viešvile NR, Peedu, Motiejunai village). Four of these alleles had a frequency of over 0.05 – one in each of the populations Rucava, Novaraistis, Peedu and Motiejunai village. Bayesian clustering analysis implemented in the STRUCTURE software did not provide support for higher order clusters or groups (Suppl. file S3). The delta K method indicated that the most likely K = 2, with other peaks at K = 8 and K = 17. The maximum mean L(K) was at K = 17. The membership coefficient plots did show the differentiation of the Gulbene, Īvande and Daugavpils populations, as previously indicated by the FST values and PCoA plots, but no clustering or differentiation of groups of populations was observed. The Beberbeķu parks population, close to a densely populated city (Rīga) was not differentiated from the majority of the other analysed populations. Identical multilocus genotypes were found in all populations, with the number of individuals having identical multilocus genotypes ranging from two to seven. All identical genotypes were found between individuals from one population, indicating that these are probably ramets of one clone.
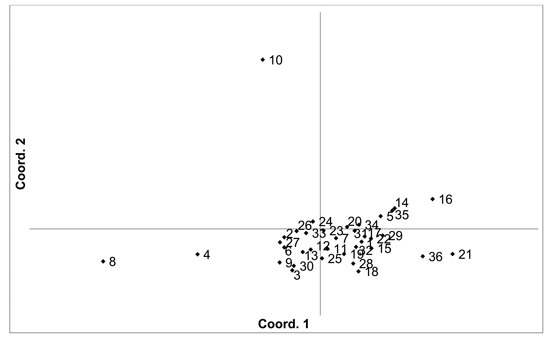
Fig. 3. Plot of Coordinate 1 vs. Coordinate 2 obtained by principal coordinates analysis (PCoA) based on of pairwise unbiased Nei genetic distances between Vaccinum vitis-idaea populations. Population numbers as in Table 3. Variation explained by axis 1: 23.89%, axis 2: 20.34%.
Potential null alleles were identified in both V. myrtillus and V. vitis-idaea populations. The presence of null alleles is common for SSR loci, particularly when they are analysed in non-focal species, as in this study. However, the presence of null alleles is predicted to increase FST and genetic distance (Chapuis and Estoup 2007). As the genetic differentiation between the analysed populations of both these species was in general low, and given the small number of suitable markers identified for use in each species, all loci were retained for analyses.
During sample collection for this study, no putative hybrids were identified by morphological features, however, a detailed morphological examination of collected samples was not undertaken. The chloroplast marker CP6 was used to genotype both V. myrtillus and V. vitis-idaea samples, but no common chloroplast alleles between these two species were found. Six nuclear SSR markers were also genotyped in both species (NA961, CA112F, NA741, CA236F, CA421F, VCC_K4). If gene (pollen) flow was unidirectional from V. vitis-idaea to V. myrtillus, and if hybrids are morphologically similar to V. myrtillus, then common alleles with a higher frequency in V. vitis-idaea and a low frequency in V. myrtillus might indicate potential hybridisation between these species. Only 16 alleles over all six common loci were shared between V. myrtillus and V. vitis-idaea. Seven had a frequency of over 0.05 in V. vitis-idaea and under 0.05 in V. myrtillus, two alleles had the opposite pattern (f > 0.05 in V. myrtillus, f < 0.05 in V. vitis-idaea), while four alleles had a frequency of over 0.05 in both species, and three alleles had a frequency of under 0.05 in both species. The alleles with f > 0.05 in V. vitis-idaea and f < 0.05 in V. myrtillus were found in 30 of the 38 analysed populations, and no individuals had the alleles shared between species present at all loci, as could be expected for first generation hybrids. These results suggest that no first generation hybrids between V. myrtillus and V. vitis-idaea were collected in this study, even though both species were growing sympatrically in most of the sampled populations, and the two species were clearly differentiated by both the EST-SSR and the chloroplast markers.
3.3 Vaccinium uliginosum
The V. uliginosum samples were genotyped with eight SSR markers (Table 1), and the number of alleles indicated that at least some of the individuals were tetraploid (i.e. more than two alleles were observed at one locus). Therefore, the SSR loci used for analysing V. uliginosum samples were scored as dominant binary markers. The presence/absence of a total of 159 fragments were scored for a total of 806 individuals from 35 populations. The number of fragments identified in each population ranged from 65 to 124 (average 90.66). Mean PIC values in each population ranged from 0.122 to 0.171 (average 0.154). Mean unbiased expected heterozygosity (He) in each population ranged from 0.092 to 0.120 (average 0.111) (Table 4). PCoA of pairwise unbiased Nei genetic distances indicated that the Alūksne and Motiejunai village populations were differentiated from each other as well as from the other populations (Fig. 4). Mantel analysis comparing genetic and geographic distance matrices indicated that there was a small but significant correlation between genetic and geographic distances (R = 0.067, p = 0.001).
| Table 4. Genetic diversity parameters obtained using EST-SSR markers in the analysed Vaccinum uliginosum populations. | ||||||||
| Population number | Population | Coordinates (N, E) | No. of individuals | Total no. of fragments | No. of polymorphic fragments | Average Unbiased Expected heterozygosity (SE) | Average PIC (SE) | No. of unique fragments |
| Latvia | ||||||||
| 1 | Sala | 56.524, 25.727 | 24 | 110 | 109 | 0.117 (0.011) | 0.247 (0.016) | 0 |
| 2 | Zalvīte | 56.372, 25.208 | 26 | 96 | 95 | 0.116 (0.012) | 0.264 (0.018) | 0 |
| 3 | Kurmene | 56.427, 24.817 | 24 | 100 | 99 | 0.111 (0.011) | 0.246 (0.016) | 0 |
| 4 | Inčukalns | 57.084, 24.676 | 42 | 108 | 107 | 0.115 (0.011) | 0.246 (0.017) | 0 |
| 5 | Līvāni | 56.415, 26.282 | 48 | 124 | 124 | 0.12 (0.011) | 0.219 (0.015) | 0 |
| 6 | Saka | 56.869, 21.302 | 20 | 93 | 93 | 0.116 (0.011) | 0.275 (0.018) | 0 |
| 7 | Embūte | 56.461, 21.887 | 21 | 86 | 85 | 0.106 (0.011) | 0.275 (0.019) | 0 |
| 8 | Īvande | 57.005, 21.795 | 24 | 89 | 88 | 0.115 (0.012) | 0.287 (0.019) | 0 |
| 9 | Melnsils | 57.540, 22.740 | 22 | 90 | 89 | 0.108 (0.011) | 0.269 (0.019) | 0 |
| 10 | Viļaka | 57.155, 27.537 | 22 | 97 | 97 | 0.117 (0.011) | 0.275 (0.018) | 1 |
| 11 | Alūksne | 57.404, 27.269 | 23 | 69 | 68 | 0.104 (0.013) | 0.293 (0.022) | 0 |
| 12 | Gulbene | 57.217, 26.594 | 24 | 91 | 90 | 0.109 (0.011) | 0.266 (0.019) | 0 |
| 13 | Ugāle | 57.250, 22.033 | 23 | 99 | 98 | 0.107 (0.011) | 0.249 (0.017) | 1 |
| 14 | Brocēni | 56.656, 22.675 | 22 | 100 | 100 | 0.118 (0.012) | 0.256 (0.017) | 2 |
| 15 | Kalnciems | 56.803, 23.478 | 24 | 94 | 93 | 0.108 (0.011) | 0.257 (0.018) | 0 |
| 16 | Ķegums | 56.691, 24.669 | 24 | 87 | 87 | 0.109 (0.012) | 0.268 (0.018) | 0 |
| 17 | Beberbeķu parks | 56.952, 23.957 | 24 | 91 | 90 | 0.105 (0.011) | 0.264 (0.018) | 0 |
| 18 | Daugavas dzirnavas | 56.609, 24.891 | 14 | 78 | 77 | 0.112 (0.012) | 0.308 (0.021) | 0 |
| 19 | Neveja | 57.564, 22.307 | 56 | 114 | 113 | 0.11 (0.011) | 0.228 (0.016) | 0 |
| 20 | Oleri | 57.797, 25.473 | 46 | 106 | 105 | 0.11 (0.011) | 0.234 (0.017) | 0 |
| 21 | Jumurda | 56.975, 25.723 | 26 | 95 | 94 | 0.106 (0.011) | 0.258 (0.018) | 1 |
| 22 | Lubāna | 56.900, 26.762 | 41 | 107 | 106 | 0.114 (0.011) | 0.244 (0.017) | 0 |
| Estonia | ||||||||
| 23 | Korvemaa | 59.285, 25.611 | 16 | 86 | 85 | 0.115 (0.012) | 0.291 (0.019) | 0 |
| 24 | Tooma | 58.876, 26.272 | 15 | 96 | 95 | 0.116 (0.011) | 0.281 (0.018) | 1 |
| 25 | Lehtmetsa | 59.203, 25.600 | 15 | 79 | 78 | 0.115 (0.012) | 0.310 (0.021) | 0 |
| 26 | Nigula | 58.007, 24.714 | 16 | 93 | 92 | 0.115 (0.011) | 0.279 (0.018) | 1 |
| 27 | Rannametsa | 58.134, 24.512 | 13 | 77 | 76 | 0.108 (0.012) | 0.306 (0.021) | 0 |
| Lithuania | ||||||||
| 28 | Motiejunai | 55.051, 24.485 | 11 | 65 | 63 | 0.102 (0.013) | 0.316 (0.022) | 1 |
| 29 | Degutine forest | 55.315, 25.738 | 15 | 90 | 89 | 0.112 (0.011) | 0.273 (0.018) | 0 |
| 30 | Zapyškis forest | 54.898, 23.613 | 10 | 73 | 72 | 0.115 (0.013) | 0.320 (0.021) | 0 |
| 31 | Romuldava forest | 55.598, 25.213 | 15 | 83 | 82 | 0.112 (0.012) | 0.282 (0.019) | 1 |
| 32 | Labanoras forest | 55.217, 25.662 | 14 | 75 | 74 | 0.109 (0.012) | 0.304 (0.021) | 0 |
| 33 | Novaraistis | 54.959, 23.373 | 16 | 66 | 65 | 0.092 (0.011) | 0.294 (0.021) | 0 |
| 34 | Viešvile NR | 55.176, 22.468 | 14 | 79 | 78 | 0.117 (0.013) | 0.305 (0.021) | 0 |
| 35 | Aukštumala bog | 55.380, 21.367 | 16 | 87 | 86 | 0.113 (0.011) | 0.286 (0.018) | 1 |
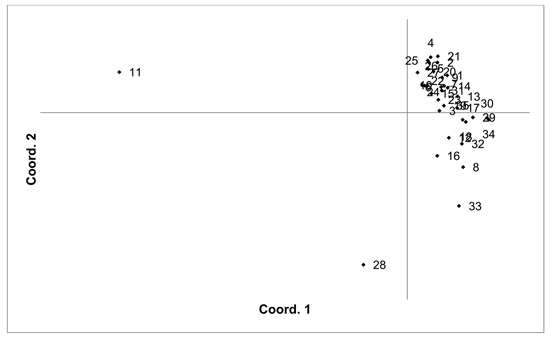
Fig. 4. Plot of Coordinate 1 vs. Coordinate 2 obtained by principal coordinates analysis (PCoA) based on pairwise unbiased Nei genetic distances between Vaccinum uliginosum populations. Population numbers as in Table 4. Variation explained by axis 1: 48.48%, axis 2: 14.20%.
Unique fragments were found in the Tooma, Nigula, Motiejunai village, Romuldava forest, Aukštumala bog, Viļaka, Ugāle, Jumurda populations (one in each) and the Brocēni population (two unique fragments). Principal coordinates analysis (PCoA) of population pairwise Nei genetic distances indicated that the populations were not differentiated, with the exception of Motiejunai village and in particular Alūksne, which were separated from the other populations. Bayesian clustering analysis implemented in the STRUCTURE software did not provide support for higher order clusters or groups (Suppl. file S4). The delta K method indicated that the most likely K = 2, and relatively higher delta K values for K = 3 and K = 17. The maximum mean L(K) was at K = 17. The membership coefficient plots did show the differentiation of the Alūksne population, as previously indicated by the PCoA plot of unbiased Nei genetic distances, but no other clustering or differentiation of groups of populations was observed. Similarly to results from the other species, the Beberbeķu parks population, located close to a densely populated city (Rīga), was not differentiated from the majority of the other analysed populations. A number of identical multilocus genotypes were found, 24 pairs of individuals, one group of three, and one group of four individuals. All the individuals with matching multilocus genotype were from the same population, suggesting that they are probably ramets of one clone.
3.4 Chloroplast diversity studies
Of the 12 chloroplast markers tested in the three species, all were monomorphic except for CP6 for V. myrtillus and V. vitis-idaea, and ccmp7 for V. vitis-idaea and V. uliginosum. The marker CP6 amplified two alleles in V. myrtillus and V. vitis-idaea, and marker ccmp7 detected three and four alleles in V. uliginosum and V. vitis-idaea respectively (Table 5).
| Table 5. Distribution (%) of chloroplast markers CP6 and ccmp7 alleles in Latvia, Estonia and Lithuania (%) in Vaccinium species | ||||||||||||
| V. myrtillus | V. vitis-idaea | V. uliginosum | ||||||||||
| marker | allele | Latvia | Estonia | Lithuania | allele | Latvia | Estonia | Lithuania | allele | Latvia | Estonia | Lithuania |
| n | 64 | 64 | 64 | 94 | 47 | 45 | ||||||
| CP6 | 153 | 29.7 | 0 | 7.8 | 158 | 38.3 | 29.8 | 24.4 | ||||
| 154 | 70.3 | 100 | 92.2 | 159 | 61.7 | 70.2 | 75.6 | |||||
| n | 169 | 28 | 36 | 103 | 52 | 82 | ||||||
| ccmp7 | 116 | 0.6 | 121 | 79.6 | 73.1 | 83.1 | ||||||
| 117 | 89.3 | 82.1 | 86.1 | 122 | 3.2 | |||||||
| 120 | 9.5 | 17.9 | 13.9 | 123 | 20.4 | 26.9 | 13.7 | |||||
| 121 | 0.6 | |||||||||||
For marker CP6, only the 154 bp allele was amplified in Estonian V. myrtillus populations. This allele was also predominant in Latvia and Lithuania, but the 153 bp allele was present in 29.7% of Latvian accessions and 7.8% of Lithuanian accessions. In V. vitis-idaea the 159 bp allele dominated, but the 158 bp allele was found in approximately one third of all accessions, with a higher frequency in Latvian accessions compared to Lithuanian or Estonian accessions. Four alleles were identified with marker ccmp7 in Latvian accessions. The 116 bp and 121 bp alleles were each found in only one Latvian accession, which were from different populations (Brocēni and Saka). The 117 bp allele dominated in all accessions. In V. uliginosum, the 122 bp allele was amplified in three accessions from one Lithuanian population (Aukštumala bog). This allele was not found in Latvian and Estonian accessions. The 121 bp allele dominated in Lithuanian accessions, and the frequency decreases in Latvian and Estonian accessions.
The identified chloroplast marker alleles were evenly distributed between the populations, the proportion within populations was similar to the overall proportion found in all accessions. This is consistent with the results obtained with the nuclear microsatellite markers, which did not identify any genetically differentiated populations. The even distribution of chloroplast haplotypes suggests that all analysed populations had a similar origin. As previously mentioned, no evidence of hybridisation between V. myrtillus and V. vitis-idaea was identified, as no chloroplast alleles were shared between these two species.
4 Discussion
V. myrtillus, V. uliginosum and V. vitis-idaea are widely distributed within Latvia, Lithuania and Estonia. In general, there was moderate population differentiation, but no higher clustering of populations was observed, and no genetic differentiation between countries was observed. While the delta K method identified K = 2 as the most likely for each of the three species, examination of the membership coefficient plots for K = 2 and higher values of K did not identify convincing population structuring in addition to the differentiated populations identified by other approaches (i.e. pairwise FST and genetic distances). The minimum group number able to be identified by the delta K method is K = 2, and this value has been overrepresented in studies relying on this method (Janes et al. 2017). Taking into account the various population structure analysis approaches utilised in this study, there was no evidence for larger population groupings. There were significant correlations between genetic and geographic distances for V. myrtillus and V. uliginosum. Three V. vitis-idaea populations (Gulbene, Īvande, Daugavpils) were more highly genetically differentiated from the other populations, and reanalysing the data without these three populations indicated that there was a small but significant correlation between genetic and geographic distance for this species as well (data not shown). These results suggest that isolation by distance is the main factor influencing Vaccinium population structure in the Baltic States, and that there are no other dispersal barriers for these species within the region. Some studies from other European regions have reported similar results (Debnath 2007; Zoratti et al. 2015), while others reported population fragmentation (Bjedov et al. 2015)
The populations analysed in this study were collected from forest stands under different management regimes. The majority of Latvian populations were collected in pine stands of various ages actively managed by Latvia’s State Forests, while the Estonian and Lithuanian populations were collected from nature reserves and other protected areas. Two populations in Latvia (Mežaparks and Beberbeķu parks) were collected from parks within or adjacent to the capital Riga, and are intensively utilised by the general public for leisure activities, including berry picking. However, these populations were not differentiated from the other populations, and did not show increased or decreased genetic diversity as a result of human recreational impact. In addition, the low differentiation and similar genetic diversity of the managed forest stands indicates that harvesting and other forest management activities do not have a long term impact on the populations of these species located in particular forest districts or areas.
The proportion of rare alleles and alleles unique to one population was low. However, it has been suggested that not only rare alleles should be protected, but that common alleles are also important (Witlock et al. 2016). Matching multilocus genotypes were found in all three species. In V. vitis-idaea and V. uliginosum, these matches were within populations, suggesting that clones in these species can be more extensive than the 15 m sampling strategy used in this study. However, a finer-scale sampling strategy should be implemented to investigate the extent of clones in these species. Persson and Gustavsson (2001) reported that V. vitis-idaea clones can extend up to 30 m. In V. myrtillus, however, matching multilocus genotypes were not only found within populations, but were also identified in individuals from different populations. This indicates that the markers utilised for genotyping of V. myrtillus were not sufficiently polymorphic and informative to differentiate genetically distinct individuals. This could also have the effect of underestimating the genetic diversity and differentiation of populations. However, the obtained results for V. myrtillus was similar to the other two species. Further efforts are required to develop and transfer additional DNA markers for use in V. myrtillus in order to ensure accurate genetic analyses for this species and assist in the identification of more differentiated populations. No evidence for recent hybridisation between V. myrtillus and V. vitis-idaea was found in this study, with clear differentiation between these species at both nuclear and chloroplast loci. A more targeted study, utilising additional chloroplast and nuclear loci or sequences is required to determine the hybridisation frequency and direction between V. myrtillus and V. vitis-idaea growing in natural populations.
Some populations that were differentiated from the other populations were identified – in particular the Daugavpils, Gulbene and Īvande V. vitis-idaea populations, and the Motiejunai and Alūksne V. uliginosum populations. The factors influencing the higher differentiation of these populations was not determined in this study, and their intra-population genetic diversity was similar to the other populations. However, this information can be useful for the development of in situ conservation strategies for these species. The average number of individuals sampled in Latvian populations was 25.5 and 15.4 in the Estonian and Lithuanian populations. The number of individuals sampled per population was constrained by the sampling strategy, the size of the stands, and the occurrence of each species. The presence of identical multilocus genotypes in some populations indicates that ramets of one clone were collected, which would further decrease the effective number of individuals sampled. Increasing the number of samples can increase the sensitivity, particularly when population differentiation is low, but simulation studies indicate that if FST values are greater than 0.05, sampling fewer than 20 individuals per population is sufficient (Kalinowski 2005). Increasing the number of sampled per population may provide finer discrimination of the populations with low differentiation (i.e. FST less than 0.05), but this low level of differentiation may not be biologically relevant (Björklund and Bergek 2009), particularly for the development of in situ conservation strategies.
Development of effective in situ conservation strategies requires comprehensive information about the target species, including genetic variation (Haig 1998). Natural populations are influenced by abiotic and biotic factors and are increasingly influenced by climate change and anthropogenic aspects. The Convention on Biological Diversity (CBD) (1992) includes guidelines for the establishment and maintenance of in situ conservation measures (Article 8) including recommendations to identify conservation units in areas with diverse land use (not only in protected areas), as well as complementation of in situ and ex situ conservation. A central component in the concept for the development of in situ conservation in Europe is the identification of Most Appropriate Wild Populations (MAWP) (Maxted et al. 2015). Knowledge about the distribution of genetic diversity within larger national or regional areas is important for suitable selection of MAWP for species or regions.
Our results indicate that wild Vaccinium species populations in the Baltic States are moderately genetically differentiated but without higher order structuring, and that genetic diversity of populations growing in protected areas, managed forests and intensively utilised public recreational areas are similar. Therefore, when establishing genetic reserves for these species for in situ conservation, the selection of populations should not focus only on protected areas but also on rare genotypes (varieties) growing in managed forests as well as more differentiated populations, irrespective of the management regime implemented in the forests where they are located. Sgrò et al. (2011) concluded that protected areas with fixed boundaries are not appropriate in all situations with regard to responses in plant adaptation to climate change and genetic reserves need to be interconnected. Many CWR populations can be located outside protected areas (Maxted et al. 2015), therefore MAWP may occur within or outside protected areas. In Lithuanian genetic reserves, not only are the prioritized species V. myrtillus and V. vitis-idaea protected, but also rare forms – V. myrtillus var. leucocarpum Koch. and V. vitis-idaea var. leucocarpum Asch. et Magnus (Labokas and Karpavičiene 2018). Our preliminary results identified only one clone of V. myrtillus var. leucocarpum in each population where these forms were found in Latvia (Gailite et al. 2020). Future investigations is needed to draw more precise estimates of the distribution of these rare genotypes, and to identify the most appropriate conservation strategies (e.g. in situ vs ex situ). The results of this study provide information for the development of in situ conservation strategies for these species, and, in conjunction with consideration of other (non-genetic) factors, assist in the identification of management units. In addition, the utilised genetic analysis methods will enable characterization and continued monitoring of conservation populations.
Data availability: Genotype data has been deposited in the Dryad data repository: https://doi.org/10.5061/dryad.zgmsbcc8x.
Acknowledgments
This research was funded by European Regional Development Fund Postdoctoral research aid Nr.1.1.1.2/VIAA/1/16/123 “Investigation of Vaccinium genetic resources in Latvia”.
We thank Külli Annamaa from the Estonian Crop Research Institute Plant Gene Bank and Bronislovas Gelvonauskis, Raimondas Baltrenas, Laima Šveistyté from the Plant Gene Bank of Lithuania for assistance in plant material collection in Estonia and Lithuania.
We thank our colleagues Zane Lībiete, Jānis Donis and Guntars Šņepsts for their help in selecting collection sites and Māris Laiviņš for assistance in plant material collection in two sites.
We also thank our colleagues Anna Korica, Krišs Bitenieks, Viktorija Beļēviča un Baiba Krivmane for technical assistance with DNA extraction.
References
Albert T., Raspe O., Jacquemart A.L. (2003). Clonal structure in Vaccinium myrtillus L. revealed by RAPD and AFLP markers. International Journal of Plant Sciences 164(4): 649–655. https://doi.org/10.1086/375373.
Alsos I.G., Engelskjøn T., Brochmann C. (2002). Conservation genetics and population history of Betula nana, Vaccinium uliginosum, and Campanula rotundifolia in the Arctic archipelago of Svalbard. Arctic, Antarctic, and Alpine Research 34(4): 408–418. https://doi.org/10.1080/15230430.2002.12003511.
Bjedov I., Obratov–Petković D., Mišić D., Šiler B., Aleksić J.M. (2015). Genetic patterns in range-edge populations of Vaccinium species from the central Balkans: implications on conservation prospects and sustainable usage. Silva Fennica 49(4) article 1283. https://doi.org/10.14214/sf.1283.
Björklund M., Bergek S. (2009). On the relationship between population differentiation and sampling effort: is more always better? Oikos 118(8): 1127–1129. https://doi.org/10.1111/j.1600-0706.2009.17555.x.
Boches P.S., Bassil N.V., Rowland L.J. (2005). Microsatellite markers for Vaccinium from EST and genomic libraries. Molecular Ecology Notes 5(3): 657–660. https://doi.org/10.1111/j.1471-8286.2005.01025.x.
Celka Z., Szkudlarz P. (2006). The condition and resources of Vaccinium uliginosum (Ericaceae) in an isolated population on the peat bog “Bagna” near Chlebowo (Wielkopolska). Dendrobiology 56: 13–18.
Chapuis M.P., Estoup A. (2007). Microsatellite null alleles and estimation of population differentiation. Molecular Biology and Evolution 24(3): 621–631. https://doi.org/10.1093/molbev/msl191.
Convention on Biological Diversity (1992). United Nations. 28 p. https://www.cbd.int/convention/text/.
Debnath S.C. (2007). Inter simple sequence repeat (ISSR) to assess genetic diversity within a collection of wild lingonberry (Vaccinium vitis-idaea L.) clones. Canadian Journal of Plant Science 87(2): 337–344. https://doi.org/10.4141/P06-059.
Doyle J., Doyle J.L. (1990). Isolation of plant DNA from fresh tissue. Focus 12: 13–15.
Earl D.A. (2012). STRUCTURE HARVESTER: a website and program for visualizing STRUCTURE output and implementing the Evanno method. Conservation Genetics Resources 4(2): 359–361. https://doi.org/10.1007/s12686-011-9548-7.
Eidesen P.B., Alsos I.G., Popp M., Stensrud Ø., Suda J., Brochmann C. (2007). Nuclear vs. plastid data: complex Pleistocene history of la circumpolar key species. Molecular Ecology 16(18): 3902–3925. https://doi.org/10.1111/j.1365-294X.2007.03425.x.
Evanno G., Regnaut S., Goudet J. (2005). Detecting the number of clusters of individuals using the software STRUCTURE: a simulation study. Molecular Ecology 14(8): 2611–2620. https://doi.org/10.1111/j.1365-294X.2005.02553.x.
Gailite A., Ruņģis D.E. (2020). Study of genetic diversity of species from the genus Vaccinium. Abstract of the 78th Scientific Conference of the University of Latvia. Environmental and Experimental Biology 18: 33–34. https://doi.org/10.22364/eeb.18.05.
Haig S.M. (1998). Molecular contributions to conservation. Ecology 79(2): 413–425. https://doi.org/10.1890/0012-9658(1998)079[0413:MCTC]2.0.CO;2.
Jacquemart A.L. (1996). Vaccinium uliginosum L. Journal of Ecology 84(5): 771–785. https://doi.org/10.2307/2261339.
Janes J.K., Miller J.M., Dupuis J.R., Malenfant R.M., Gorrell J.C., Cullingham C.I., Andrew R.L. (2017). The K= 2 conundrum. Molecular Ecology 26(14): 3594–3602. https://doi.org/10.1111/mec.14187.
Kalinowski S.T. (2005). Do polymorphic loci require large sample sizes to estimate genetic distances? Heredity 94(1): 33–36. https://doi.org/10.1038/sj.hdy.6800548.
Kopelman N.M., Mayzel J., Jakobsson M., Rosenberg N.A., Mayrose I. (2015). CLUMPAK: a program for identifying clustering modes and packaging population structure inferences across K. Molecular Ecology Resources 15(5): 1179–1191. https://doi.org/10.1111/1755-0998.12387.
Labokas J., Karpavičienė B. (2018). Creation of a network of seed sites for in-situ conservation of medicinal and aromatic plant genetic resources in Lithuania. Botanica 24(1): 87–97. https://doi.org/10.2478/botlit-2018-0008.
Lätti A.K., Riihinen K.R., Jaakola L. (2011). Phenolic compounds in berries and flowers of a natural hybrid between bilberry and lingonberry (Vaccinium x intermedium Ruthe). Phytochemistry 72(8): 810–815. https://doi.org/10.1016/j.phytochem.2011.02.015.
Maxted N., Kell S., Toledo A., Dulloo E., Heywood V., Hodgkin T., Hunter D., Guarino L., Jarvis A., Ford-Lloyd B. (2010). A global approach to crop wild relative conservation: securing the gene pool for food and agriculture. Kew Bulletin 65: 561–576. https://doi.org/10.1007/s12225-011-9253-4.
Maxted N., Avagyan A., Frese L., Iriondo J.M., Magos Brehm J., Singer A., Kell S.P. (2015). ECPGR concept for in situ conservation of crop wild relatives in Europe. Wild species conservation in genetic reserves working group, European Cooperative Programme for Plant Genetic Resources, Rome, Italy. 28 p.
Nei M. (1973). Analysis of gene diversity in subdivided populations. Proceedings of the National Academy of Sciences 70(12): 3321–3323. https://doi.org/10.1073/pnas.70.12.3321.
Nestby R., Percival D., Martinussen I., Opstad N., Rohloff J. (2011). The European blueberry (Vaccinium myrtillus L.) and the potential for cultivation. A review. The European Journal of Plant Science and Biotechnology 5: 5–16.
Nestby R., Hykkerud A.L., Martinussen I. (2019). Review of botanical characterization, growth preferences, climatic adaptation and human health effects of Ericaceae and Empetraceae wild dwarf shrub berries in boreal, alpine and arctic areas. Journal of Berry Research 9(3): 515–547. https://doi.org/10.3233/JBR-190390.
Peakall R., Smouse P.E. (2012). GenAlEx 6.5: genetic analysis in Excel. Population genetic software for teaching and research – an update. Bioinformatics 28(19): 2537–2539. https://doi.org/10.1093/bioinformatics/bts460.
Persson H.A., Gustavsson B.A. (2001). The extent of clonality and genetic diversity in lingonberry (Vaccinium vitis-idaea L.) revealed by RAPDs and leaf-shape analysis. Molecular Ecology 10(6): 1385–1397. https://doi.org/10.1046/j.1365-294X.2001.01280.x.
Phillips J., Asdal Ǻ., Magos Brehm J., Rasmussen M., Maxted N. (2016). In situ and ex situ diversity analysis of priority crop wild relatives in Norway. Diversity and Distributions 22(11): 1112–1126. https://doi.org/10.1111/ddi.12470.
Ponikierska A., Gugnacka-Fiedor W., Piwczyński M. (2004). Morphological characteristics of Vaccinium × intermedium Ruthe. Dendrobiology 51: 59–65.
Priedītis N. (2014). Latvijas augi. Enciklopēdija. [Plants of Latvia. Encyclopedia]. Gandrs. Rīga. 892 p.
Pritchard J.K., Stephens M., Donnelly P. (2000). Inference of population structure using multilocus genotype data. Genetics155: 945–959.
Regele D., Grünebach M., Erschbamer B., Schönswetter P. (2017). Do ploidy level, morphology, habitat and genetic relationships in Alpine Vaccinium uliginosum allow for the discrimination of two entities? Preslia 89: 291–308. https://doi.org/10.23855/preslia.2017.291.
Ripa A., Audriņa B. (2009). Rabbiteye blueberry, American cranberry and lingonberry breeding in Latvia. Latvian Journal of Agronomy 12: 93–98.
Ritchie J.C. (1955a). A natural hybrid in Vaccinium II. Genetic studies in Vaccinium ×intermedium Ruthe. New Phytologist 54(3): 320–335. https://doi.org/10.1111/j.1469-8137.1955.tb06187.x.
Ritchie J.C. (1955b). Vaccinium vitis-idaea L. Journal of Ecology 43(2): 701–708. https://doi.org/10.2307/2257030.
Ritchie J.C. (1956). Vaccinium myrtillus L. Journal of Ecology 44(1): 291–299. https://doi.org/10.2307/2257181.
Rowland L.J, Mehra S., Dhanaraj A.L, Ogden E.L., Slovin J.P., Ehlenfeldt M.K. (2003). Development of EST-PCR markers for DNA fingerprinting and genetic relationship studies in blueberry (Vaccinium, section Cyanoccocus). Journal of the American Society for Horticultural Science 128(5): 682–690. https://doi.org/10.21273/JASHS.128.5.0682.
Schlautman B., Covarrubias-Pazaran G., Fajardo D., Steffan S., Zalap J. (2017). Discriminating power of microsatellites in cranberry organelles for taxonomic studies in Vaccinium and Ericaceae. Genetic Resources and Crop Evolution 64: 451–466. https://doi.org/10.1007/s10722-016-0371-6.
Schulp C.J.E., Thuiller W., Verburg P.H. (2014). Wild food in Europe: a synthesis of knowledge and data of terrestrial wild food as an ecosystem service. Ecological Economics 105: 292–305. https://doi.org/10.1016/j.ecolecon.2014.06.018.
Sgrò C.M., Lowe A.J., Hoffmann A.A. (2011). Building evolutionary resilience for conserving biodiversity under climate change. Evolutionary Applications 4(2): 326–337. https://doi.org/10.1111/j.1752-4571.2010.00157.x.
Song G.-Q., Hancock J.F. (2011). Chapter 10, Vaccinium. In: Kole C. (ed.). Wild crop relatives: genomic and breeding, resources, temperate fruits. Springer, New York, USA. p. 197–222. https://doi.org/10.1007/978-3-642-16057-8_10.
Van Oosterhout C., Hutchinson W.F., Wills D.P., Shipley P. (2004). MICRO‐CHECKER: software for identifying and correcting genotyping errors in microsatellite data. Molecular Ecology Notes 4(3): 535–538. https://doi.org/10.1111/j.1471-8286.2004.00684.x.
Vari A., Arany I., Kalóczkai A., Kelemen K., Papp J., Czúcz B. (2020). Berries, greens, and medicinal herbs—mapping and assessing wild plants as an ecosystem service in Transylvania (Romania). Journal of Ethnobiology and Ethnomedicine 16 article 13. https://doi.org/10.1186/s13002-020-0360-x.
Vieira M.L.C., Santini L., Diniz A.L., de Freitas Munhoz C. (2016). Microsatellite markers: what they mean and why they are so useful. Genetics and Molecular Biology 39(3): 312–328. https://doi.org/10.1590/1678-4685-GMB-2016-0027.
Weising K., Gardner R.C. (1999). A set of conserved PCR primers for the analysis of simple sequence repeat polymorphisms in chloroplast genomes of dicotyledonous angiosperms. Genome 42(1): 9–19. https://doi.org/10.1139/g98-104.
Wheeler G.L., Dorman H.E., Buchanan A., Challagundla L., Wallace L.E. (2014). A review of the prevalence, utility, and caveats of using chloroplast simple sequence repeats for studies of plant biology. Applications in Plant Sciences 2(12): 1400059. https://doi.org/10.3732/apps.1400059.
Witlock R., Hipperson H., Thompson D.B.A., Butlin R.K., Burke T. (2016). Consequences of in-situ strategies for the conservation of plant genetic diversity. Biological Conservation 203: 134–142. https://doi.org/10.1016/j.biocon.2016.08.006.
Young S.B. (1970). On the taxonomy and distribution of Vaccinium uliginosum. Rhodora 72(792): 439–459. https://www.jstor.org/stable/23311532. [Cited 1.4.2020].
Zoratti L., Palmieri L., Jaakola L., Häggman H. (2015). Genetic diversity and population structure of an important wild berry crop. AoB PLANTS 7 article plv117. https://doi.org/10.1093/aobpla/plv117.
Total of 50 references.
