Stanislav Vacek,
Zdeněk Vacek,
Lukáš Bílek,
Jaroslav Simon,
Jiří Remeš  ,
Iva Hůnová,
Jan Král,
Tereza Putalová,
Miroslav Mikeska
,
Iva Hůnová,
Jan Král,
Tereza Putalová,
Miroslav Mikeska
Structure, regeneration and growth of Scots pine (Pinus sylvestris L.) stands with respect to changing climate and environmental pollution
Vacek S., Vacek Z., Bílek L., Simon J., Remeš J., Hůnová I., Král J., Putalová T., Mikeska M. (2016). Structure, regeneration and growth of Scots pine (Pinus sylvestris L.) stands with respect to changing climate and environmental pollution. Silva Fennica vol. 50 no. 4 article id 1564. https://doi.org/10.14214/sf.1564
Highlights
- Pine forest stands showed positive development of stand structural characteristics related to their diversity, number of regeneration individuals and growth characteristics
- Tree-ring width was positively correlated with precipitation, while it was negatively correlated with temperature in growing seasons
- Mean NOx concentrations showed positive effect on radial growth of pine
- Serious defoliation was caused by SO2 concentrations and N deposition in combination with extreme climate events.
Abstract
Changes in the structure and development of managed Scots pine (Pinus sylvestris L.) stands with respect to changing environmental conditions were set for the period 1979–2015. The study was conducted in conditions of natural pinewoods and pine-oak sites on five permanent research plots (0.25 ha) in Eastern Bohemia, Czech Republic (CR). Studied forest stands showed positive development of stand structural characteristics related to their diversity, number of regeneration individuals and growth characteristics. The standing volume of regularly distributed tree layer in 2015 was in the range of 320–434 m3 ha–1, which indicates an increase by 5.9–20.0% over 10 years. Correlation between pine radial increment and the amount of precipitation was generally the strongest one. Positive statistically significant correlation between diameter increment and temperature was demonstrated only for the average March temperature of the current year. Within the CR, study site can be characterised as a medium polluted area both for sulphur and nitrogen, despite this SO2 concentrations and N deposition in combination with extreme climate events caused severe defoliation in pine stands. Conversely, radial growth was positively significantly correlated with mean NOx concentrations. Drought mainly in combination with even medium environmental pollution can further worsen the health status of pine stands in lowland areas of Central Europe. Thus, formulation of silvicultural techniques able to mitigate the impact of these stress factors is needed.
Keywords
Pinus sylvestris;
natural regeneration;
climate;
stand development;
production;
air-pollution
- Vacek, Czech University of Life Sciences Prague, Faculty of Forestry and Wood Sciences, Kamýcká 129, 165 21 Prague, Czech Republic E-mail vacekstanislav@fld.czu.cz
- Vacek, Czech University of Life Sciences Prague, Faculty of Forestry and Wood Sciences, Kamýcká 129, 165 21 Prague, Czech Republic E-mail vacekz@fld.czu.cz
- Bílek, Czech University of Life Sciences Prague, Faculty of Forestry and Wood Sciences, Kamýcká 129, 165 21 Prague, Czech Republic E-mail bilek@fld.czu.cz
- Simon, Mendel University in Brno, Faculty of Forestry and Wood Technology, Zemědělská 3, 613 00 Brno, Czech Republic E-mail jaroslav.simon@mendelu.cz
-
Remeš,
Czech University of Life Sciences Prague, Faculty of Forestry and Wood Sciences, Kamýcká 129, 165 21 Prague, Czech Republic
E-mail
remesj@email.cz
- Hůnová, Czech Hydrometeorological Institute, Na Šabatce 17 143 06 Prague, Czech Republic E-mail hunova@chmi.cz
- Král, Czech University of Life Sciences Prague, Faculty of Forestry and Wood Sciences, Kamýcká 129, 165 21 Prague, Czech Republic E-mail kraljan@fld.czu.cz
- Putalová, Czech University of Life Sciences Prague, Faculty of Forestry and Wood Sciences, Kamýcká 129, 165 21 Prague, Czech Republic E-mail putalova@fld.czu.cz
- Mikeska, University of Hradec Králové, Faculty of Science, Rokitanského 62, 500 03 Hradec Králové, Czech Republic E-mail Mikeska.Miroslav@uhul.cz
Received 8 February 2016 Accepted 8 September 2016 Published 27 September 2016
Views 329627
Available at https://doi.org/10.14214/sf.1564 | Download PDF

1 Introduction
Pinewoods take up a special position in vegetation development and zonality of the Czech Republic (Chytrý et al. 2010). These soil-exposed sites overshadow climate differences by their typical nature and strongly restrict the competitive capability of the major part of vegetation (Mikeska et al. 2008). Scots pine (Pinus sylvestris L.) as a pioneer tree species has relatively high requirements for light and its natural regeneration under the canopy of other tree species is relatively rare (Carlisle and Brown 1968; Richardson 1998; Poleno and Vacek 2009; Gaudio et al. 2011).
Pinewoods in lowland areas of Central Europe are often situated on poor and dry sandy soils while in these conditions expected climate changes can even result in more extreme dry and warm periods within the growing season (Briffa et al. 2009; Dubrovský et al. 2009). This may have further negative ecological impact on these sites with low water availability (Slodičák et al. 2011).
Species diversity, variability of tree size and heterogeneity in the spatial pattern of trees belong among the main factors of the forest stand structure (Pommering 2002; Puettmann et al. 2008; Vacek et al. 2014). The analysis of spatial pattern can provide a valuable information about intraspecific and interspecific competition or tree species responses to changing conditions of the environment (Nicotra et al. 1999; Keitt et al. 2002). The spatial structure can help to explain microclimatic changes, the origin of natural regeneration and the role of gap dynamics in this process (Zenner and Hibbs 2000; Bílek et al. 2014). Information on the stand structure also contributes to the better understanding of history, forest functions and future development of forest ecosystems (Franklin et al. 2002; Moser et al. 2002). Variability in the spatial pattern is a result of interacting biotic and abiotic ecological processes (Gholz et al. 1990; Franklin and Van Pelt 2004; Tuten et al. 2015), and is determined especially by relations between neighbouring trees and their groups (Hui et al. 2011). Spatial variability is also important for the development of ecosystem communities in the understorey (Fahey and Puetmann 2008; Bulušek et al. 2016).
Currently, small-scale close-to-nature forest management gains more and more attention among forest managers and researches as a management system that increases resistance of forests and their capacity of adapting to ongoing climate changes (Franklin et al. 2007; Allen et al. 2010; Smith 2011; Lloret et al. 2012; Cavin et al. 2013; Churchill et al. 2013; Reynolds et al. 2013; Merlin et al. 2015). Although pinewoods are an important component of Central European forest ecosystems, little attention has been paid to possibilities of creating more complex forest structures in this type of forest dominated by light demanding pine, oaks (Quercus spp.) and birch (Betula spp.) (Kint et al. 2009; Orczewska and Fernes 2011; Matuszkiewicz et al. 2013).
The aim of the present study was to monitor changes in the structure and development of managed Scots pine stands on their natural sites with respect to changing climate as well as air-pollution characteristics during the last decade. We hypothesise that climatically extreme periods characterized by extremely low precipitation and above-average temperatures in the vegetation period have negative effect on the radial growth and foliation of pine, while lower deposition of pollutants has an opposite effect. Better knowledge of these processes may be important for the formulation of best silvicultural techniques in lowland pine regions in Central Europe.
2 Materials and methods
2.1 Description of the territory of interest
The study was conducted in conditions of managed Scots pine stands on natural pinewoods and pine-oak sites on five permanent research plots (PRP) in the Třebechovicko microregion in the northeast of the Czech Republic. PRP are 50 × 50 m in size (0.25 ha) and are situated on a flat relief. Fig. 1 shows PRP localization while Table 1 documents basic data on PRP. These PRP are typical of Scots pine natural sites in conditions of central Europe (Mátyás et al. 2004).
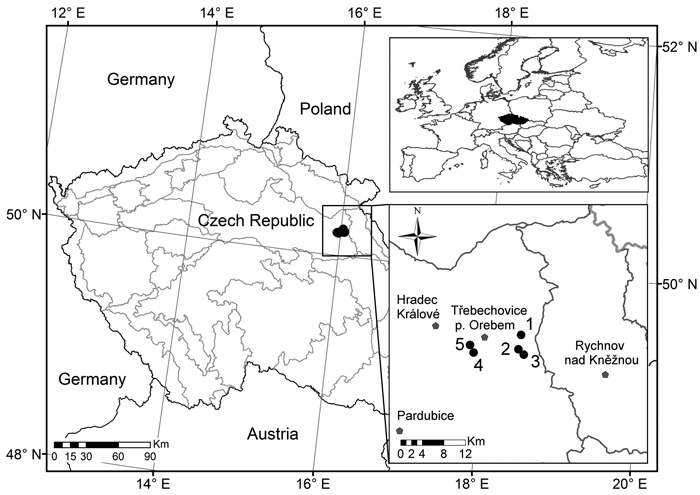
Fig. 1. Location of the permanent research plots 1–5 (black dots) in which the pine stands were investigated.
| Table 1. Overview of the basic characteristics of permanent research plots in 2015. | |||||||||
| Plot name | GPS | Age | Height | DBH | Volume | Altitude | Forest site type | Soil type | |
| m | cm | m3 ha–1 | m a.s.l. | ||||||
| 1 | Třebechovice 1 | 50.202°45´N 16.059°01´E | 90 | 21 | 27 | 410 | 267 | 1M7 - Pineto-Quercetum oligotrophicum arenosum | Dystric Arenic Cambisol |
| 2 | Třebechovice 2 | 50.196°27´N 16.056°46´E | 80 | 23 | 27 | 380 | 260 | 0K1 - Querceto-Pinetum acidophilum | Dystric Arenic Cambisol |
| 3 | Třebechovice 3 | 50.196°80´N 16.056°97´E | 80 | 26 | 21 | 300 | 260 | 0K1 - Querceto-Pinetum acidophilum | Podzol Arenic |
| 4 | Třebechovice 4 | 50.192°23´N 15.963°74´E | 140 | 22 | 30 | 400 | 245 | 0M2 - Querceto-Pinetum oligotrophicum | Podzol Arenic |
| 5 | Třebechovice 5 | 50.193°34´N 15.961°96´E | 130 | 24 | 28 | 430 | 245 | 0M2 - Querceto-Pinetum oligotrophicum | Podzol Arenic |
According to Quitt (1976) the climate is characterized with long, warm and dry summer, short transition period with moderately warm spring and moderately warm autumn. Winter is short, moderately warm and very dry, with short duration of snow cover. Average annual temperature is 6.9 °C according to the 1961–1990 climate normal, in the studied period it was 8.3 °C; average annual normal of precipitation amount is 774 mm, in the studied period it was by 5.9% lower (728 mm); the vegetation period is around 160 days (meteorological station Hradec Králové – GPS 50°12´N, 15°51´E).
The PRP order 1–5 classifies plots from the relatively most favourable to the most unfavourable ones in terms of site and stand conditions. It cannot be excluded that PRP 4 and 5 were degraded by litter raking in the past because these are small farm forests not too far from human dwellings.
2.2 Data collection
To determine the tree layer structure of woody plants of forest ecosystems the FieldMap technology (IFER-Monitoring and Mapping Solutions Ltd.) was used for establishment and repeated measurement of five PRP in 2005 and 2015. During measurements the position of all individuals of the tree layer with breast height diameter (dbh) larger than 7 cm was localized. In the tree layer heights of the live crown base and crown perimeter were also measured, minimally at 4 directions perpendicular to each other. Breast height diameters of the tree layer were always measured with a metal calliper to the nearest 1 mm, and tree heights and heights of the live crown base were measured with a laser Vertex hypsometer to the nearest 0.1 m. The tree layer was divided according to tree classes into upper storey (dominant and codominant trees) and lower storey (intermediate and suppressed trees). For individuals of natural regeneration above 1.5 m the same parameters as in the tree layer were measured. In natural regeneration below 1.5 m numbers and heights of individuals of particular tree species were determined in a 5 × 50 m transect on each plot. In deadwood tree species was identified and degree of decomposition was evaluated by a five-point scale according to Fridman and Walheim (2000). Total volume of deadwood and its proportion in the total standing volume were evaluated. Foliation and defoliation was annually estimated with an accuracy of 5%, according to the methodology applied by the ICP-Forests project in period 2005–2015 (Vacek et al. 2015). In 2015 in 30 mainly above-height and next uniform-height pine (dominant and codominant) trees on each PRP increment cores were taken at breast height (130 cm) perpendicularly to the stem axis in the north-south direction using a Pressler borer.
2.3 Data analysis
In all individuals of the tree layer structural and growth parameters, production quantity and quality, horizontal and vertical structure and biodiversity were evaluated on the particular plots. Tree volume was calculated using volume equations published by Petráš and Pajtík (1991).
To determine spatial distribution, index of non-randomness (Hopkins and Skellam 1954), aggregation index (Clark and Evans 1954) and pair correlation function (Stoyan and Stoyan 1992) were computed. The index of cluster size (David and Moore 1954) was used as a distribution index based on tree frequency in the particular quadrats. The size of quadrats on PRP was 10 × 10 m. The PointPro 2.2 program (Copyright 2010 Zahradník, CULS) and the R 3.1.2 software (Copyright 2014 The R FSCP) was used to calculate these characteristics describing the horizontal structure of individuals across the plot. The test of the significance of deviations from the values expected for random distribution of points was done using Monte Carlo simulations. Structural characteristics were computed using the Sibyla growth simulator (Fabrika and Ďurský 2005). Stand density index (SDI), crown projection area (CPA; the sum of all individual crown projection areas on PRP converted per 1 ha) and crown closure (CC; the horizontal area of PRP covered by crown projections without computing crown overlaps according to Crookston and Stage /1999/) were derived during the study of horizontal structure on PRP. Situational maps were created in the ArcGIS program (Copyright 1995–2010 Esri).
For biodiversity evaluation these indices were computed: diameter differentiation index, height differentiation index (Füldner 1995), species heterogeneity index (Shannon 1948), species evenness index (Pielou 1975), Arten-profil index (Pretzsch 2006), crown differentiation index and stand diversity index (Jaehne and Dohrenbusch 1997). The criteria of the structure indexes are given in Table 2.
| Table 2. Overview of indices describing the stand structure and their common interpretation. | ||||
| Criterion | Quantifiers | Label | Reference | Evaluation |
| Horizontal structure | Index of non-randomness | A (H&Si) | Hopkins, Skellam (1954) | mean value A = 0.5; aggregation A > 0.5; regularity A < 0.5 |
| Aggregation index | R (C&Ei) | Clark, Evans (1954) | mean value R = 1; aggregation R < 1; regularity R > 1 | |
| Index of cluster size | CS (D&Mi) | David, Moore (1954) | mean value CS = 1; aggregation CS > 1; regularity CS < 1 | |
| Vertical diversity | Arten-profil index | Ap (Pri) | Pretzsch (2006) | range 0–1; balanced vertical structure Ap < 0.3; selection forest Ap > 0.9 |
| Structure differen- tiation | Diameter dif. | TMd (Fi) | Füldner (1995) | range 0–1; low TM < 0.3; very high differentiation TM > 0.7 |
| Height dif. | TMh (Fi) | |||
| Crown dif. | K (J&Di) | Jaehne, Dohrenbusch (1997) | minimum K = 0, higher K = higher values; low K < 1.5; high differentiation K > 2.5 | |
| Species diversity | Heterogeneity | H´ (Shi) | Shannon (1948) | minimum H´= 0, higher H´= higher values |
| Evenness | E (Pii) | Pielou (1975) | range 0–1; minimum E = 0, maximum E = 1 | |
| Complex diversity | Stand diversity | B (J&Di) | Jaehne, Dohrenbusch (1997) | monotonous structure B < 4; uneven structure B = 6–8; very diverse structure B > 9 |
Tree-ring width increment series were individually cross-dated (removal of errors connected with the occurrence of missing tree-ring widths) and for determining the degree of similarity a statistical test in the PAST application programme was used (Knibbe 2007) and subsequently subjected to visual inspection according to Yamaguchi (1991). If a missing tree-ring width was found out, a tree ring of 0.01 mm in width was inserted in its place, in this place the increment was probably narrow and was not detected. The ring-width series from PRP were detrended and ring-width chronologies were created from them in the ARSTAN programme. The modified negative exponential function was applied (Grissino-Mayer et al. 1992) because of its capacity to determine short-term trends in past climate. The analysis of negative pointer years was done according to Schweingruber et al. (1990). For each tree the pointer year was tested as an extremely narrow tree-ring that does not reach 40% of the average of increments from previous 4 years. The occurrence of negative year was proved if such a strong reduction in increment occurred at least in 20% of trees on the plot. The standardized ring-width chronologies from PRP were correlated with climatic data (precipitation, temperatures; 1961–2014 from meteorological station Hradec Králové) and with air-pollution data (concentrations SO2, NOx, AOT40F /ozone exposure/, S and N deposition /1979–2014/ from meteorological station Svratouch – GPS 49°44´N, 16°02´E) according to the particular years. The DendroClim software was used for modelling diameter increment in dependence on climatic characteristics (Biondi and Waikul 2004). Variances are shown by standard deviation (± SD).
3 Results
3.1 Tree layer structure and development
The basic structural parameters of tree layer on PRP 1–5 in 2005 and 2015 are documented in Table 3. In 2015 the share of Scots pine ranged from 93.4–100.0%. Norway spruce (Picea abies (L.) Karst.) was represented by 2.4% on PRP 1, silver birch (Betula pendula Roth.) reached 2.1% on PRP 2 and 5.4% on PRP 3 and on other PRP these two tree species with durmast oak (Quercus petraea (Matt.) Liebl.) reached less than 1%. During the dynamics SDI (0.65–0.78) increased by 0.1–10.1%, only on PRP 5 stand density decreased by 2.5%. The crown projection area decreased by 4.2–26.5% on all plots in the studied period.
| Table 3. Detailed overview of stand characteristics of the tree layer on PRP 1–5 in 2005 and 2015. | |||||||||||||
| PRP | Year | Age | dbh | h | v | N | BA | V | PAI | MAI | CC | CPA | SDI |
| y | cm | m | m3 | trees ha–1 | m2 ha–1 | m3 ha–1 | m3 ha–1 y–1 | m3 ha–1 y–1 | % | ha | |||
| 1 | 2005 | 68 | 25.8 | 19.90 | 0.536 | 644 | 33.5 | 345 | 8.0 | 4.42 | 80.2 | 1.62 | 0.66 |
| 2015 | 80 | 27.1 | 21.44 | 0.627 | 660 | 38.1 | 414 | 8.1 | 5.18 | 77.1 | 1.47 | 0.73 | |
| 2 | 2005 | 59 | 26.3 | 21.33 | 0.531 | 644 | 35.1 | 342 | 7.5 | 4.96 | 80.2 | 1.61 | 0.70 |
| 2015 | 70 | 27.3 | 23.05 | 0.621 | 620 | 36.4 | 385 | 7.0 | 5.50 | 72.7 | 1.30 | 0.72 | |
| 3 | 2005 | 59 | 24.7 | 19.76 | 0.455 | 656 | 31.5 | 299 | 8.0 | 4.33 | 80.2 | 1.62 | 0.65 |
| 2015 | 70 | 26.0 | 20.60 | 0.523 | 612 | 32.5 | 320 | 7.0 | 4.57 | 69.3 | 1.18 | 0.65 | |
| 4 | 2005 | 120 | 31.2 | 22.63 | 0.798 | 472 | 36.2 | 377 | 6.5 | 2.90 | 76.2 | 1.44 | 0.68 |
| 2015 | 130 | 30.5 | 22.42 | 0.791 | 508 | 37.2 | 402 | 6.4 | 3.08 | 74.8 | 1.38 | 0.70 | |
| 5 | 2005 | 117 | 26.4 | 22.40 | 0.564 | 728 | 39.9 | 410 | 8.5 | 3.23 | 81.1 | 1.67 | 0.80 |
| 2015 | 128 | 27.8 | 23.91 | 0.662 | 656 | 39.7 | 434 | 7.1 | 3.39 | 70.4 | 1.22 | 0.78 | |
| Age average stand age, dbh mean quadratic breast height diameter, h mean height, v average tree volume, N number of trees per hectare, BA basal area, V stand volume, PAI periodic annual increment; MAI mean annual increment, CC canopy closure, CPA crown projection area, SDI stand density index | |||||||||||||
Average basal area in 2015 ranged from 32.5 to 39.7 m2 ha–1, which suggests an increase by 2.8–13.7%, only on PRP 5 basal area decreased by 0.5% as a result of salvage felling. The standing volume in 2015 was in the range of 320–434 m3 ha–1, which indicates an increase by 5.9–20.0% over 10 years. Scots pine accounted for a dominant proportion in the standing volume on all PRP (93.1–100%).
Mean annual increment in 2015 was 3.08–5.50 m3 ha–1 year–1, which indicated an increase by 5–17% in the last 10 years while total periodic annual increment in 2015 ranged from 6.4 to 8.1 m3 ha–1 year–1, and on all plots except PRP 1 (an increase by 1%) there was a decrease by 2–17% (Table 3). The volume of salvage fellings over the studied period was from 11.1 to 34.2 m3 ha–1 (on average 22.5 m3 ha–1), when the highest volume was recorded on PRP 5.
Fig. 2 represents diameter frequencies of the tree layer in 2005 and 2015. On all PRP there was a considerable shift of trees to higher diameter classes, and especially on PRP 1 and 4 there was a somewhat more pronounced increase in the thinnest diameter classes, not only in Norway spruce but also in silver birch and Scots pine. Fig. 3 shows height curves in 2005 and 2015.
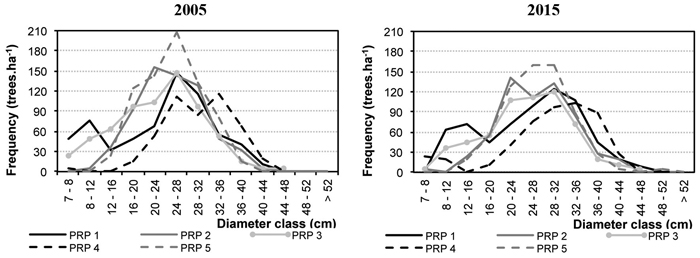
Fig. 2. Diameter distribution on the permanent research plots (PRP) 1–5 converted per ha in 2005 and 2015.
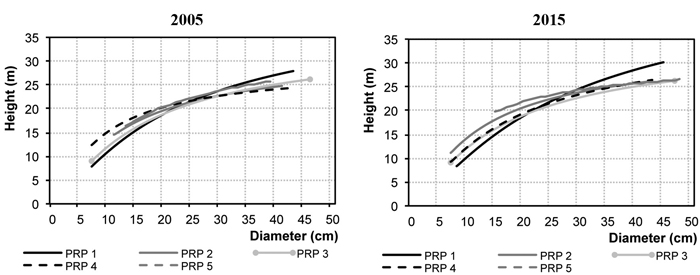
Fig. 3. Relationship between the height and diameter for the permanent research plots (PRP) 1–5 in 2005 and 2015.
3.2 Tree layer biodiversity
The indices describing the tree layer diversity on PRP 1–5 are shown in Table 4. Horizontal structure of the tree layer in 2015 is shown in Fig. 4. In the tree layer the individuals were distributed regularly on PRP according to structural indices, same structural characteristics were recorded for both periods.
| Table 4. Indices describing the structural, species and complex diversity of the tree layer on PRP 1–5 in 2005 and 2015. | |||||||||||
| PRP | Year | Indices | |||||||||
| R(C&Ei) | A(H&Si) | CS(D&Mi) | Ap(Pri) | TMd(Fi) | TMh(Fi) | K(J&Di) | H´(Si) | E(Pii) | B(J&Di) | ||
| 1 | 2005 | 1.105 | 0.496 | –0.048 | 0.400 | 0.349 | 0.304 | 2.809 | 0.163 | 0.271 | 8.022 |
| 2015 | 1.230* | 0.402* | –0.469* | 0.241 | 0.328 | 0.273 | 1.718 | 0.174 | 0.289 | 6.694 | |
| 2 | 2005 | 1.248* | 0.366* | –0.399* | 0.333 | 0.219 | 0.107 | 1.034 | 0.081 | 0.269 | 4.500 |
| 2015 | 1.264* | 0.350* | –0.604* | 0.269 | 0.229 | 0.099 | 2.310 | 0.062 | 0.130 | 6.469 | |
| 3 | 2005 | 1.198* | 0.403* | –0.378* | 0.407 | 0.289 | 0.191 | 1.486 | 0.145 | 0.241 | 6.211 |
| 2015 | 1.216* | 0.427 | –0.268 | 0.375 | 0.305 | 0.195 | 2.485 | 0.165 | 0.274 | 7.011 | |
| 4 | 2005 | 1.225* | 0.373* | –0.429* | 0.360 | 0.204 | 0.091 | 2.692 | 0.001 | 0.003 | 6.454 |
| 2015 | 1.205* | 0.419* | –0.271 | 0.322 | 0.307 | 0.187 | 1.706 | 0.012 | 0.025 | 5.791 | |
| 5 | 2005 | 1.268* | 0.345* | –0.496* | 0.595 | 0.194 | 0.094 | 0.579 | 0.000 | 0.000 | 2.923 |
| 2015 | 1.308* | 0.359* | –0.459* | 0.216 | 0.205 | 0.074 | 0.615 | 0.000 | 0.000 | 2.449 | |
| R aggregation index, A index of non-randomness, CS index of cluster size, Ap Arten-profil index, TMd diameter differentiation index, TMh height differentiation index, K crown differentiation index, H´ index of species heterogeneity, E index of species evenness, B stand diversity index; *statistically significant for horizontal structure (P < 0.05) | |||||||||||
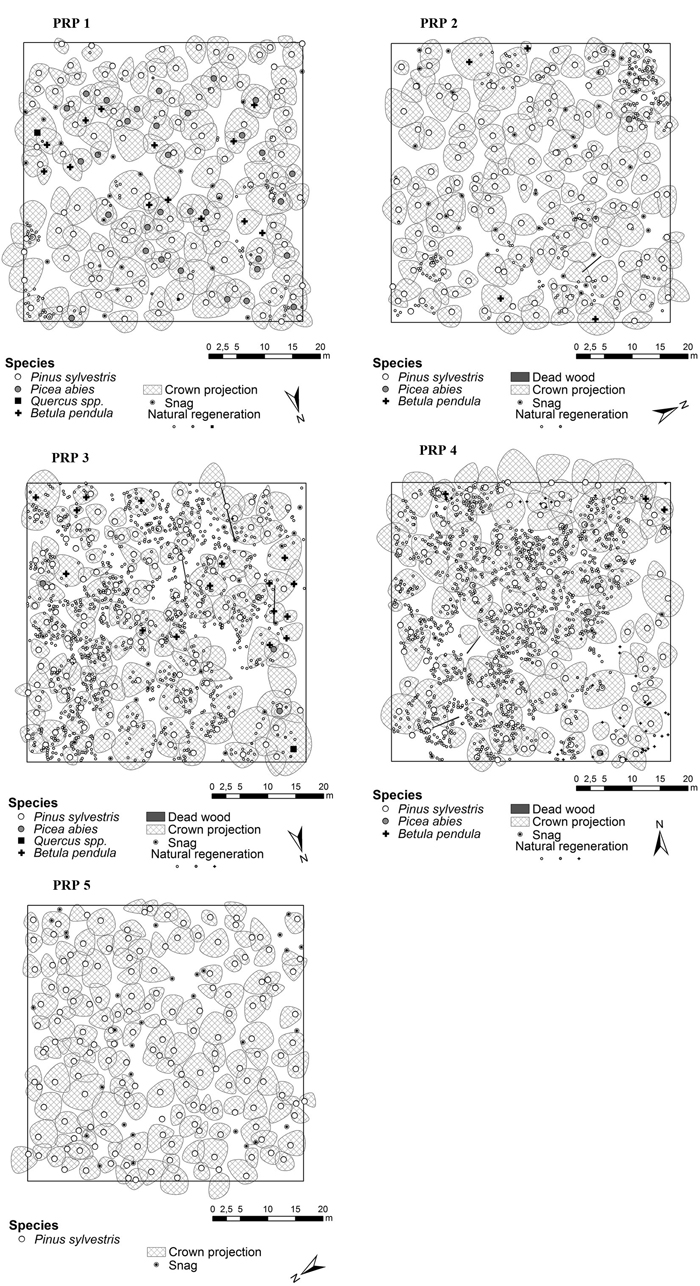
Fig. 4. Horizontal structure of the forest stands in Třebechovice locality on the permanent research plots (PRP 1–5) in 2015.
Vertical structure (Arten-profil index) was relatively variable on PRP (in 2005 Ap = 0.333– 0.596 and in 2015 Ap = 0.216–0.375), ranging from low to high diversity. In the course of the studied years vertical diversity decreased on all PRP. It was highest on PRP 5 in 2005 (Ap = 0.596). The structure differentiation indexes of diameter (TMd) and height (TMh) indicated forest stands with mostly low and medium structural differentiation (in 2005 TMd = 0.194–0.349, TMh = 0.094–0.304 and in 2015 TMd = 0.205–0.328, TMh = 0,074–0,273). The highest differentiation of diameter and height structure was observed on PRP 1 in the studied years (Table 4).
From the aspect of complex diversity (stand diversity index B), these were plots with monotonous structure (B = 2.449–2.923, PRP 5), even to uneven structure (B = 4.500–7.011, PRP 2–4) and uneven to heterogeneous structure (B = 6.694–8.022, PRP 1). In the course of the studied years, total diversity on PRP 1, 4 and 5 moderately decreased and on the contrary, it increased on PRP 2 and 3. During the studied years crown differentiation (K) increased on PRP 2, 3 and 5 while it decreased on PRP 1 and 4 (in 2005 K = 0.579–2.809).
Species diversity of the tree layer (entropy H´) was low on PRP 1–3 (H´ = 0.062–0.174) and minimum on PRP 4 and 5 (H´ = 0.062–0.174). Species evenness of the tree layer according to E index also suggested low biodiversity on PRP 1–3 (E = 0.130–0.274) and very low on PRP 4 and 5 (H´ = 0.000–0.025).
3.3 Structure and development of natural regeneration
Characteristics of natural regeneration on PRP in 2005 and 2015 are shown in Table 5 and in Fig. 5 (for 2015). At the beginning of observations the numbers of recruits were relatively low (64–1492 recruits ha–1). No regeneration occurred only on PRP 5 in the studied periods. By 2015 there was a considerable increase in the number of recruits (344–4940 recruits ha–1, i.e. 3.2–5.9 times) and substantial enhancement of their maturity. Its highest enhancement was observed on PRP 3 and 4, i.e. on plots with the lowest canopy closure (SDI 0.64 and 0.70). Leading shoot browsing was found out in durmast oak only. Damage to trees by fraying (less than 0.3%) was observed only in 2015 in pine on PRP 3 and 4. Fig. 5 shows the histograms of height frequencies of natural regeneration.
| Table 5. Numbers of recruits converted per ha, their percentage ratio and average height differentiated by tree species on the permanent research plots (PRP) 1–4. | ||||||||||||||||
| Species | Year | PRP 1 | PRP 2 | PRP 3 | PRP 4 | |||||||||||
| recruits ha–1 | % | cm | recruits ha–1 | % | cm | recruits ha–1 | % | cm | recruits ha–1 | % | cm | |||||
| Pinus sylvestris | 2005 | 44 | 69 | 142 | 116 | 94 | 117 | 1284 | 99 | 138 | 1448 | 97 | 162 | |||
| 2015 | 304 | 89 | 306 | 724 | 98 | 237 | 4080 | 99 | 298 | 4732 | 96 | 326 | ||||
| Picea abies | 2005 | 12 | 19 | 211 | 8 | 6 | 201 | 12 | 1 | 254 | 16 | 1 | 175 | |||
| 2015 | 36 | 10 | 371 | 12 | 2 | 421 | 40 | 1 | 420 | 32 | 1 | 380 | ||||
| Betula pendula | 2005 | 4 | 6 | - | 0 | 0 | - | 4 | 0 | 245 | 24 | 2 | 182 | |||
| 2015 | 0 | 0 | - | 0 | 0 | - | 4 | 0 | 435 | 176 | 3 | 392 | ||||
| Quercus petraea | 2005 | 4 | 6 | 122 | 0 | 0 | - | 0 | 0 | - | 0 | 0 | - | |||
| 2015 | 4 | 1 | 210 | 0 | 0 | - | 0 | 0 | - | 0 | 0 | - | ||||
| ∑ | 2005 | 64 | 100 | 147 | 124 | 100 | 118 | 1296 | 100 | 140 | 1492 | 100 | 167 | |||
| 2015 | 344 | 100 | 312 | 736 | 100 | 240 | 4124 | 100 | 300 | 4940 | 100 | 330 | ||||
| On PRP 5 no natural regeneration in the study period was present | ||||||||||||||||
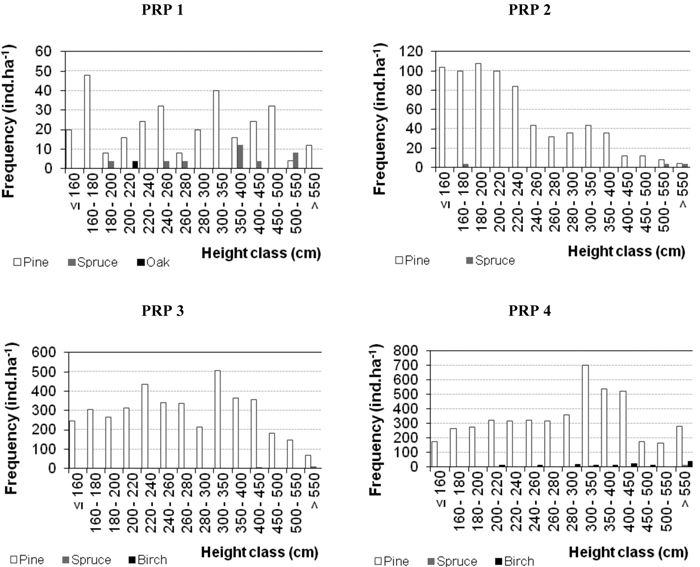
Fig. 5. Histograms of the height structure of natural regeneration on the permanent research plots (PRP) 1–4 differentiated by tree species and converted per ha in 2015.
The horizontal structure of natural regeneration in 2015 in recruits higher than 1.5 m is shown in Table 6 with highly aggregated spatial pattern of natural regeneration on all PRP.
| Table 6. Indices describing the horizontal structure of natural regeneration on the permanent research plots (PRP) 1–4 in 2015. | ||||
| Index | PRP 1 | PRP 2 | PRP 3 | PRP 4 |
| Hopkins–Skellam A | 0.742* | 0.923* | 0.776* | 0.890* |
| Clark–Evans R | 0.627* | 0.492* | 0.783* | 0.738* |
| David–Moore DM | 3.652* | 6.320* | 4.140* | 5.195* |
| * Statistically significant (P < 0.05) | ||||
The spatial relations between natural regeneration and tree layer by means of the pair correlation function are shown in Fig. 6. On all PRP the spatial distribution of recruits in relation to the tree layer was evaluated as random at distances longer than 2 m, only on PRP 3 there was a tendency to an aggregated pattern at distances longer than 8 m. At distances within 2 m the relations between recruits and the tree layer showed a significant aggregated distribution on all plots except PRP 1, where the spatial pattern of recruits and the tree layer was random along the entire curve.
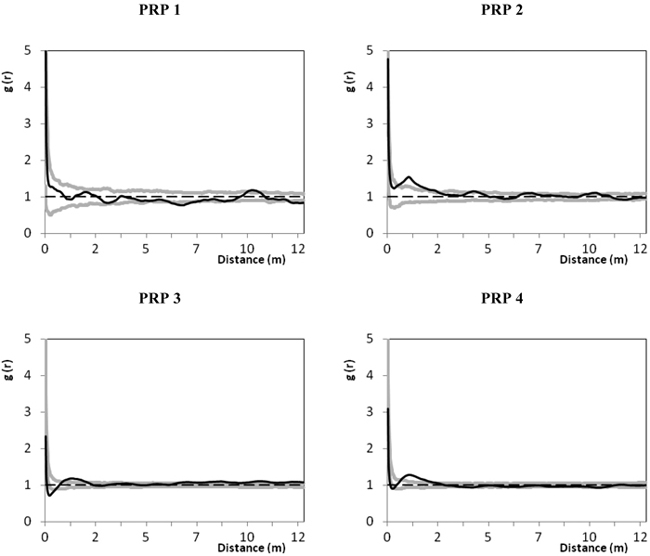
Fig. 6. Spatial relations of natural regeneration and the tree layer on the permanent research plots (PRP) 1–4 represented by the pair correlation function; the black line depicts the pair correlation function g(r) for real distances between individuals on the permanent research plots (PRP); two grey curves illustrate the 95% confidence interval for the random spatial pattern; r – radius defining distance between the selected points (trees and nature regeneration); g(r) > 1 indicates a clustering at distances r, while g(r) < 1 indicates a regularity in the respective distances r.
3.4 Deadwood structure and development
The highest volume of dead standing trees up to 7 cm top diameter was in 2005 on PRP 1 (13.1 m3 ha–1) and 5 (11.0 m3 ha–1); it was minimum on the other plots. In 2015 the volume of dead standing trees was in the range from 0.2 to 9.0 m3 ha–1 when the largest decrease was observed on PRP 1 (12.9 m3 ha–1) while the highest increase was on PRP 4 (7.9 m3 ha–1). As for the degrees of decomposition of dead standing trees, the representation of degree 1 was the highest (65.7%), and that of degree 3 and 4 was lower (15.3% and 10.8%).
The reserve of coarse woody debris on PRP was very low and even zero in 2005. In 2015 it ranged from 0.3 to 0.7 m3 ha–1 and on PRP 1 and 5 it did not occur at all. As for the degrees of coarse woody debris (CWD) decomposition, degrees 2, 3 and 4 were recorded.
3.5 Diameter growth with respect to environmental conditions
The mean tree-ring width ranged on PRP from to 1.08 mm (±0.31 SD) to 1.89 mm (±0.48 SD). Summary of chronologies including mean increment, explained proportion of signal (EPS), autocorrelation values before and after standardization and dendrometric characteristics of sampled trees is given in Table 7.
| Table 7. Chronologies characteristics including mean increment, Explained proportion of Signal (EPS) autocorrelation values before and after standardization and dendrometric characteristics of sampled trees on the permanent research plots (PRP) 1–5. | |||||||||
| PRP | Mean increment (mm) | Explained proportion of signal | Autocorrelation value before standardization | Autocorrelation value after standardization | Length in age 80 (cm) | Min. dbh* (cm) | Max. dbh* (cm) | Min. height (m) | Max. height (m) |
| 1 | 1.88516 | 0.874 | 0.7738 | 0.5116 | 11.38 | 24.2 | 33.3 | 24.9 | 27.5 |
| 2 | 1.65091 | 0.864 | 0.7481 | 0.5098 | 11.75 | 21.6 | 35.7 | 22.0 | 26.4 |
| 3 | 1.61937 | 0.685 | 0.7059 | 0.5577 | 11.40 | 20.0 | 36.7 | 20.4 | 25.5 |
| 4 | 1.07536 | 0.885 | 0.7123 | 0.6065 | 7.84 | 22.6 | 36.9 | 21.2 | 25.1 |
| 5 | 1.25056 | 0.879 | 0.7288 | 0.6109 | 8.46 | 24.1 | 36.4 | 24.8 | 26.9 |
| * Breast height diameter without bark | |||||||||
The regional standardized tree-ring chronology in 1960–1991 indicates a relatively balanced radial increment, subsequently followed by a trend of its decrease (Fig. 7). The years 1980, 2005 and 2014 with low radial increment were confirmed as negative pointer years.
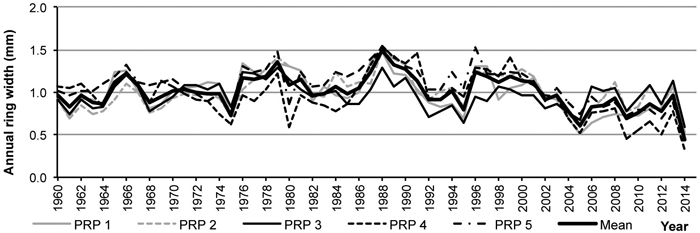
Fig. 7. Average tree-ring series from the permanent research plots (PRP) 1–5 and in total after age detrending.
A comparison of average tree-ring curves for the particular PRP showed goodness of fit between them, their t-test values above 3.4 documented synchronization reliability. Thanks to it, it was possible to construct the regional standardized ring-width chronology for pinewoods in the Třebechovicko microregion.
Correlations of standardized diameter increment with average monthly temperatures and precipitation indicated some statistically significant values. In the Třebechovicko microregion there were positive statistically significant correlations of diameter increment in 1962–2014 with temperature in March of the current year (r = 0.31; Fig. 8). Statistically significant positive correlations were also found out with precipitation amount in November and December of the previous year (r = 0.33 and 0.32) and in February, March, April and June of the current year (r = 0.33, 0.28, 0.36 and 0.35, respectively; Fig. 8).
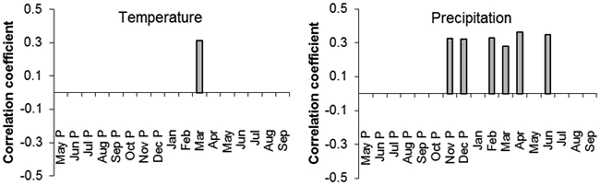
Fig. 8. The values of correlation coefficients of the regional standardized tree-ring chronology with the monthly temperature (left) and precipitation (right) from May of the previous year (P) to September of the current year for the period 1963–2014. Only correlation coefficients with statistically significant values (α = 0.05 %) are displayed.
Diameter increment was negatively significantly correlated with temperature in vegetation season of the current year and previous year and temperature in May–August of the previous year, while radial growth was positively significantly correlated with mean NOx concentrations and mean foliation of living trees (Table 8). In addition mean foliation was negatively correlated with mean SO2 concentrations and N deposition and positively correlated with climatic factors in May–August of the previous year.
| Table 8. Correlations between radial growth increment with climatic data (1963–2014) and air pollution factors (1984–2014; AOT40F 1996–2014) and health status (2005–2014). Significant correlations (P < 0.05) are indicated in bold. | ||||||||||||
| SO2 mean | SO2 veg | SO2 nonveg | NOx mean | NOx veg | NOx nonveg | AOT40F | S depos | N depos | Temp ActAnn | Temp ActVeg | Temp PrevVeg | |
| Foliation | –0.66 | –0.46 | –0.29 | –0.29 | –0.35 | –0.24 | –0.49 | –0.45 | –0.69 | –0.01 | 0.08 | 0.60 |
| Increment | 0.17 | 0.11 | 0.22 | 0.42 | 0.19 | 0.04 | 0.37 | 0.24 | 0.27 | –0.26 | –0.34 | –0.33 |
| Temp ActV-VIII | Temp PrevV-VIII | Temp ActI-III | Temp Nonveg | Prec ActSum | Prec ActVeg | Prec PrevVeg | Prec ActV-VIII | Prec PrevV-VIII | Prec ActI-III | Prec Nonveg | Incre- ment | |
| Foliation | 0.50 | 0.71 | 0.13 | –0.10 | –0.15 | –0.03 | 0.48 | –0.13 | 0.63 | –0.25 | –0.12 | 0.88 |
| Increment | –0.22 | –0.29 | –0.00 | –0.87 | 0.17 | 0.01 | 0.17 | –0.07 | 0.10 | 0.11 | 0.09 | 1.00 |
| SO2mean mean annual SO2 concentration, SO2veg mean SO2 concentrations in vegetation season, SO2nonveg mean SO2 concentrations in nonvegetation season, NOx, AOT40F ozone exposure, Sdepos annual S deposition, Ndepos annual N deposition, TempActAnn mean annual temperature, TempActVeg mean temperature in the current vegetation season, TempPrevtVeg mean temperature in the previous vegetation season, TempActV-VIII mean temperature in May–August of the given year, TempPrevV-VIII mean temperature in May–August of the previous year, TempActI-III mean temperature in January–March of the given year, TempNonveg mean temperature in the nonvegetation season; Prec sum of precipitation | ||||||||||||
4 Discussion
Regarding the ambient air pollution, presented results reflect pollution trends in the CR. Ambient air pollution was a major environmental problem in the CR in the past (Moldan and Schnoor 1992). Legislative changes introducing more stringent emission limits in the end of 1990s resulted in significant decrease of major air pollutants and important improvement of situation within the European context (European Environment Agency 2014). This holds for SO2 in particular, and to a lesser extent also for NOx. Decreasing trend of both ambient air pollution and deposition fluxes of sulphur and nitrogen is evident to the late 1990s, while these remain about the same since 2000 (Hůnová et al. 2004; Hůnová et al. 2014). Within the CR, the Třebechovicko microregion can be characterised as a medium polluted area both for sulphur and nitrogen (Hůnová 2001; Hůnová 2003), and also for ambient O3 (Hůnová and Schreiberová 2012). Despite this and in accordance with other research results (Vacek and Podrázský 1994; Augustaitis et al. 2007), SO2 concentrations and N deposition in combination with extreme climate events causes sever defoliation in pine stands. Since the reaction of trees to the impact of climatic factors in the polluted environment is more sensitive (Juknys et al. 2002), weakened forest stands can react on changing climate conditions characterised by longer drought periods by lowering their ecological stability, however the number of signal years is higher in healthy environmental conditions (Wilczyński 2006). On the other hand, the relation between N concentration and defoliation seemed to be rather weak, while N concentration had positive effect on the growth of the studied stands.
Correlation between pine increment and the amount of precipitation was generally the strongest one. Positive statistically significant correlation between diameter increment and temperature was confirmed only for the average March temperature of the current year. The drought stress shown by the negative correlation between diameter increment and average temperature of both the actual and preceding vegetation period was one of the main environmental stresses affecting the tree growth. Comparing other studies from the Mediterranean environment, from the Alps and from the boreal regions (Augustaitis et al. 2007; Oberhuber et al. 1998; Bogino et al. 2019) drought is a determining factor in the radial growth of Scots pine also in Central European conditions. Similarly, in northeast lowlands of Brandenburg (Germany), for the needle production of Scots pine both autumn precipitation of the previous year and summer precipitation are important predictors, whereas temperature seems to have a minor impact on needle parameters (Insinna et al. 2007).
A comparison of tree density with Sullivan et al. (2009) shows the highest similarity in the number of trees in natural stands (830 trees ha–1), in the other stands studied in the cited paper tree density exceeds 1000 trees ha–1. Similar results of higher density of individuals are reported from natural pine forests in NW Spain (Marcos et al. 2007). The maximum basal area reached on the studied PRP in 2015 was 39.7 m2 ha–1, quite distinctly exceeding the value of 30.6 m2 ha–1 reported from pinewoods in N Sweden (Mellander et al. 2007). With one exception it increased on all PRP in the studied period. In the future it is expected to approach the value of 41.2 m2 ha–1, found out on one research plot in the highly productive Valsaín area in central Spain (Montes et al. 2008).
A very important component of forest stands is natural regeneration while the understanding of its crucial factors leads to better knowledge of the whole spatial structure of forest stands (Pardos et al. 2008). Based on the results, by 2015 there was a high increase in the number of recruits compared with 2005 (up to 5.9 times). A comparison of these results with those of Martín-Alcón et al. (2015) shows an opposite trend because a decreasing number of recruits is reported in that paper. Such a trend is observed in other studies (Urbieta et al. 2011; Carnier et al. 2014). Martín-Alcón et al. (2015) explain a decreasing number of recruits by the worse availability of light in forest stands. In other works a negative influence of the competition of herbaceous vegetation is mentioned (Lucas-Borja et al. 2011; Prévosto et al. 2012). Changes in silvicultural practices in several last decades has influenced also the pinewood structure (Montes et al. 2005) and so they could influence conditions for natural regeneration. In our study PRP 5 had the highest initial basal area, number of trees and stand density index and canopy closure. These characteristics probably resulted in lower light intensity, which (in combination with high competition of Vaccinium myrtillus L.) strongly limited the number of pine regeneration individuals. Oppositely on PRP with lower stocking the regeneration success was higher. Generally higher thinning intensities in pine stands and ongoing efforts to regenerate pine under the parent stand as often formulated in the theory of close-to-nature silviculture (Bílek et al. 2016) lead not only to better health status of these stands (Prieto-Recio et al. 2015), but also more favourable conditions for their natural regeneration (Berbeito et al. 2009).
Based on the assessment of biodiversity, pronounced variability was revealed among the particular PRP and within them in the studied period. These results are basically consistent with Gao et al. (2014), who reports that mature stands with multi-storey structure usually have higher species diversity. Our study found mostly regular distribution of tree layer with low to medium structural diversity. Similarly results were obtained in managed pine stand in other localities in CR, respectively plots were slightly higher and diameters were more variable compared to Třebechovicko (Bílek et al. 2016). Barbier et al. (2008) and Chávez and MacDonald (2012) consider species diversity as a result of combined effects of several factors such as the influence of age, canopy and the species composition of studied stands. A change in species composition is closely related to differences in light conditions, developmental stages and stand density (Smith et al. 2008; Coote et al. 2013).
Tuten et al. (2015) reports a high degree of aggregation within a tree distance <10 m, similar results from pine stands are also presented by Sánchez Meador et al. (Sánchez et al. 2011), who documents a statistically significant aggregated pattern to a distance shorter than 40 m, with the aggregation peak at a distance of 6–8 m. Lydersen et al. (2013) observes aggregated structure within a distance of 20 m, then the pattern changes to random distribution. This trend is also described in other studies (Youngblood et al. 2004; Sánchez et al. 2009). In accordance with our results, prevailing regular to random distribution of dominant trees is reported by Li et al. (2012), while natural regeneration individuals tend to aggregated spatial pattern.
5 Conclusions
After 10 years, studied forest stands showed positive development of stand structural characteristics related to their diversity, number of regeneration individuals and growth characteristics. Tree-ring curves with goodness of fit between them indicated balanced conditions between the stands and climate and environmental conditions. However, silvicultural techniques should not be focused only at stand productivity, but also at risk prevention against stand disruption by stress factors such as air-pollution and drought periods. Small scale forestry based on the principles of selection harvest allows in this respect higher plasticity and better mitigation of negative impacts related to the climate change.
Acknowledgements
This study was supported by the Ministry of Agriculture of the Czech Republic, Project No. QJ1520037, and by the Czech University of Life Sciences Prague, Faculty of Forestry and Wood Sciences, Project IGA No. B02/16.
References
Allen C.D., Macalady A.K., Chenchouni H., Bachelet D., McDowell N., Vennetier M., Kitzberger T., Rigling A., Breshears D.D., Hogg E.H., Gonzalez P., Fensham R., Zhang Z., Castro J., Demidova N., Lim J.H., Allard G., Running S.W., Semerci A., Cobb N. (2010). A global overview of drought and heat-induced tree mortality reveals emerging climate change risks for forests. Forest Ecology and Management 259: 660–684. http://dx.doi.org/10.1016/j.foreco.2009.09.001.
Augustaitis A., Augustaitiene I., Deltuvas R. (2007). Scots pine (Pinus sylvestris L.) crown defoliation in relation to the acid deposition and meteorology in Lithuania. Water, Air and Soil Pollution 182(1): 335–348. http://dx.doi.org/10.1007/s11270-007-9345-9.
Barbier S., Gosselin F., Balandier P. (2008). Influence of tree species on understory vegetation diversity and mechanisms involved – a critical review for temperate and boreal forests. Forest Ecology and Management 254(1): 1–15. http://dx.doi.org/10.1016/j.foreco.2007.09.038.
Berbeito I., Fortin M.J., Montes F., Cañellas I. (2009). Response of pine natural regeneration to small-scale spatial variation in a managed Mediterranean mountain forest. Applied Vegetation Science 12: 488–503. http://dx.doi.org/10.1111/j.1654-109X.2009.01043.x.
Bílek L., Remeš J., Podrázský V., Rozenbergar D., Diaci J., Zahradník D. (2014). Gap regeneration in near-natural European beech forest stands in Central Bohemia-the role of heterogeneity and micro-habitat factors. Dendrobiology 71: 59–71. http://dx.doi.org/10.12657/denbio.071.006.
Bílek L., Vacek S., Vacek Z., Remeš J., Král J., Bulušek D. (2016). How close to nature is close-to-nature pine silviculture? Journal of Forest Science 62: 24–34. http://dx.doi.org/10.17221/98/2015-JFS.
Bulušek D., Vacek Z., Vacek S., Král J., Bílek L., Králíček I. (2016). Spatial pattern of relict beech (Fagus sylvatica L.) forests in the Sudetes of the Czech Republic and Poland. Journal of Forest Science 62(7): 293–305. http://dx.doi.org/10.17221/22/2016-JFS.
Biondi F., Waikul K. (2004). Dendroclim 2002: AC++ program for statistical calibration of climate signals in tree ring chronologie. Computers and Geoscience 30(3): 303–311.
Bogino S., Fernández Nieto M.J., Bravo F. (2019). Climate effect on radial growth of Pinus sylvestris at its southern and western distribution limits. Silva Fennica 43(4): 609–623. http://dx.doi.org/10.14214/sf.183.
Briffa K.R., van der Schrier G., Jones P.D. (2009). Wet and dry summers in Europe since 1750: evidence of increasing drought. International Journal of Climatology 29(13): 1894–1905. http://dx.doi.org/10.1002/joc.1836.
Carlisle A., Brown A.H.F. (1968). Pinus sylvestris. Journal of Ecology 56: 269–307. http://dx.doi.org/10.2307/2258078.
Carnicer J., Coll M., Pons X., Ninyerola M., Vayreda J., Penuelas J. (2014). Largescale recruitment limitation in Mediterranean pines: the role of Quercus ilex and forest successional advance as key regional drivers. Global Ecology and Biogeography 23(3): 371–384. http://dx.doi.org/10.1111/geb.12111.
Cavin L., Mountford E.P., Peterken G.F., Jump A.S. (2013). Extreme drought alters competitive dominance within and between tree species in a mixed forest stand. Functional Ecology 27: 1424–1435. http://dx.doi.org/10.1111/1365-2435.12126.
Chávez V., MacDonald S.E. (2012). Partitioning vascular understory diversity in mixed wood boreal forests: the importance of mixed canopies for diversity conservation. Forest Ecology and Management 271: 19–26. http://dx.doi.org/10.1016/j.foreco.2011.12.038.
Churchill D.J., Larson A.J., Dahlgreen M.C., Franklin J.F., Hessburg P.F., Lutz J.A. (2013) Restoring forest resilience: from reference spatial patterns to silvicultural prescriptions and monitoring. Forest Ecology and Management 291: 442–457. http://dx.doi.org/10.1016/j.foreco.2012.11.007.
Chytrý M., Danihelka J., Horsák M., Kočí M., Kubešová S., Lososová Z., Otýpková Z., Tichý L., Martynenko V.B., Baisheva E.Z. (2010). Modern analogues from the Southern Urals provide insights into biodiversity change in the early Holocene forests of Central Europe. Journal of Biogeography 37: 767–780. http://dx.doi.org/10.1111/j.1365-2699.2009.02256.x.
Clark P.J., Evans F.C. (1954). Distance to nearest neighbour as a measure of spatial relationship in populations. Ecology 35: 445–453.
Coote L., Dietzsch A.C., Wilson M.W., Graham C.T., Fuller L., Walsh A.T., Irwin S., Kelly D.L., Mitchell F.J.G., Kelly T.C., O’Halloran J. (2013). Testing indicators of biodiversity for plantation forests. Ecological Indicators 32: 107–115. http://dx.doi.org/10.1016/j.ecolind.2013.03.020.
Crookston N.L., Stage A.R. (1999). Percent canopy cover and stand structure statistics from the Forest Vegetation Simulator. Gen. Tech. Rep. RMRS-GTR-24. Ogden, UT. U.S. Department of Agriculture, Forest Service, Rocky Mountain Research Station. 11 p.
David F.N., Moore P.G. (1954). Notes on contagious distributions in plant populations. Annals of Botany 18:47–53.
Dubrovský M., Svoboda M.D., Trnka M., Hayes M.J., Wilhite D.A., Zalud Z., Hlavinka P. (2009). Application of relative drought indices in assessing climate change impacts on drought conditions in Czechia. Theoretical and Applied Climatology 96: 155–171. http://dx.doi.org/10.1007/s00704-008-0020-x.
European Environment Agency (2014). Air quality in Europe – 2014 report. EEA, Copenhagen, Denmark. 80 p.
Fabrika M., Ďurský J. (2005). Stromové růstové simulátory. EFRA, Zvolen, Slovakia. 112 p.
Fahey R.T., Puetmann K.J. (2008). Patterns in spatial extent of gap influence on understory plant communities. Forest Ecology and Management 255: 2801–2810. http://dx.doi.org/10.1016/j.foreco.2008.01.053.
Franklin J.F., Van Pelt R. (2004). Spatial aspects of structural complexity in old growth forests. Journal of Forestry 102: 22–28.
Franklin J.F., Spies T.A., Van Pelt R., Carey A.B., Thornburgh D.A., Berg D.R., Lindenmayer B., Harmon M.E., Keeton W.S., Shaw D.C., Bible K., Chen J.Q. (2002). Disturbances and structural development of natural forest ecosystems with silvicultural implications, using Douglas-fir forests as an example. Forest Ecologyand Management 155: 399–423. http://dx.doi.org/10.1016/S0378-1127(01)00575-8.
Franklin J.F., Mitchell R.J., Palik B. (2007). Natural disturbance and stand development principles for ecological forestry. USDA Forest Service, Northern Research Station, General Technical Report 19. USA. 44 p.
Fridman J., Walheim M. (2000). Amount, structure, and dynamics of dead wood on managed forestland in Sweden. Forest Ecology and Management 131: 23–36. http://dx.doi.org/10.1016/S0378-1127(99)00208-X.
Füldner K. (1995). Strukturbeschreibung in Mischbeständen. Forstarchiv 66: 235–606.
Gao T., Hedblom M., Emilsson T., Nielsen A.B. (2014). The role of forest stand structure as biodiversity indicator. Forest Ecology and Management 330: 82–93. http://dx.doi.org/10.1016/j.foreco.2014.07.007.
Gaudio N., Balandier P., Philippe G., Dumas Y., Jean F.,Ginisty C. (2011). Light-mediated influence of three understorey species (Calluna vulgaris, Pteridium aquilinum, Molinia caerulea) on the growth of Pinus sylvestris seedlings. European Journal of Forest Research 130(1): 77–89. http://dx.doi.org/10.1007/s10342-010-0403-2.
Gholz H.L., Ewel K.C., Teskey R.O. (1990). Water and forest productivity. Forest Ecology and Management 30(1–4): 1–18. http://dx.doi.org/10.1016/0378-1127(90)90122-R.
Grissino-Mayer H.D., Holmes R.L., Fritts H.C. (1992). International tree-ring data bank program library: user´s manual. Laboratory of Tree-Ring Research, University of Arizona, Tuscon, USA. 104 p.
Hopkins B., Skellam J.G. (1954). A new method for determining the type of distribution of plant individuals. Annals of Botany 18: 213–227.
Hui G.Y., Zhao X.H., Zhao Z.H., Gadow K.V. (2011). Evaluating tree species diversity based on neighborhood relationships. Forest Science 57: 292–300.
Hůnová I. (2001). Spatial interpretation of ambient air quality for the territory of the Czech Republic. Environmental Pollution 112: 107–119. http://dx.doi.org/10.1016/S0269-7491(00)00126-3.
Hůnová I. (2003). Ambient air quality for the territory of the Czech Republic in 1996–1999 expressed by three essential factors. Science of the Total Environment 303: 245–251. http://dx.doi.org/10.1016/S0048-9697(02)00493-X.
Hůnová I., Schreiberová M. (2012). Ambient ozone phytotoxic potential over the Czech Forests as assessed by AOT40. iForest-Biogeosciences and Forestry 5(3): 153–162. http://dx.doi.org/10.3832/ifor0617-005.
Hůnová I., Šantroch J., Ostatnická J. (2004). Ambient air quality and deposition trends at rural stations in the Czech Republic during 1993–2001. Atmospheric Environment 38: 887–898. http://dx.doi.org/10.1016/j.atmosenv.2003.10.032.
Hůnová I., Maznová J., Kurfurst P. (2014). Trends in atmospheric deposition fluxes of sulphur and nitrogen in Czech Forests. Environmental Pollution 184: 668–675. http://dx.doi.org/10.1016/j.envpol.2013.05.013.
Insinna P., Jalkanen R., Götz B. (2007). Climate impact on 100-year foliage chronologies of Scots pine and Ponderosa pine in the northeast lowlands of Brandenburg, Germany. Silva Fennica 41(4): 605–620. http://dx.doi.org/10.14214/sf.271.
Jaehne S., Dohrenbusch A. (1997). Ein Verfahren zur Beurteilung der Bestandesdiversität. [A method to evaluate forest stand diversity]. Forstwissenschaftliches Centralblatt 116: 333–345. http://dx.doi.org/10.1007/BF02766909.
Juknys R., Stravinskiene V., Vencloviene J. (2002). Tree-ring analysis for the assessment of anthropogenic changes and trends. Environmental Monitoring Assessment 77: 81–97. http://dx.doi.org/10.1023/A:1015718519559.
Keitt T.H., Bjørnstad O.N., Dixon P.M., Citron-Pousty S. (2002). Accounting for spatial pattern when modelling organism-environment interaction. Ecography 25(5): 616–625. http://dx.doi.org/10.1034/j.1600-0587.2002.250509.x.
Kint V., Lasch P., Lindner M., Muys B. (2009). Multipurpose conversion management of Scots pine towards mixed oak–birch stands – long-term simulation approach. Forest Ecology and Management 257: 199–214. http://dx.doi.org/10.1016/j.foreco.2008.08.031.
Knibbe B. (2007). PAST 4: personal analysis system for treering research, Version 4.2., SCIEM, Vienna, Austria. 101 p.
Li Y., Hui G., Zhao Z., Hu Y. (2012). The bivariate distribution characteristics of spatial structure in natural Korean pine broad-leaved forest. Journal of Vegetation Science 23: 1180–1190. http://dx.doi.org/10.1111/j.1654-1103.2012.01431.x.
Lloret F., Escudero A., Iriondo J.M., Martinez-Vilalta J., Valladares F. (2012). Extreme climatic events and vegetation: the role of stabilizing processes. Global Change Biology 18: 797–805. http://dx.doi.org/10.1111/j.1365-2486.2011.02624.x.
Lucas-Borja M.E., Fonseca T., Parresol B.R., Silva-Santos P., Garcia-Morote F.A., Tiscar-Oliver P.A. (2011). Modelling Spanish black pine seedling emergence: establishing management strategies for endangered forest areas. Forest Ecology and Management 262: 195–202. http://dx.doi.org/10.1016/j.foreco.2011.03.023.
Lydersen J.M., North M.P., Knapp E.E., Collins B.M. (2013). Quantifying spatial patterns of tree groups and gaps in mixed-conifer forests: reference conditions and long-term changes following fire suppression and logging. Forest Ecology and Management 304: 340–382. http://dx.doi.org/10.1016/j.foreco.2013.05.023.
Marcos J.A., Marcos E., Taboada A., Tárrega R. (2007). Comparison of community structure and soil characteristics in different aged Pinus sylvestris plantations and a natural pine forest. Forest Ecology and Management 247: 35–42. http://dx.doi.org/10.1016/j.foreco.2007.04.022.
Martín-Alcón S., Coll L., Salekin S. (2015). Stand-level drivers of tree-species diversification in Mediterranean pine forests after abandonment of traditional practices. Forest Ecology and Management 353: 107–117. http://dx.doi.org/10.1016/j.foreco.2015.05.022.
Matuszkiewicz J.M., Kowalska A., Kozłowska A., Roo-Zielińska E., Solon J. (2013). Differences in plant-species composition, richness and community structure in ancient and post-agricultural pine forests in central Poland. Forest Ecology and Management 310: 567–576. http://dx.doi.org/10.1016/j.foreco.2013.08.060.
Mátyás C., Ackzell L., Samuel C.J.A. (2004). EUFORGEN Technical Guidelines for genetic conservation and use for Scots pine (Pinus sylvestris) International Plant Genetic Resources Institute, Rome, Italy. 6 p. http://www.lbg.lasy.gov.pl/documents/20597836/28594685/Pinus+sylvestris.pdf.
Mellander P-E., Löfvenius M.O., Laudon H. (2007). Climate change impact on snow and soil temperature in boreal Scots pine stands. Climatic Change 85: 179–193. http://dx.doi.org/10.1007/s10584-007-9254-3.
Merlin M., Perot T., Perret S., Korboulewsky N., Vallet P. (2015). Effects of stand composition and tree size on resistance and resilience to drought in sessile oak and Scots pine. Forest Ecology and Management 339: 22–33. http://dx.doi.org/10.1016/j.foreco.2014.11.032.
Mikeska M., Vacek S., Prausová R., Simon J., Minx T., Podrázský V., Malík V., Kobliha J., Anděl P., Matějka K. (2008). Typologické vymezení, struktura a management přirozených borů a borových doubrav v ČR. [Typological definition, structure and management of natural pine and oak-pine stands in the Czech Republic]. Lesnická práce, Kostelec nad Černými lesy, Czech Republic. 450 p.
Moldan B., Schnoor J.L. (1992). Czechoslovakia: examining a critically ill environment. Environmental Science Technology 26: 14–21. http://dx.doi.org/10.1021/es00025a001.
Montes F., Sánchez M., del Río M., Cañellas I. (2005). Using historic management records to characterize the effects of management on the structural diversity of forests. Forest Ecology and Management 207: 279–293. http://dx.doi.org/10.1016/j.foreco.2004.10.031.
Montes F., Rubio A., Barbeito I., Cañellas I. (2008). Characterization of the spatial structure of the canopy in Pinus silvestris L. stands in Central Spain from hemispherical photographs. Forest Ecology and Management 255: 580–590. http://dx.doi.org/10.1016/j.foreco.2007.09.070.
Moser W.K., Jackson S.M., Podrázský V., Larsen D.R. (2002). Examination of stand structure on quail plantations in the Red Hills region of Georgia and Florida managed by the Stoddard–Neel system: an example for forest managers. Forestry 75(4): 443–449. http://dx.doi.org/10.1093/forestry/75.4.443.
Nicotra A.B., Chazdon R.L., Iriarte S.V.B. (1999). Spatial heterogeneity of light and woody seedling regeneration in tropical wet forests. Ecology 80: 1908–1926. http://dx.doi.org/10.1890/0012-9658(1999)080%5B1908:SHOLAW%5D2.0.CO;2.
Oberhuber W., Stumböck W., Kofler W. (1998). Climate-tree-growth relationships of Scots pine stands (Pinus sylvestris L.) exposed to soil dryness. Trees 13: 19–27. http://dx.doi.org/10.1007/s004680050183.
Orczewska A., Fernes M. (2011). Migration of herb layer species into the poorest post-agricultural pine woods adjacent to ancient pine forests. Polish Journal Ecology 59: 113–123.
Pardos M., Montes F., Cañellas I. (2008). Spatial dynamics of natural regeneration in two differently managed Pinus sylvestris stands before and after silvacultural intervention using replicated spatial point patterns. Forestry Science 54: 260–272.
Petráš R., Pajtík J. (1991). Sústava Česko-slovenských objemových tabuliek drevín. [The set of Czecho-Slovakian volume tables of tree species]. Lesnícky časopis 37: 49–56.
Pielou E.C. (1975). Ecological diversity. Wiley, New York, USA. 165 p.
Poleno Z., Vacek S. et al. (2009). Pěstování lesů III. Praktické postupy pěstování lesů. [Silviculture III. Practical approaches in silviculture]. Lesnická práce, Kostelec nad Černými lesy, Czech Republic. 952 p.
Pommerening A. (2002). Approaches to quantifying forest structures. Forestry. 75: 305–324. http://dx.doi.org/10.1093/forestry/75.3.305.
Pretzsch H. (2006). Wissen nutzbar machen für das Management von Waldökosystemen. Allgemeine Forstzeitschrift/Der Wald 61: 1158–1159.
Prévosto B., Amandier L., Quesney T., de Boisgelin G., Ripert C. (2012). Regenerating mature Aleppo pine stands in fire-free conditions: site preparation treatments matter. Forest Ecology and Management 282: 70–77. http://dx.doi.org/10.1016/j.foreco.2012.06.043.
Prieto-Recio C., Martín-García J., Bravo F., Diez J.J. (2015). Unravelling the associations between climate, soil properties and forest management in Pinus pinaster decline in the Iberian Peninsula. Forest Ecology and Management. 356: 74–83. http://dx.doi.org/10.1016/j.foreco.2015.07.033.
Puettmann K.J., Coates K.D., Messier C.C. (2008). A critique of silviculture: managing for complexity. Island Press, Washington, USA. 198 p.
Quitt E. (1976). Klimatické oblasti Československa. [Climatic regions of Czechoslovakia]. Study geography. Brno, Czech Republic. 73 p.
Reynolds R.T., Sánchez Meador A.J., Youtz J.A., Nicolet T., Matonis M.S., Jackson P.L., De Lorenzo D.G., Graves A.D. (2013). Restoring composition and structure in southwestern frequent-fire forests: a science-based framework for improving ecosystem resiliency. United States Forest Service, Rocky Mountain Research Station, Fort Collins, Colorado, United States. 76 p.
Richardson D.M. (1998). Ecology and biogeography of Pinus. Cambridge University Press, Cambridge, UK. 535 p.
Sánchez Meador A.J., Moore M.M., Bakker J.D., Parysow P.F. (2009). 108 years of change in spatial pattern following selective harvest of a ponderosa pine stand in northern Arizona, USA. Journal of Vegetation Science 20(1): 79–90. http://dx.doi.org/10.1111/j.1654-1103.2009.05464.x.
Sánchez Meador A.J., Parysow P.F., Moore M.M. (2011). A new method for delineating tree patches and assessing spatial reference conditions of ponderosa pine forests in northern Arizona. Restoration Ecology 19(4): 490–499. http://dx.doi.org/10.1111/j.1526-100X.2010.00652.x.
Schweingruber F.H., Eckstein D., Serre-Bachet F., Bräker O.U. (1990). Identification, presentation and interpretation of event years and pointer years in dendrochronology. Dendrochronologia 8: 9–38.
Shannon C.E. (1948). A mathematical theory of communications. Bell System Technical Journal 27: 379–423. http://dx.doi.org/10.1002/j.1538-7305.1948.tb01338.x.
Slodičák M., Novák J., Dušek D. (2011). Canopy reduction as a possible measure for adaptation of young Scots pine stand to insufficient precipitation in Central Europe. Forest Ecology Management 262: 1913–1918. http://dx.doi.org/10.1016/j.foreco.2011.02.016.
Smith G.F., Gittings T., Wilson M., French L., Oxbrough A., O’Donoghue S., O’Halloran J., Kelly D.L., Mitchell F.J.G., Kelly T., Iremonger S., McKee A.-M., Giller P. (2008). Identifying practical indicators of biodiversity for stand-level management of plantation forests. Biodiversity and Conservation 17: 991–1015. http://dx.doi.org/10.1007/s10531-007-9274-3.
Smith M.D. (2011). An ecological perspective on extreme climatic events: a synthetic definition and framework to guide future research. Journal of Ecology. 99: 656–663. http://dx.doi.org/10.1111/j.1365-2745.2011.01798.x.
Stoyan D., Stoyan H. (1992). Fraktale Formen und Punktfelder: Methoden der Geometrie-Statistik. Akademieverlag GmbH, Berlin, Germany. 394 p.
Sullivan T.P, Sullivan D.S., Lindgren P.M.F., Ransome D.B. (2009). Stand structure and the abundance and diversity of plants and small mammals in natural and intensively managed forests. Forest Ecology and Management 258: 127–141. http://dx.doi.org/10.1016/j.foreco.2009.06.001.
Tuten M.C., Sánchez Meador A., Fulé P.Z. (2015). Ecological restoration and fine-scale forest structure regulativ in southwestern ponderosa pine forests. Forest Ecology and Management 348: 57–67. http://dx.doi.org/10.1016/j.foreco.2015.03.032.
Urbieta I.R., Garcia L.V., Zavala M.A., Maranon T. (2011). Mediterranean pine and oak distribution in southern Spain: is there a mismatch between regeneration and adult distribution? Journal of Vegetation Science 22: 18–31. http://dx.doi.org/10.1111/j.1654-1103.2010.01222.x.
Vacek S., Podrázský V. (1994). Decline of pine forests in the protected area Broumovsko and their nutrition status. In: Matějka K. (ed.). Investigation of the forest ecosystems and of forest damage. Lowland and submontane forests and monitoring of the forest status. VÚLHM, Praha. p. 176–183.
Vacek S., Vacek Z., Podrázský V., Bílek L., Bulušek D., Štefančík I., Remeš J., Štícha V., Ambrož R. (2014). Structural diversity of autochthonous beech forests in Broumovské Stěny national nature reserve, Czech Republic. Austrian Journal of Forest Science 131(4): 191–215.
Vacek S., Hůnová I., Vacek Z., Hejcmanová P., Podrázský V., Král J., Putalová T., Moser W.K. (2015). Effects of air pollution and climatic factors on Norway spruce forests in the Orlické hory Mts. (Czech Republic), 1979–2014. European Journal of Forest Research 134(6): 1127–1142. http://dx.doi.org/10.1007/s10342-015-0915-x.
Wilczyński S. (2006). The variation of tree-ring widths of Scots pine (Pinus sylvestris L.) affected by air pollution. European Journal of Forest Research 125: 213–219. http://dx.doi.org/10.1007/s10342-005-0106-2.
Yamaguchi D.K. (1991). A simple method for cross-dating increment cores from living trees. Canadian Journal of Forest Research 21(3): 414–416. http://dx.doi.org/10.1139/x91-053.
Youngblood A., Max T., Coe K. (2004). Stand structure in eastside old-growth ponderosa pine forests of Oregon and Northern California. Forest Ecology and Management 199(2–3): 199–217. http://dx.doi.org/10.1016/j.foreco.2004.05.056.
Zenner E.K., Hibbs D.E. (2000). A new method for modeling the heterogeneity of forest structure. Forest Ecology and Management 129: 75–87. http://dx.doi.org/10.1016/S0378-1127(99)00140-1.
Total of 94 references.
