Enéas Ricardo Konzen  ,
Raquel Peron,
Márcio Akira Ito,
Gilvano Ebling Brondani,
Siu Mui Tsai
,
Raquel Peron,
Márcio Akira Ito,
Gilvano Ebling Brondani,
Siu Mui Tsai
Molecular identification of bamboo genera and species based on RAPD-RFLP markers
Konzen E. R., Peron R., Ito M. A., Brondani G. E., Tsai S. M. (2017). Molecular identification of bamboo genera and species based on RAPD-RFLP markers. Silva Fennica vol. 51 no. 4 article id 1691. https://doi.org/10.14214/sf.1691
Highlights
- We investigated the potential of RAPD-RFLP (Random Amplified Polymorphic DNA, Restriction Fragment Length Polymorphism) in detecting genetic relationships among bamboo genera and species
- RFLP profiles resolved in acrylamide gels revealed high number of markers, which accurately differentiated species and genera, based on cophenetic correlation coefficients
- We recommend RAPD-RFLP for analyses of genetic diversity and divergence among bamboo genera, species and varieties.
Abstract
Bamboo species have a very significant ecological and economic impact. Determining morphological and genetic differences among bamboo genera and species are crucial to explore desirable traits for breeding purposes. Several advances have been made in the taxonomy of bamboos by using molecular fingerprinting tools and next generation sequencing technologies. Nevertheless, classical molecular markers such as RAPD (Random Amplified Polymorphic DNA), AFLP (Amplified Fragment Length Polymorphism) and ISSR (Inter Simple Sequence Repeats) also provide an accurate discrimination among genera and species. Moreover, the RAPD-RFLP (Random Amplified Polymorphic DNA, Restriction Fragment Length Polymorphism) method, in which amplification products from RAPD are digested with restriction enzymes, is a reliable, fast and cost-effective method for fingerprinting. RAPD-RFLP has been scarcely used in the literature and no report regarding bamboo taxonomy is available with this method. Here we explored the molecular (RAPD, RAPD-RFLP) variation among genera (Bambusa, Dendrocalamus, Guadua and Phyllostachys) and species of bamboo cultivated in Brazil. Both molecular markers allowed clear distinction among the genera studied. Moreover, high cophenetic correlation values in UPGMA clusters indicated their potential for discriminating bamboo species. The digestion of RAPD products (RFLP) resulted in high number of polymorphic bands and produced very characteristic profiles for each genus with three enzyme combinations (HindIII/HaeIII, HinfI/RsaI, and single digestion with MspI). We recommend RAPD-RFLP as a reproducible and informative method for screening differences among genera, species and varieties of bamboos. Providing a cost-effective and accurate method for species identification and characterization is straightforward for bamboo conservation, management and breeding.
Keywords
molecular markers;
molecular screening;
restriction enzymes;
genetic divergence;
Dendrocalamus;
Bambusa
-
Konzen,
Cell and Molecular Biology Laboratory, Center for Nuclear Energy in Agriculture (CENA), University of Sao Paulo (USP), Centenário Av., 303, Piracicaba, SP, P.O. Box 96, Brazil; Forest Sciences, Federal University of Lavras (UFLA), Lavras, MG, P.O. Box 3037, Brazil
E-mail
erkonzen@gmail.com
- Peron, Cell and Molecular Biology Laboratory, Center for Nuclear Energy in Agriculture (CENA), University of Sao Paulo (USP), Centenário Av., 303, Piracicaba, SP, P.O. Box 96, Brazil E-mail rperon@purdue.edu
- Ito, Embrapa Western Agriculture, Brazilian Agricultural Research Corporation (EMBRAPA), BR 163 Rd., km 253, Dourados, MS, P.O. Box 449, Brazil E-mail marcio.ito@embrapa.br
- Brondani, Forest Sciences, Federal University of Lavras (UFLA), Lavras, MG, P.O. Box 3037, Brazil E-mail gebrondani@gmail.com
- Tsai, Cell and Molecular Biology Laboratory, Center for Nuclear Energy in Agriculture (CENA), University of Sao Paulo (USP), Centenário Av., 303, Piracicaba, SP, P.O. Box 96, Brazil E-mail tsai@cena.usp.br
Received 4 March 2017 Accepted 3 August 2017 Published 11 August 2017
Views 104308
Available at https://doi.org/10.14214/sf.1691 | Download PDF

Abbreviations
RAPD – Random Amplified Polymorphic DNA
AFLP – Amplified Fragment Length Polymorphism
ISSR – Inter Simple Sequence Repeats
RFLP – Restriction Fragment Length Polymorphism
UPGMA – Unweighted Pair-Group Methods with Arithmetic Mean
1 Introduction
Bamboos (sub-family Bambusoidae, family Poaceae) comprise approximately 1290 species, which are naturally distributed all over the world (Hamzah et al. 2016). Most of the species richness is found in Pacific Asia and South America (Bystriakova et al. 2003; Das et al. 2008). Bamboos are used for a wide range of applications such as for umbrella handles, fishing rods, mud huts, mats, baskets (Bystriakova et al. 2003), concrete reinforcement (Ghavami 2005), building material for supporting structures (Van der Lugt et al. 2006), charcoal preparation (Xiong et al. 2014; Xia et al. 2016), cellulose extraction (Li et al. 2015), hybrid microfibers fabrication (Yu et al. 2014), and forages for maintaining environmental conditions (Panizzo et al. 2016). Due to their fast growth rate (5–7 years to mature) and some potential fuel characteristics, e.g., low ash content, alkali index or heating value, they might also be a valuable resource for energy (Bystriakova et al. 2003). Research on their pharmaceutical applications are of increasing interest (Ho et al. 2013). The combination of fast growth, natural vegetative propagation and their adequacy for several products makes bamboos suitable for replacing other perennial and woody species for various industrial applications (Bonilla et al. 2010; Hamzah et al. 2016).
In a scenery of increased disturbance to the environment, bamboos arise as promising alternatives for sustainable use of plant genetic resources (Vogtlander et al. 2010), reforestation, restoration of degraded areas and carbon sequestration (Bonilla et al. 2010). The knowledge of botanical and ecological aspects of bamboos, along with their genetic resources is essential for their conservation and discovery of new potential applications. Moreover, considering the multiple species and their morphological similarities in several instances, it is important to distinguishing such species at the taxonomical level for proper establishment of strategies aimed at their conservation. A well-designed conservation project relies on proper constituted germplasm banks or repositories, in which species and accessions are described by their morphological and genetic features (Generoso et al. 2016).
Taxonomy of bamboos has been traditionally set based on morphological traits for different parts of the plants such as rhizomes, branches, leaves, inflorescences and fruits. Several classification systems have been proposed and phylogenetic analyses have provided genetic relationships based on morphological and molecular analyses (Das et al. 2008). Particular characteristics of bamboo species have also been determined by scanning electron microscopy, analyzing specific cellular or subcellular structures (Gomes and Neves 2009). However, the molecular identity of each species has been more acknowledged in recent years, as various studies have provided high-confidence results for the differentiation at the genus, species and accession levels (Yeasmin et al. 2015).
Molecular studies have provided significant advances in the comprehension of various research questions with bamboos. First, for molecular identification and phylogenetic relationships, RAPD markers were used for distinguishing species of the genera Bambusa, Dendrocalamus, Dinocloa and Cephalostachyum (Nayak et al. 2003). Two specific RAPD markers from Bambusa balcooa Roxb. and B. tulda Roxb. were converted to SCAR (Sequence Characterized Arbitrary Regions) in order to obtain proper markers for the molecular identification of the species (Das et al. 2005). Another class of markers, the AFLP (Amplified Fragment Length Polymorphism), were screened for detecting genetic variability and defining phylogenetic relationships among bamboo species from a collection of Singapore (Loh et al. 2000) and India (Waikhom et al. 2012). As alternative dominant genetic markers, ISSR (Inter Simple Sequence Repeats) markers have been used to distinguishing bamboo species (Lin et al. 2010; Mukcherjee et al. 2010). The genetic diversity has been another research question addressed to the within-species level, such as a group of Ochlandra travancorica Benth accessions from India, combining RAPD and AFLP markers (Nag et al. 2013). The association between morphological traits and molecular markers such as RAPD in bamboo collections has also been a research problem of concern (Shalini et al. 2013). As bamboos have evolved with natural proclivity for vegetative propagation, the clonal structure of populations has been the motive for investigation in a community of Phyllostachys pubescens (Mazel) Ohwi (Isagi et al. 2004).
To specifically address phylogenetic and taxonomic questions, however, it has been usual the analysis of plastid markers due their higher sequence conservation. One major study with that purpose on bamboos was performed with five plastid markers that were screened to analyze the phylogenetic relationships among 33 bamboo taxa. It enabled the categorization of bamboos according to the tribes they belonged, as well as their major distribution areas throughout the world (Kelchner et al. 2013). To better acknowledge the molecular screening of bamboo species, a recent review has compiled the various studies conducted so far (Yeasmin et al. 2015).
Therefore, the use of molecular markers has revolutionized the extent of resolution to what phylogenetic and population genetic studies could achieve. The development of Polymerase Chain Reaction (PCR) pulsed the numerous derivative techniques for genetic analyses aforementioned, such as RAPD (Williams et al. 1990). Genuine concern, however, has been described about RAPD markers for their low reproducibility and, therefore, lack of resolution. However, some line of evidence has shown that this issue might be circumvented if the PCR conditions are optimized, especially the annealing temperature and the concentration of reaction components (Scoric et al. 2012; Lencina et al. 2016). An alternative and simple method for genotyping bamboos is PCR-RFLP (Polymerase Chain Reaction, Restriction Fragment Length Polymorphism). It is based on the digestion of PCR products with different combinations of restriction enzymes. After digestion, the products are separated by gel electrophoresis (agarose or acrylamide). PCR-RFLP has been frequently conducted with the digestion of PCR products of ITS (Internal Transcribed Spacer) regions in plants (Biswas et al. 2013) and organelle genes and genomes (Schlogl et al. 2007). Little work has also been shown with the digestion of RAPD products with restriction enzymes in tree species, such as Pinus resinosa Aiton (DeVerno and Mosseler 1997). RAPD-RFLP profiles have revealed great potential for distinguishing plant species and accessions (DeVerno and Mosseler 1997). Nonetheless, no reports on the application of such method for bamboos have been provided so far.
As bamboos have been of increasing interest in a wide range of applications and more attention has been dedicated to its identification and conservation, we fingerprinted a set of bamboo species integrating a collection of the Bamboo Active Germplasm Bank (AGB) from Brazil, using RAPD and RAPD-RFLP markers. This AGB encompasses various bamboo species of ecological and economic value. However, we performed molecular analyses with samples of the most important species cultivated for the market and industries (economic aspect) in Brazil and other countries, such as those from genera Bambusa, Dendrocalamus and Phyllostachys. Moreover, we aimed at representing the Neotropical genus Guadua, with species also native to Brazil, with potential for ornamental and economic usage, but of special conservation concern, as they are native to the Amazon.
Therefore, this study was aimed at validating RAPD-RFLP as a method for estimating the genetic relationships among bamboo taxa (genera and species), providing a simple and cost-effective strategy for their molecular categorization with reliable results. To achieve such goal, we examined a few species representatives within each of the following genera, considering their economic and ecological importance: Bambusa, Dendrocalamus, Phyllostachys and Guadua. This method might be employed to further examine wider sets of species and populations of bamboos from the AGB or that are yet to be collected, distinguished and incorporated to germplasm banks for conservation and breeding.
2 Material and methods
2.1 Plant materials
We sampled 13 taxa from the Bamboo Active Germplam Bank (AGB) at the Development and Research Station (UPD/DDD/APTA/SAA) (23°21´S, 47°51´W), Tatuí, São Paulo State, Brazil. The following taxa were analyzed: Bambusa vulgaris Schrad. ex J.C. Wendl., B. vulgaris var. vittata Rivière & C. Rivière, B. beecheyana Munro, Dendrocalamus giganteus Wallich ex Munro, D. asper (Schult. & Schult. F.) Backer ex k. Heyne, Phyllostachys edulis (Carrière) J. Houz., P. heterocycla (Carrière) Mitford., Guadua amplexifolia J. Presl and G. superba Huber. Four samples of Guadua unidentified at the species level were also collected from a National Forest Reserve from Acre, North Brazil, and fingerprinted to assess their relationships with the other taxa. Culms of each species were collected on their locations, sectioned and placed on pots with soil in a greenhouse. Three leaf samples were collected for each species and DNA extractions were performed for each one separately.
2.2 DNA extraction
DNA extraction was carried out according to Doyle (1990), with modifications. Approximately 50 mg of leaf powder was homogenized in 700 µL of extraction buffer (2% CTAB, 1.4 M NaCl, 20 mM EDTA, 1% PVP) and maintained in microtubes at 60 °C for 30 min. Then, 650 µL of chloroform: isoamyl alcohol (24:1) was added to each sample. After centrifugation at 12 000 g, the supernatant of each sample was transferred to a new microtube and the same volume of chloroform: isoamyl alcohol (24:1) was added. This step was once more repeated. The DNA contained in the supernatant was precipitated in one volume of isopropanol (1:1) and washed in ethanol 70% and 95% for salt removal. Pellets were air-dried and suspended in Tris-RNAse (Tris HCl pH 8.0 and RNAse 10 µg mL–1) solution and incubated 30 min at 37 °C. DNA concentration was estimated with the spectrophotometer Nanodrop 2000 (Thermo ScientificTM) and sample quality was evaluated with 1% agarose gel stained with ethidium bromide.
2.3 RAPD
RAPD reactions were prepared with 20 ng of template, 1 X PCR reaction buffer (200 mM Tris-HCl pH 8.4, 500 mM KCl), 1.6 mM MgCl2, 0.12 mM dNTP, 0.16 µm of each primer (Table 1), 1 U of Taq DNA polymerase (InvitrogenTM) and were completed to 25 µL with sterilized pure water (Milli-Q). PCR was performed as follows: initial denaturation at 94 °C, 40 cycles of 94 °C for 1 min, 37 °C for 1 min and 72 °C for 2 min; and final extension at 72 °C for 7 min. RAPD products were separated on agarose gel 1.5% stained with ethidium bromide (10 mg mL–1) and visualized in UV Transilluminator (Molecular Imaging, Locus Biotechnology). RAPD fragments were scored as presence/absence of bands. A binary matrix (1 and 0) was generated for further genetic analyses. Only bands with strong intensity in the gel were considered for further analyses.
| Table 1. RAPD primers used for fingerprinting bamboo species from a Brazilian collection. | |
| Identification | Sequence |
| OPC-20 | 5’-ACTTCGCCAC-3’ |
| OPV-17 | 5’-ACCGGCTTGT-3’ |
| OPG-17 | 5’-ACGACCGACA-3’ |
| OPAN-03 | 5’-AGCCAGGCTG-3’ |
| OPB-10 | 5’-CTGCTGGGAC-3’ |
| OPAW-20 | 5’-TGTCCTAGCC-3’ |
| OPAW-08 | 5’-CTGTCTGTGG-3’ |
| OPJ-01 | 5’-CCCGGCATAA-3’ |
| OPJ-15 | 5’-TGTAGCAGGG-3’ |
| OPJ-04 | 5’-CCGAACACGG-3’ |
| OPI-15 | 5’-TCATCCGAGG-3’ |
| OPL-04 | 5’-GACTGCACAC-3’ |
2.4 RAPD-RFLP
The RAPD products from the primer OPV17, which presented considerable number of bands with clear resolution, were used for the analysis. The RAPD products were used to perform digestions with different restriction enzyme combinations (double digestion with HindIII/HaeIII and HinfI/RsaI; and single digestion with MspI). Digestions were performed with 5µL of PCR product, 5 U of each enzyme and 1 µL of 10x Thermo Scientific Tango Buffer (33 mM Tris-acetate pH 7.9, 10 mM magnesium acetate, 66 mM potassium acetate, 0.1 mg mL–1 BSA).
The digestions were performed for two hours at 37 °C. For enzyme deactivation, temperatures were raised to 70 °C for 15 min. Digestion products were separated on 6% polyacrylamide gel and visualized by silver staining, following similar procedure as Creste et al. (2001). The derived RFLP fragments were scored as presence/absence of fragments and a binary matrix was generated for the statistical analysis. We performed manual scoring of the bands, considering only those with clear visual identification and with strong intensity.
2.5 Statistics
From the binary matrices, we determined the total number of bands per primer and the number of unique bands (band appearing in only one species) per species and per primer. The polymorphic information content (PIC) of each marker was calculated using the formula PIC = 1 – Ʃpi², in which pi is the frequency of the band i in a total of k bands observed for each primer (Weiler et al. 2010). The genetic relationships among the taxa were assessed based on Jaccard’s similarity indexes and dendrograms were generated using the Unweighted Pair-Group Method with Arithmetic Averages (UPGMA). Clustering consistency was analyzed with a bootstrap test with 1000 replications. Cophenetic correlations were estimated based on the comparison of dissimilarity and cophenetic matrices (Sokal and Rohlf 1961). The genetic relationships of the bamboo taxa were also addressed by a principal coordinate analysis (PCoA), using the two first coordinates to explain the relationships. The analyses were performed for RAPD and RAPD-RFLP separately, as well as for both matrices combined. Softwares DendroUPGMA (Garcia-Vallve et al. 2009) and PAST (Hammer et al. 2001) were used to compute the statistics.
3 Results
3.1 Levels of polymorphism with RAPD markers
The twelve primers used in this work were effective in detecting genetic differences among genera and species. We only analyzed the bands with strong intensity and that could be clearly distinguished. In total, 83 bands were detected from the RAPD analyses (Table 2). Fig. 1 shows the electrophoretic profile of OPV-17. One primer, however, provided a single fragment in all taxa (OPC-20), showing no variation among them. The number of bands detected per marker ranged from 1 (OPC-20) to 12 (OPI-15). The average number of bands per marker obtained (6.91) was reasonably high, considering the RAPD method. Furthermore, the average polymorphic information content per marker showed considerably high levels (PIC = 0.74) (Table 2), reinforcing the potential of such technique in detecting variation at the genus and species levels.
| Table 2. Total number of bands (N), species with unique bands (UB) and number of unique bands detected with RAPD and RAPD-RFLP markers in bamboo species. | ||||||||||||||||
| Marker | N | UB | PIC | Unique bands per species | ||||||||||||
| RAPD | BV | BVV | BB | DG | DA | PE | PH | GA | GS | G1 | G2 | G3 | G4 | |||
| OPC-20 | 1 | 0 | 0.00 | |||||||||||||
| OPV-17 | 5 | 1 | 0.74 | 1 | ||||||||||||
| OPG-17 | 7 | 2 | 0.85 | 1 | 1 | |||||||||||
| OPAN-03 | 7 | 1 | 0.71 | 1 | ||||||||||||
| OPB-10 | 10 | 2 | 0.78 | 1 | 1 | |||||||||||
| OPAW-20 | 9 | 4 | 0.91 | 1 | 1 | 1 | 1 | |||||||||
| OPAW-08 | 5 | 1 | 0.88 | 1 | ||||||||||||
| OPJ-01 | 5 | 3 | 0.94 | 1 | 2 | |||||||||||
| OPJ-15 | 6 | 1 | 0.56 | 1 | ||||||||||||
| OPJ-04 | 7 | 1 | 0.84 | 1 | ||||||||||||
| OPI-15 | 12 | 2 | 0.89 | 1 | 1 | |||||||||||
| OPL-04 | 9 | 1 | 0.81 | 1 | ||||||||||||
| Total | 83 | 19 | 0.74 | 1 | 2 | 4 | 2 | 0 | 1 | 5 | 3 | 0 | 1 | 0 | 0 | 0 |
| RAPD-RFLP | ||||||||||||||||
| MspI | 33 | 9 | 0.86 | 2 | 4 | 1 | 2 | |||||||||
| HindIII/HaeIII | 26 | 14 | 0.94 | 5 | 1 | 2 | 4 | 1 | 1 | |||||||
| HinfI/RsaI | 35 | 11 | 0.93 | 4 | 3 | 3 | 1 | |||||||||
| Total | 94 | 34 | 0.91 | 0 | 2 | 13 | 0 | 2 | 5 | 2 | 4 | 0 | 3 | 1 | 1 | 1 |
| BV – Bambusa vulgaris. BVV – Bambusa vulgaris vittata. BB – Bambusa beecheyana. DG – Dendrocalamus giganteus. DA – Dendrocalamus asper. PE – Phyllostachys edulis. PH – Phyllostachys heterocycla. GA – Guadua amplexifolia. GS – Guadua superba. G1, G2, G3 and G4 – Guadua spp. | ||||||||||||||||
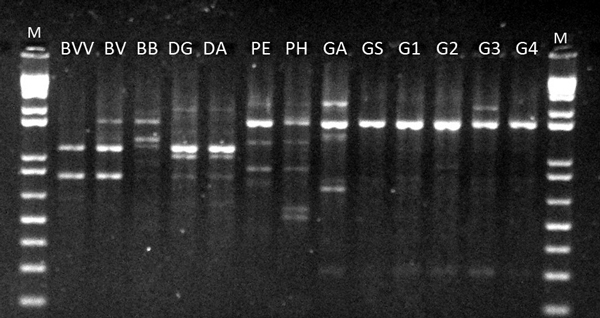
Fig. 1. RAPD profile of OPV-17 for 13 bamboo taxa. BVV – Bambusa vulgaris vittata. BV – Bambusa vulgaris. BB – Bambusa beecheyana. PE – Phyllostachys edulis. PH – Phyllostachys heterocycla. DA – Dendrocalamus asper. DG – Dendrocalamus giganteus. GA – Guadua amplexifolia. GS – Guadua superba. G1, G2, G3 and G4 – Guadua spp. M – 1 Kb Plus Ladder DNA.
The RAPD screening also provided unique bands among species. With the exception of OPC-20, all other markers exhibited unique bands across the whole analysis panel. A single unique band has been detected at OPV-17 and OPL-04, respectively for D. giganteus and P. heterocycla. From five bands detected at OPJ-01, three bands were uniquely encountered in P. heterocycla and G. amplexifolia. B. beecheyana was differentiated from the other species based on four unique bands at four distinct loci (amplified from OPG-17, OPAN-03, OPB-10 and OPJ-15). P. heterocycla was distinguished by five markers, each at a different locus (OPB-10, OPAW-20, OPJ-01, OPI-15, OPL-04). In total, 19 unique bands (22.8% from the total) were distinguished.
3.2 Levels of polymorphism with RAPD-RFLP
The digestion of OPV-17 with the three enzyme combinations (MspI, HindIII/HaeIII and HinfI/RsaI) resulted in a high number of bands, as revealed by acrylamide gels (Fig. 2). In total, 94 bands were distinguished from the gels and used in the statistical analysis (Table 2). Digestion with MspI revealed 33 distinguishable bands, while HindIII/HaeIII and HinfI/RsaI digestions allowed scoring 26 and 35 distinct bands, respectively. The polymorphism revealed by only these three markers (PIC = 0.91) with the digestion of a single primer was higher than the average polymorphism obtained with the RAPD markers (PIC = 0.74) (Table 2).
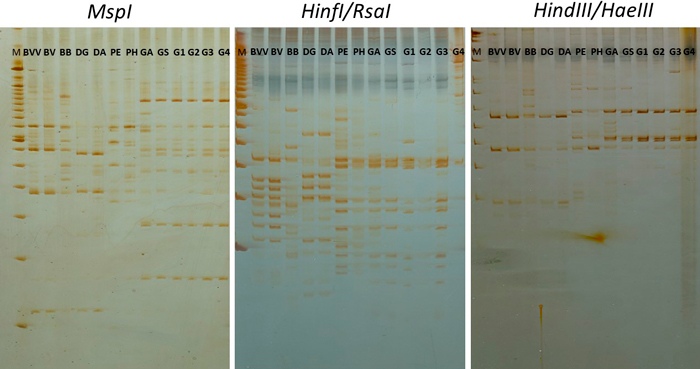
Fig. 2. RAPD-RFLP profile from the digestion of RAPD products from primer OPV17 with three restriction enzyme combinations. BVV – Bambusa vulgaris vittata. BV – Bambusa vulgaris. BB – Bambusa beecheyana. DG – Dendrocalamus giganteus. DA – Dendrocalamus asper. PE – Phyllostachys edulis. PH – Phyllostachys heterocycla. GA – Guadua amplexifolia. GS – Guadua superba. G1, G2, G3 and G4 – Guadua spp. M – 100 bp marker (Ladder).
Moreover, bands were detected from the RAPD-RFLP profiles. In total, 34 unique bands were identified as unique among the taxa with the three enzyme combinations, approximately 79% higher than with the 12 RAPD primers. In average, around 11 unique bands were detected per enzyme combination. Interestingly, B. beecheyana was distinguished from the other taxa with 13 unique bands from the total of the three digestions, representing more than 38% of the total number of unique bands.
With the increased representation provided by RFLP, unique bands were also detected within the genus Guadua. While with the whole set of RAPD markers it was possible to identify four unique bands, it raised to 10 bands with RFLP markers, showing higher discriminatory power of this method.
3.3 Genetic relationships among the bamboo taxa
The RAPD screening was able to differentiate each genus in different groups, based on the clustering analysis with Jaccard’s similarity index through the UPGMA approach (Fig. 3a). The bootstrap resampling analysis strengthened the clustering reliability. The Guadua genus was separated as a group with a bootstrap value of 89%. Phyllostachys, Dendrocalamus and Bambusa were grouped with a low bootstrap (42%), but when each genus was considered as a separate group, the bootstrap values were of at least 83% for Bambusa, and then 92% for Phyllostachys and 100% for Dendrocalamus. Each genus was then considered as a separate group. As a high cophenetic correlation was detected from the clustering analysis (r = 0.972), each species could actually be considered as a separate group, demonstrating that RAPD markers were able to reliably distinguish the bamboo taxa.
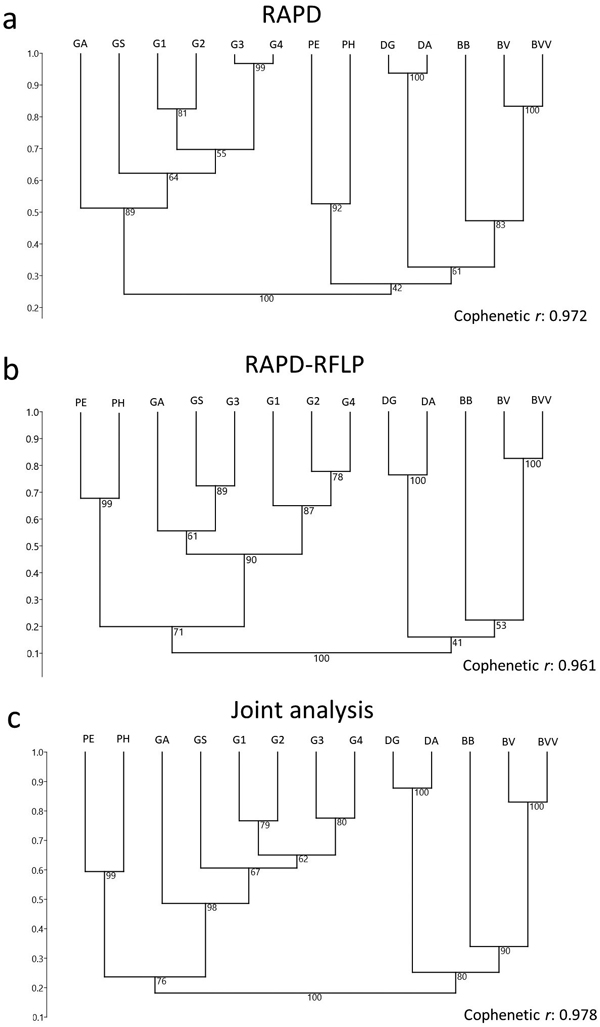
Fig. 3. Dendrogram of 13 bamboo taxa based on (a) RAPD and (b) RAPD-RFLP markers, and the (c) joint analysis. BVV – Bambusa vulgaris vittata. BV – Bambusa vulgaris. BB – Bambusa beecheyana. PE – Phyllostachys edulis. PH – Phyllostachys heterocycla. DA – Dendrocalamus asper. DG – Dendrocalamus giganteus. GA – Guadua amplexifolia. GS – Guadua superba. G1, G2, G3 and G4 – Guadua spp.
Similar results were obtained with RAPD-RFLP, except for certain distinctions between the dendrograms. In case of the RAPD-RFLP clustering, Phyllostachys was no longer included within the same group that Bambusa and Dendrocalamus (Fig. 3b). Conversely, a considerably high bootstrap value (71%) matched Phyllostachys and Guadua within the same subgroup (Fig. 3b). As the cophenetic correlation coefficient was similarly high (r = 0.961) as it was for RAPD, each species could be fitted in separate subgroups. In comparison to RAPD, higher bootstrap values matched three genera subgroups, ranging from 90% (Guadua) to 100% (Dendrocalamus). However, B. beecheyana was matched with a low bootstrap value (53%) to the other members of Bambusa. A joint analysis of RAPD and RFLP data, in general, revealed similar clustering to the one provided by only RAPD-RFLP (Figs. 3b–c).
The four Guadua taxa with no identification to the species level revealed different clustering results from the two techniques. From the RAPD analysis, the most similar taxa were two of Guadua unidentified at the species level, exhibiting 97% of similarity (Table 3, Fig. 3a). Taxa 1 and 2 were defined in a different subgroup, according to the cophenetic correlation, and with similarity of 83%. Alternatively, with the RFLP data, taxa 1, 2 and 4 were more similar (Table 4, Fig. 3b), while taxon 3 fitted the same group as G. amplexifolia and G. superba. With the joint analysis of RAPD and RFLP data, a similar grouping than the one provided by the RAPD data was showed (Fig. 3c).
| Table 3. Jaccard’s similarity coefficient among 13 bamboo taxa, based on 83 RAPD markers. | |||||||||||||
| BV | BVV | BB | DG | DA | PE | PH | GA | GS | G1 | G2 | G3 | G4 | |
| BV | 0.833 | 0.486 | 0.304 | 0.318 | 0.325 | 0.271 | 0.212 | 0.204 | 0.245 | 0.235 | 0.18 | 0.184 | |
| BVV | 0.459 | 0.283 | 0.295 | 0.3 | 0.25 | 0.216 | 0.184 | 0.226 | 0.216 | 0.184 | 0.188 | ||
| BB | 0.372 | 0.39 | 0.3 | 0.304 | 0.265 | 0.234 | 0.226 | 0.216 | 0.208 | 0.213 | |||
| DG | 0.938 | 0.213 | 0.275 | 0.264 | 0.286 | 0.296 | 0.264 | 0.212 | 0.216 | ||||
| DA | 0.222 | 0.286 | 0.275 | 0.298 | 0.308 | 0.275 | 0.22 | 0.224 | |||||
| PE | 0.526 | 0.333 | 0.244 | 0.189 | 0.2 | 0.217 | 0.222 | ||||||
| PH | 0.447 | 0.28 | 0.268 | 0.259 | 0.255 | 0.26 | |||||||
| GA | 0.61 | 0.521 | 0.489 | 0.467 | 0.477 | ||||||||
| GS | 0.683 | 0.692 | 0.55 | 0.564 | |||||||||
| G1 | 0.825 | 0.683 | 0.659 | ||||||||||
| G2 | 0.737 | 0.711 | |||||||||||
| G3 | 0.968 | ||||||||||||
| BV – Bambusa vulgaris. BVV – Bambusa vulgaris vittata. BB – Bambusa beecheyana. DG – Dendrocalamus giganteus. DA – Dendrocalamus asper. PE – Phyllostachys edulis. PH – Phyllostachys heterocycla. GA – Guadua amplexifolia. GS – Guadua superba. G1, G2, G3 and G4 – Guadua spp. | |||||||||||||
| Table 4. Jaccard’s similarity coefficient among 13 bamboo taxa, based on 94 RAPD-RFLP markers. | |||||||||||||
| BBV | BV | BB | DG | DA | PE | PH | GA | GS | G1 | G2 | G3 | G4 | |
| BBV | 0.826 | 0.209 | 0.172 | 0.188 | 0.114 | 0.154 | 0.106 | 0.098 | 0.086 | 0.121 | 0.093 | 0.121 | |
| BV | 0.238 | 0.172 | 0.188 | 0.14 | 0.154 | 0.13 | 0.098 | 0.086 | 0.121 | 0.119 | 0.121 | ||
| BB | 0.1 | 0.143 | 0.157 | 0.146 | 0.192 | 0.196 | 0.116 | 0.146 | 0.213 | 0.146 | |||
| DG | 0.765 | 0.025 | 0.028 | 0.023 | 0.057 | 0 | 0.036 | 0.054 | 0.036 | ||||
| DA | 0.047 | 0.051 | 0.067 | 0.108 | 0.062 | 0.1 | 0.103 | 0.1 | |||||
| PE | 0.677 | 0.311 | 0.3 | 0.098 | 0.128 | 0.227 | 0.1 | ||||||
| PH | 0.341 | 0.333 | 0.108 | 0.111 | 0.22 | 0.111 | |||||||
| GA | 0.571 | 0.371 | 0.382 | 0.541 | 0.382 | ||||||||
| GS | 0.519 | 0.538 | 0.724 | 0.538 | |||||||||
| G1 | 0.65 | 0.433 | 0.65 | ||||||||||
| G2 | 0.5 | 0.778 | |||||||||||
| G3 | 0.556 | ||||||||||||
| BVV – Bambusa vulgaris vittata. BV – Bambusa vulgaris. BB – Bambusa beecheyana. DG – Dendrocalamus giganteus. DA – Dendrocalamus asper. PE – Phyllostachys edulis. PH – Phyllostachys heterocycla. GA – Guadua amplexifolia. GS – Guadua superba. G1, G2, G3 and G4 – Guadua spp. | |||||||||||||
Another approach used to address the genetic relationships among the 13 bamboo taxa was a principal coordinate analysis (PCoA), which is based on the genetic distances among each species (Figs. 4a–c). In general, RAPD, RAPD-RFLP and the joint analysis revealed similar dispersion of the taxa across the graphs. The first two coordinates were able to explain more than 50% of the genetic variation among the bamboo species. One important highlight, however, was that the genus Guadua was more distinguished from the other genera from the PCoA graphs than with the dendrograms. The distinction among the taxa within the Guadua subgroup, however, presented variable profiles, as also revealed from the UPGMA clustering.
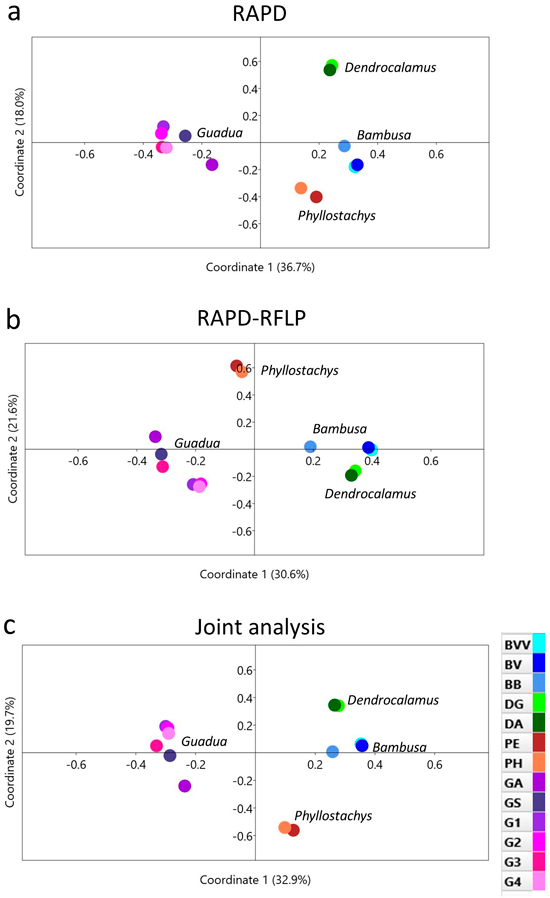
Fig. 4. Principal coordinate analysis of 13 bamboo taxa based on (a) RAPD, (b) RAPD-RFLP and (c) the joint analysis. BVV – Bambusa vulgaris vittata. BV – Bambusa vulgaris. BB – Bambusa beecheyana. DG – Dendrocalamus giganteus. DA – Dendrocalamus asper. PE – Phyllostachys edulis. PH – Phyllostachys heterocycla. GA – Guadua amplexifolia. GS – Guadua superba. G1, G2, G3 and G4 – Guadua spp.
4 Discussion
We were able to discriminate 13 bamboo taxa based on RAPD and RAPD-RFLP methods. Both methods allowed the distinction among genera and species, with similar resolution. However, our results revealed higher number of markers with the digestion of the fragments generated from the amplification of a single RAPD primer with the three enzyme combinations, which has the potential of increasing the discriminatory power among genera and species. One inherent difference of the screening of RAPD and RAPD-RFLP markers, however, was that the RAPD-RFLP markers were run on an acrylamide gel, which enables the detection of higher number of loci, usually with potential of detecting bands with even less than 100 bp with sufficient resolution for distinction.
RAPD markers have been used in studies aimed at the analysis of genetic diversity and divergence among bamboos (Nayak et al. 2003; Lalhruaitluanga and Prasad 2009; Shalini et al. 2013). Despite these markers have been argued about their limitations, such as their dominance, uncertain locus homology and sensitivity to the conditions of the PCR reactions (Yeasmin et al. 2015). In this case, the reproducibility problem might be overcome if the conditions or the reactions are optimized (Scoric et al. 2012). Our reactions were carefully prepared and maintained at homogeneous conditions to perform the RAPD screening. Moreover, the digestion of the RAPD products with the restriction enzymes produced a high number of bands, allowing a reliable estimation of the phylogenetic relationships among the taxa examined. Our results are the first report on the application of RAPD-RFLP markers on the genetic characterization of bamboo species. Previous studies have used classical RFLP markers only, which involved the design of probes, Southern hybridization and autoradiography for revealing molecular markers. In bamboos, an example was the study of Friar and Kockert (1994), dedicated to the genetic diversity and evolutionary analysis of the genus Phyllostachys.
Both methods used in our work revealed similar clustering patterns by the UPGMA method (Fig. 3), as well as by the principal coordinate analysis (PCoA) (Fig. 4). The high cophenetic correlation encountered for RAPD clusters (r = 0.972) and RAPD-RFLP clusters (r = 0.961) reinforced that each taxon might be considered independently, showing the high discriminatory power of the markers. Moreover, two components of the PCoA explained more the half of the genetic divergence observed, and a clear separation among the genera (Bambusa, Dendrocalamus, Phyllostachys and Guadua) is detected from this multivariate approach.
Our work was not aimed at a taxonomic categorization of the species and genera, as a limited set of species and genera were studied. However, some inferences might be described. Considering the clustering among genera (with no regards to the cophenetic correlations), Bambusa and Dendrocalamus were grouped together by both RAPD and RAPD-RFLP methods, as well as the combined analysis of all markers. Species of Bambusa and Dendrocalamus are naturally distributed in Asia. Earlier studies have determined the preferential distribution of bamboos according to climatic zones in India, the second richest country in bamboo species after China (Bystriakova et al. 2003; Yeasmin et al. 2015). Taxonomically, Bambusa and Dendrocalamus both belong to the tribe Bambuseae. These genera are predominant in the dry tropical regions of India, but also occur on temperate and subtropical regions of the country (Ahmed 1996). B. vulgaris occurs in the tropics of Asia. D. asper is distributed in India and southeastern Asia, whereas D. giganteus occurs in southern Myanmar and northern Thailand (Benton 2015). Considering that we sampled only one individual of each species and each genus integrating various species, the groupment between Bambusa and Dendrocalamus was coherent.
The genus Phyllostachys belongs to a different tribe, the Arundinarieae. In general, species of Phyllostachys are native to China and Japan (Benton 2015). In our analysis, the clustering between Phyllostachys and the other genera was different between RAPD and RAPD-RFLP markers. With the former class of markers, Phyllostachys was grouped with Bambusa and Dendrocalamus (Fig. 3a), whereas with the latter Phyllostachys was clustered with Guadua. The genus Guadua is predominantly Neotropical. Therefore, Guadua species occur mainly in Central and South America (Yeasmin et al. 2015). The separation between Guadua and the other genera, considering their natural distribution is then reasonably expected.
To confirm aforementioned clustering results and, more importantly, to further understand the conflicting results of the position of Phyllostachys in the groups from each marker (Fig. 3), our results might be compared with a wider investigation of the phylogenetic relationships among bamboos based on five plastid markers performed by Kelchner et al. (2013). In the study, 33 bamboo species were phylogenetically resolved from a total of 6.7 kb sequence-data of coding and non-coding regions of chloroplast genomes, enabling the categorization of bamboos in four major lineages: Paleotropical Woody, Neotropical Woody, Temperate Woody and Herbaceous. Among those, the genus Guadua was placed within Neotropical Woody bamboos, while Bambusa was within the Paleotropical Woody clade. By extension of this interpretation, Dendrocalamus, which was not analyzed by Kelchner et al. (2013), belongs to the same tribe as Bambusa, which supports the results obtained in this study, showing higher similarity between Dendrocalamus and Bambusa than with the other genera (Fig. 3). Moreover, the Phyllostachys member analyzed by Kelchner et al. (2013) along with other species of the tribe Arundinaceae were placed within the Temperate Woody clade, which was phylogenetically more distant than between Paleotropical Woody and Neotropical Woody clades. It might explain the lack of consistency of the positioning of Phyllostachys in our study, as with only RAPD markers (Fig. 3a) it was placed within the same group of Dendrocalamus and Bambusa. Conversely, with RAPD-RFLP (Fig. 3b) and the joint analysis (Fig. 3c), the Phyllostachys group was placed alongside with the Guadua group. Probably, the inclusion of more taxa would provide better resolution for this clustering result, which is beyond the main purpose of our work.
As the first analysis involving RAPD-RFLP analysis in bamboos, we were able to demonstrate its applicability for studies aimed at the genetic characterization of genera and species of bamboo with such as low-cost and fast-screening method. We recommend the use of RAPD-RFLP method for further investigations of genetic diversity within species collections, such as accessions of different locations. Genetic analyses that have no requirement of sequencing technologies might be efficiently conducted with the employment of RAPD-RFLP markers or other PCR-RFLP strategies. The wide diversity among and within species has to be better understood to aid information for breeding and conservation programs of bamboos.
Acknowledgements
We thank the Bamboo Active Germplam Bank (AGB) at the Development and Research Station (UPD/DDD/APTA/SAA), Tatuí, São Paulo State, Brazil, for making the genetic materials available for our research. We also thank CNPq (National Council for Scientific and Technological Development, Brazil) and CAPES (Coordination for the Improvement of Higher Level Personnel, Brazil) for their financial support.
References
Ahmed M.F. (1996). In: Keynote address: proceedings of the National seminar on bamboo, Bangalore, 28–29 Nov. 1996. Bamboo society of India, Bangalore. p. 6–8.
Benton A. (2015). Priority Species of Bamboo. In: Liese W., Köhl M. (eds.). Bamboo. Springer International Publishing. p. 31–41. https://doi.org/10.1007/978-3-319-14133-6_2.
Biswas K., Biswas R. (2013). Identification of medicinal plants using PCR-RFLP in Dasamula – an Ayurvedic drug. Journal of Pharmaceutical and BioSciences 3: 93–98.
Bonilla S.H., Guarnetti R.L, Almeida C.M., Giannetti B.F. (2010). Sustainability assessment of a giant bamboo plantation in Brazil: exploring the influence of labour, time and space. Journal of Cleaner Production 18(1): 83–91. https://doi.org/10.1016/j.jclepro.2009.07.012.
Bystriakova N., Kapos V., Lysenko I., Stapleton C. (2003). Distribution and conservation status of forest bamboo biodiversity in the Asia‐Pacific region. Biodiversity and Conservation 12(9): 1833–1841. https://doi.org/10.1023/A:1024139813651.
Creste S., Neto A.T., Figueira A. (2001). Detection of single sequence repeat polymorphisms in denaturing polyacrylamide sequencing gels by silver staining. Plant Molecular Biology Reporter 19(4): 299–306. https://doi.org/10.1007/BF02772828.
Das M., Bhattacharya S., Pal A. (2005). Generation and characterization of SCARs by cloning and sequencing of RAPD products: a strategy for species-specific marker development in bamboo. Annals of Botany 95(5): 835–841. https://doi.org/10.1093/aob/mci088.
Das M., Bhattacharya S., Basak J., Pal A. (2007). Phylogenetic relationships among the bamboo species as revealed by morphological characters and polymorphism analyses. Biologia Plantarum 51(4): 667–672. https://doi.org/10.1007/s10535-007-0140-7.
DeVerno L.L., Mosseler A. (1997). Genetic variation in red pine (Pinus resinosa) revealed by RAPD and RAPD-RFLP analysis. Canadian Journal of Forest Research 27(8): 1316–1320. https://doi.org/10.1139/x97-090.
Doyle J.J. (1990). Isolation of plant DNA from fresh tissue. Focus 12: 13–15.
Friar E., Kochert G. (1994). A study of genetic variation and evolution of Phyllostachys (Bambusoideae: Poaceae) using nuclear restriction fragment length polymorphisms. Theoretical and Applied Genetics 89(2–3): 265–270. https://doi.org/10.1007/BF00225152.
Garcia-Vallve S., Puigbo P. (2009). DendroUPGMA: a dendrogram construction utility. Universitat Rovira i Virgili, Tarragona, Spain.
Generoso A.L., Santos J.O., Carvalho V.S., Sacoman N.N., Rodrigues R. (2016). Proposal for qualitative and quantitative descriptors to characterise bamboo germplasm. Revista Ciência Agronômica 47(1): 47–55. https://doi.org/10.5935/1806-6690.20160006.
Ghavami K. (2005). Bamboo as reinforcement in structural concrete elements. Cement and Concrete Composites 27(6): 637–649. https://doi.org/10.1016/j.cemconcomp.2004.06.002.
Hammer Ø., Harper D.A.T., Ryan P.D. (2001). PAST: Paleontological Statistics Software Package for education and data analysis. Palaeontolia Electronica 4.
Hamzah T.N.T., Hakeem K.R., Ibrahim F.H. (2016). Proteomics of bamboo, the fast-growing grass. In: Hakeem K.R., Tombuloğlu H., Tombuloğlu G. (eds.). Plant omics: trends and applications. Springer International Publishing. p. 327–349. https://doi.org/10.1007/978-3-319-31703-8_13.
Ho C.L., Lin C.Y., Ka S.M., Chen A., Tasi Y.L., Liu M.L., Chiu Y.C., Hua K.F. (2013). Bamboo vinegar decreases inflammatory mediator expression and NLRP3 inflammasome activation by inhibiting reactive oxygen species generation and protein kinase C-α/δ activation. PloS One 8(10): e75738. https://doi.org/10.1371/journal.pone.0075738.
Isagi Y., Shimada K., Kushima H., Tanaka N., Nagao A., Ishikawa T., OnoDera H., Watanabe S. (2004). Clonal structure and flowering traits of a bamboo [Phyllostachys pubescens (Mazel) Ohwi] stand grown from a simultaneous flowering as revealed by AFLP analysis. Molecular Ecology 13: 2017–2021. https://doi.org/10.1111/j.1365-294X.2004.02197.x.
Kelchner S.A., Group B.P. (2013). Higher level phylogenetic relationships within the bamboos (Poaceae: Bambusoideae) based on five plastid markers. Molecular Phylogenetics and Evolution 67(2): 404–413. https://doi.org/10.1016/j.ympev.2013.02.005.
Lalhruaitluanga H., Prasad M.N.V. (2009). Comparative results of RAPD and ISSR markers for genetic diversity assessment in Melocanna baccifera Roxb. growing in Mizoram State of India. African Journal of Biotechnology 8(22): 6053–6062. https://doi.org/10.5897/AJB09.047.
Lencina K.H., Konzen E.R., Tsai S.M., Bisognin D.A. (2016). Genetic analysis of Apuleia leiocarpa as revealed by random amplified polymorphic DNA markers: prospects for population genetic studies. Genetics and molecular research 15(4): gmr15049058. https://doi.org/10.4238/gmr15049058.
Li X., Sun C., Zhou B., He Y. (2015). Determination of hemicellulose, cellulose and lignin in Moso bamboo by near infrared spectroscopy. Scientific Reports 5(17210). 11p.
Lin X.C., Lou Y.F., Liu J., Peng J.S., Liao G.L., Fang W. (2010). Crossbreeding of Phyllostachys species (Poaceae) and identification of their hybrids using ISSR markers. Genetics and Molecular Research 9(3): 1398–1404. https://doi.org/10.4238/vol9-3gmr855.
Loh J.P., Kiew R., Set O., Gan L.H., Gan Y.Y. (2000). A study of genetic variation and relationships within the bamboo subtribe Bambusinae using amplified fragment length polymorphism. Annals of Botany 85(5): 607–612. https://doi.org/10.1006/anbo.2000.1109.
Mukherjee A.K., Ratha S., Dhar S., Debata A.K., Acharya P.K., Mandal S., Panda P.C., Mahapatra A.K. (2010). Genetic relationships among 22 taxa of bamboo revealed by ISSR and EST-based random primers. Biochemical Genetics 48(11–12): 1015–1025. https://doi.org/10.1007/s10528-010-9390-8.
Nag A., Gupta P., Sharma V., Sood A., Ahuja P.S., Sharma R.K. (2013). AFLP and RAPD based genetic diversity assessment of industrially important reed bamboo (Ochlandra travancorica Benth). Journal of Plant Biochemistry and Biotechnology 22(1): 144–149. https://doi.org/10.1007/s13562-012-0114-5.
Nayak S., Rout G.R., Das P. (2003). Evaluation of the genetic variability in bamboo using RAPD markers. Plant Soil and Environment 49: 24–28.
Panizzo C.C., Fernández P.V., Colombatto D., Ciancia M., Vega A.S. (2016). Anatomy, nutritional value and cell wall chemical analysis of foliage leaves of Guadua chacoensis (Poaceae, Bambusoideae, Bambuseae), a promising source of forage. Journal of the Science of Food and Agriculture 97(4): 1349–1358. https://doi.org/10.1002/jsfa.7873.
Schlögl P.S., Souza A.P.D., Nodari R.O. (2007). PCR-RFLP analysis of non-coding regions of cpDNA in Araucaria angustifolia (Bert.) O. Kuntze. Genetics and Molecular Biology 30(2): 423–427. https://doi.org/10.1590/S1415-47572007000300020.
Shalini A., Meena R.K., Tarafdar S., Thakur S. (2013). Evaluation of genetic diversity in bamboo through DNA marker and study of association with morphological traits. Bulletin of Environment, Pharmacology and Life Sciences 2: 78–83.
Skorić M., Šiler B., Banjanac T., Živković J.N., Dmitrović S., Mišić D., Grubišić D. (2012). The reproducibility of RAPD profiles: effects of PCR components on RAPD analysis of four Centaurium species. Archives of Biological Sciences 64(1): 191–199. https://doi.org/10.2298/ABS1201191S.
Sokal R.R., Rohlf F.J. (1962). The comparison of dendrograms by objective methods. Taxon 11(2): 33–40. https://doi.org/10.2307/1217208.
Van der Lugt P., Van den Dobbelsteen A.A.J.F., Janssen J.J.A. (2006). An environmental, economic and practical assessment of bamboo as a building material for supporting structures. Construction and Building Materials 20(9): 648–656. https://doi.org/10.1016/j.conbuildmat.2005.02.023.
Vogtländer J., Van der Lugt P., Brezet H. (2010). The sustainability of bamboo products for local and Western European applications. LCAs and land-use. Journal of Cleaner Production 18(13): 1260–1269. https://doi.org/10.1016/j.jclepro.2010.04.015.
Waikhom S.D., Ghosh S., Talukdar N.C., Mandi S.S. (2012). Assessment of genetic diversity of landraces of Dendrocalamus hamiltonii using AFLP markers and association with biochemical traits. Genetics and Molecular Research 11(3): 2107–2121. https://doi.org/10.4238/2012.June.21.1.
Weiler R.L., Brugnara E.C., Schwarz S.F., Bastianel M., Machado M.A., Schifino-Wittmann M.T. (2010). Caracterização molecular de uma progênie de tangerineira ‘Clementina Fina’e ‘Montenegrina’. Ciência Rural 40(7): 1523–1529. https://doi.org/10.1590/S0103-84782010005000104.
Williams J.G.K., Kubelik A.R., Livak K.J., Rafalski J.A., Tingey S.V. (1990). DNA polymorphisms amplified by arbitrary primers are useful as genetic markers. Nucleic Acids Research 18(22): 6531–6535. https://doi.org/10.1093/nar/18.22.6531.
Yeasmin L., Ali M.N., Gantait S., Chakraborty S. (2015). Bamboo: an overview on its genetic diversity and characterization. 3 Biotech 5(1): 1–11. https://doi.org/10.1007/s13205-014-0201-5.
Yu Y., Wen H., Ma J., Lykkemark S., Xu H., Qin J. (2014). Flexible fabrication of biomimetic bamboo‐like hybrid microfibers. Advanced Materials 26: 2494–2499. https://doi.org/10.1002/adma.201304974.
Xia T., Gao X., Wang C., Xu X., Zhu L. (2016). An enhanced anaerobic membrane bioreactor treating bamboo industry wastewater by bamboo charcoal addition: performance and microbial community analysis. Bioresource Technology 220: 26–33. https://doi.org/10.1016/j.biortech.2016.08.057.
Xiong S., Zhang S., Wu Q., Guo X., Dong A., Chen C. (2014). Investigation on cotton stalk and bamboo sawdust carbonization for barbecue charcoal preparation. Bioresource Technology 152: 86–92. https://doi.org/10.1016/j.biortech.2013.11.005.
Total of 40 references.
