Liam Donnelly  ,
Olga M. Grant,
Conor O’Reilly
,
Olga M. Grant,
Conor O’Reilly
Effect of deployment-type on stem growth, biomass partitioning and crown characteristics of juvenile Sitka spruce clones
Donnelly L., Grant O. M., O’Reilly C. (2017). Effect of deployment-type on stem growth, biomass partitioning and crown characteristics of juvenile Sitka spruce clones. Silva Fennica vol. 51 no. 1 article id 1714. https://doi.org/10.14214/sf.1714
Highlights
- Deployment x clone interactions reduced tree height and diameter growth in mixed plots for one clone
- Height and diameter heterogeneity was significantly greater in mixed plots
- Deployment-type significantly altered relationships between crown variables and competition was more asymmetric in mixed plots compared to monoclonal.
Abstract
Competitive interactions in clonal forestry are not well understood and this needs to be addressed to develop better deployment strategies. Eight juvenile Sitka spruce (Picea sitchensis (Bong.) Carriére) clones were grown in monoclonal and clonal mixtures in a field experiment for three years to assess the effects of genetic diversity on shoot growth, above- and below-ground biomass partitioning and crown characteristics. Shoot elongation was measured throughout the growing season, while diameter was measured twice annually in May and December. After the third year, crown silhouette area was estimated from digitised images for one ramet per plot and ramets were then destructively harvested. Deployment × clone interactions were observed for tree height and diameter with reductions observed in mixed plots. Mixed plots had significantly greater height and diameter heterogeneity and more asymmetrical competition than monoclonal plots. Results from this study demonstrate that stem growth can be significantly altered when clones are planted in multi-clonal mixtures but for most clones, deployment-type will not significantly reduce their productivity.
Keywords
productivity;
Picea sitchensis;
biomass partitioning;
clones;
deployment-type
-
Donnelly,
UCD Forestry, University College Dublin, Belfield, Dublin 4, Ireland
E-mail
liam.donnelly@ucdconnect.ie
- Grant, UCD Forestry, University College Dublin, Belfield, Dublin 4, Ireland E-mail olga.grant@ucd.ie
- O’Reilly, UCD Forestry, University College Dublin, Belfield, Dublin 4, Ireland E-mail conor.oreilly@ucd.ie
Received 6 October 2016 Accepted 12 January 2017 Published 31 January 2017
Views 140818
Available at https://doi.org/10.14214/sf.1714 | Download PDF

1 Introduction
Sitka spruce (Picea sitchensis (Bong.) Carrière) is the main commercial forest species throughout Britain and Ireland, 25% and 52% respectively, and a minor species of commercial value in Denmark and France (Treacy et al. 2000; Lee et al. 2013). In Britain and Ireland, improvement programmes have been initiated mostly to increase productivity or wood quality (Gill 1987; Lee et al. 2013; Thompson 2013; Cameron 2015). Recent advances in alternative propagation techniques, such as somatic embryogenesis (SE), allow wide-scale use of specific clones which may further improve forest productivity for Sitka spruce compared to conventional tree breeding and propagation techniques (Park 2002; Hartmann et al. 2011 ).
Clonal forestry offers the ability to select individuals based on their inherent genetic traits or ideotype, choosing or excluding specific clones to create a desired stand environment (Park 2002). However, there remain some technical and management difficulties and uncertainties with the deployment of clonal trees, limiting the benefits of clonal forestry. The central question concerning clonal forestry is how deployment-type affects tree performance. Clones may be deployed in two main deployment-types, i.e. multi-clonal mixtures (a stand composed of several clones intimately mixed) or monoclonal clonal plots (a stand composed of one clone) (Sharma et al. 2008a; Gould et al. 2011). Previous studies have outlined the advantages of either deployment-type (Libby 1987; DeBell and Harrington 1993).
Clonal tests typically focus on identifying superior individuals using single-tree plots with little regard for the potential effect of competition (Gould et al. 2011). However, deployment-type and genetic differences between neighbours influence the competitive environment and differing biomass partitioning strategies and phenology could affect stand productivity. For example, clones which have later budbreak or relatively short growth seasons could be at a competitive disadvantage in mixed stands (Michael et al. 1988)
The competition process within a stand can be seperated into environmental and genetic effects and their interactions (Foster et al. 1998). Previous studies have generally assessed these effects using trees grown from seed complicating the separation of genetic effects from environmental effects (Brassard et al. 2011; Domisch et al. 2015). However using clonal material these effects can be more readily separated and increases the ability to exploit genotype × environment interactions than family forestry (Aspelmeier and Leuschner 2006).
Environmental effects of competition can be increased through higher planting density, encouraging a rapid onset of competition, providing insights into how individuals perform under competitive pressures. Close spacing can make early selection more effective (Franklin 1979). Previously, authors used different distances to encourage competitive interactions, e.g. 30, 60 and 90 cm (Campbell et al. 1986) and 1, 3, 5, and 7 inches (Campbell and Wilson 1973).
Genetic diversity is an important driver in individual and community level processes and can influence stand productivity (Lankau and Strauss 2007). Thus, by manipulating the genetic composition of a stand, the effect of inter- and intra-clonal competition can be determined and the effect of increasing or decreasing genetic diversity on stand productivity can be compared. Increased genetic diversity decreases competition for the same resources, affecting site and stand productivity (Boyden et al. 2008). Selecting clones with divergent resource acquisition and biomass partitioning strategies may reduce niche overlap and competition while increasing resource-use and site utilisation efficiency (Mason et al. 2012). However, when neighbouring plants are closely related or from the same clone, competition may be reduced due to kin selection, resulting in significantly lower production than in a stand composed of different clones (Boyden et al. 2008; Lepik et al. 2012) .
To ensure appropriate clonal mixtures are devised, and others avoided, it is important to determine how intergenotypic competitive interactions affect performance in traits of interest (Staudhammer et al. 2009). Certain mixtures of clones or specific planting combinations (i.e. mixed mosaics of clonal blocks or row plots) could result in postitive, negative or neutral effects on productivity (Adams et al. 1973). To date, the effect of deployment-type on clonal performance of conifer and broadleaf species remains poorly understood and consistent relationships between productivity and deployment-type have not been found between either clones (Sharma et al. 2008a) or seedlings (Gould et al. 2011). Thus, further studies are required to make firm conclusions and recommendations.
Previous studies have focused primarily on short rotation species, particularly Populus and Salix spp. and in general contradicting results have been reported. Higher volume, mean height and diameter have been reported for five Populus clones when deployed in clonal mixtures compared to monoclonal plots (Markovic and Herpka 1986). Similarly, Dawson and McCracken (1995) observed higher biomass yields in Salix clones when deployed in clonal mixtures compared to monoclonal plots. However, Benbrahim et al. (2000) found that deployment-type did not affect productivity in Populus clones but observed stem height was more uniform in monoclonal plots than in mixed plots. Furthermore, in the same study, it was observed that juvenile Populus clones that performed well initially were not the best performers over an extended period of time.
Although the majority of experiments conducted on the effect of deployment-type to date have concentrated on broadleaved species, several studies have focused on conifer species. Zhou et al. (1998) observed increased productivity in monoclonal plots of Chinese fir (Cunninghamia lanceolate (Lambert) Hooker) compared to mixed plots, while Sharma et al. (2008b) found no difference in productivity in relation to deployment-type in radiata pine (Pinus radiate D. Don). In contrast, a study using half siblings of Douglas fir (Pseudotsuga menziesii (Mirb.) Franco) observed, on average, increased productivity in mixed in comparison to monoclonal deployments (Clair and Adams 1991). Williams et al. (1983), who examined family differences, found greater stem height growth and stem volume in monoclonal plots of loblolly pine (Pinus taeda L.) compared to mixed plots.
To the authors’ knowledge, no information exists regarding the impact of contrasting deployment-types on productivity of different Sitka spruce clones. This study was established as a closely spaced experiment using eight juvenile Sitka sprue clones in mixed and monoclonal plots to determine if stem growth, above- and below-ground biomass partitioning and crown morphology were influenced by deployment-type.
2 Materials and methods
2.1 Plant material
An experiment with eight elite (numbered 1 to 8) one-year old clones of Sitka spruce was established at the National Tree Improvement Centre, Kilmacurra, Co. Wicklow, Ireland (52°93´N, 06°14´E, 133 m a.s.l.) in April 2013. According to long-term meteorological observations from the on-site weather station (Met Éireann), the mean annual temperature is 9.9 °C with mean annual precipitation of 1178 mm. All eight clones used were from the Irish tree improvement programme and displayed superior stem height growth and were propagated using somatic embryogenesis (Thompson 2013) (Table 1). Several weeks after early-stage somatic embryo structures were evident, plants were transferred into individual plugs with a peat pearlite (2:1) containing 250 g L−1 fertilizer (Osmocote®, Everris International B.V.) and 5 g L−1 insecticide (suSCon Green, Crop Care Australais Proprietary Ltd.). The trees were transferred to a high humidity greenhouse in March to acclimatise for approximately a month and were then moved to polytunnels for approximately two weeks prior to planting.
| Table 1. The number assigned to each Sitka spruce clone planted in the experiment, numbered 1–8. Four clones (1, 3, 5, 8) had common parents, another clone (clone 7) shared a parent with these four clones and clone 2. The remaining two clones (clones 4 and 6) were unrelated to any other clones in this experiment. Clones were propagated using somatic embryogenesis with seeds from controlled crosses of elite parents used in the Irish tree improvement programme. | |
| Clone Number | Cross |
| 1, 3, 5, 8 | 230 × 519 |
| 2 | 377 × 574 |
| 4 | 286 × 542 |
| 6 | 27 × 306 |
| 7 | 377 × 519 |
2.2 Experimental design
The experiment was established in April 2013. The experimental site had been previously used for nursery beds. The soil was uniform throughout and was classified as a sandy loam with approximately 7.3% clay, 14.1% silt, 78.6% sand and 9.2% organic matter. Prior to establishment, the site was ploughed to a depth of approximately 13 cm and treated with glyphosate (Roundup, Monsanto) at a rate of 5 L ha−1. The experiment was designed with two factors, deployment-type and clone, replicated in five blocks. Each block contained a total of 20 ramets per clone planted in ten 60 cm × 50 cm plots: eight monoclonal plots containing only ramets of each clone and two mixed plots containing all clones randomly mixed.
A random assortment of ramets from all clones used in the experiment was planted around the perimeter of each block to create a buffer to reduce edge effects. A secondary buffer, using ramets of the same clone as the measurement clone, was included in each monoclonal plot to exclude any potential competitive influences between plots composed of different clones. Furthermore, only four ramets of each clone in monoclonal plots were used for data analysis to create a balanced design.
All blocks were hand planted at 0.1 m between rows and within rows. Only defect-free ramets within ± 1 SD of the overall population mean were selected.
2.3 Observations and measurements
Over three growing seasons (2013, 2014 and 2015), shoot height was measured monthly and diameter at base was measured twice annually on the central four ramets in each plot. In January 2015, one randomly selected ramet per deployment-type for each clone was destructively sampled (n = 5). Ramets were cut at the base and a soil monolith measuring 0.20 × 0.20 × 0.20 m was excavated from the base of each ramet. Soil monoliths were placed in individual plastic bags containing water for 24 hours to loosen soil particles. Roots were then carefully hand washed to remove moss, soil and stone particles. Roots were then dried at 80 °C for 48 h and weighed (Adam Equipment model PW 124, Adam Equipment, South Africa).
Crown silhouette area (CSA), an index of displayed leaf area, was then calculated for each destructively harvested ramet to determine displayed leaf area using the methodology described in King et al. (2008). Each ramet was photographed twice at right angles perpendicular to the stem (north–south and east–west orientation) with an object of know size included in each photograph against a white background using a Nikon D70s SLR (Nikon Inc., Melville, New York). To enhance contrast between trees and background, exposure values (eV) were set at –1.0 eV (Stovall et al. 2013). Photographs were then analysed using ImageJ (ImageJ, U.S. National Institutes of Health, Bethesda, Maryland, USA).
Photographs were converted from JPEG to binary images and the background removed, leaving only the stem, crown and the object of known size. CSA was calculated by comparison with the object of known area included in each photograph. Values from the two photographs per ramet were averaged giving CSA in units of m2.
Branches, ≥ 1.5 cm in length, were counted and ramets were separated into foliage, branches and stem. Needle length, width and thickness of five randomly selected needles removed from the mid-section of a north orientated branch in the top whorl of each ramet was measured using a digital callipers. Each component was then dried as previously described for the roots.
2.4 Data analysis
To determine if initial height and diameter influenced final height and diameter, an ANCOVA model was fitted using PROC MIXED in SAS 9.3 (2011, SAS Institute Inc., Cary, NC, USA) using initial values as covariates and final values were used as dependants, with clone as the grouping variable. The following model (1) was used to determine relationships:
![]()
where μ is the overall mean of the response of Y; β is the effect of xij on x2ij or the overall slope, xij is initial value of the ith clone; x2ij is the overall mean of the covariate; e is the error term.
To assess if clones differed in growth rates, mean clone values for height and diameter for each growing season were then compared using standard analysis of variance procedures (ANOVA). To determine the effect of deployment-type, clone and deployment × clone interactions on relative height, diameter growth and biomass partitioning during each growing season PROC MIXED was used. The performance of clones were then separated into monoclonal and mixed plots by contrasting the performance of eight clones (7 df), the mixture effect, i.e. monoclonal versus mixed (1 df), and interaction between the clones and the mixture effect (7 df). The analysis of clonal performance in mixtures assumes that each of the clones planted in mixtures be regarded as a single treatment. Where significant differences were observed Student-Newman-Keuls (SNK) post-hoc tests were used to determine which means were significantly different at P ≤ 0.05. This analysis is similar to methods which have previously been used to compare the performance of different species in pure and mixed plots (e.g. Mason and Connolly 2013, 2016) and meets the general conditions, as outlined by Mead et al. (2012). The following model (2) was used:
![]()
where Yijk is mean height or diameter or height CV or diameter CV or biomass of a particular component of ith clone, jth block and kth mode of deployment, μ is overall mean, αi is ith clone, β is jth block, γ is kth mode of deployment, (αγ)ik is the interaction of ith clone and kth mode of deployment and eijk is error.
Additionally, relationships between crown morphology and other traits were also tested to determine if deployment significantly affected them. Linear regression was used to test a variety of morphological measurements to determine relationships between crown and stem traits.
3 Results
3.1 Impact of clone and deployment-type
Stem height, stem diameter, and biomass partitioning across deployment-type and years are presented in Table 2. In general, most significant differences occurred between clones in stem height with fewer differences found in stem diameter. Effects of deployment-type, clone and their interactions on measured variables differed significantly at various stages throughout the experiment but most differences did not remain at the end of the experiment. Detailed results are presented below.
| Table 2. ANOVA summary for sources of variation and P-values with significant differences in 2013, 2014 and 2015. NS = > 0.05, * = < 0.05, ** = < 0.01 and *** = < 0.001. CV = coefficient of variation. | |||
| P-value | |||
| Source of variation | Clone (C) | Deployment (D) | C × D |
| Year – 2013 | |||
| Absolute stem height, May | * | NS | NS |
| Absolute stem diameter, May | NS | NS | NS |
| Absolute stem height (CV), May | NS | * | NS |
| Absolute stem diameter (CV), May | NS | * | NS |
| Relative stem height, July | * | NS | NS |
| Relative height, mid-July | * | NS | NS |
| Relative height, August | ** | NS | NS |
| Relative stem height, September | NS | * | NS |
| Relative stem diameter, December | NS | ** | NS |
| Year – 2014 | |||
| Relative stem height, May | *** | NS | NS |
| Relative stem height, mid-May | *** | *** | NS |
| Relative stem height, June | ** | *** | NS |
| Relative stem height, mid-June | ** | *** | NS |
| Relative stem height, July | NS | ** | NS |
| Relative stem height, mid-July | NS | * | NS |
| Year – 2015 | |||
| Absolute stem height, August | * | * | * |
| Absolute stem diameter, May | * | * | * |
| Absolute stem height (CV), August | NS | * | NS |
| Absolute stem diameter (CV), May | NS | * | NS |
| Branch biomass | * | NS | NS |
| Total above-ground biomass | * | NS | NS |
| Relative stem height, June | NS | NS | * |
3.2 Deployment effect on absolute height and diameter
Initial height or diameter values were not found to significantly influence final values for any clone. In May 2013, clone height varied from 17.6 cm (clone 7) to 23 cm (clone 6) (Table 3). No significant differences in stem height were observed in 2013 between clones or deployment-type.
| Table 3. Absolute stem height (May 2013 and August 2015) and diameter at base (May 2013 and 2015) for eight juvenile Sitka spruce clones planted in monoclonal and mixed plots (n = 5) and mean values for all ramets in each deployment-type (n = 10). Data shown are mean values and corresponding coefficient of variation (CV). Values showing the same letter are not statistically significant (P ≤ 0.05). | |||||
| Clone | Deployment Type | Diameter ’13 (mm) | Diameter ’15 (mm) | Height ’13 (cm) | Height ’15 (cm) |
| 1 | Monoclonal | 3.0b (14a) | 6.1ab (15a) | 19.9a (12a) | 56.5a (15a) |
| Mixed | 2.7bc (13a) | 5.9b (18a) | 20.8a (16a) | 55.3ab (19a) | |
| 2 | Monoclonal | 3.3ab (9a) | 6.5ab (9a) | 20.4a (11a) | 57.2a (9a) |
| Mixed | 3.6a (13a) | 7.1a (12a) | 20.1a (17a) | 51.6abc (13a) | |
| 3 | Monoclonal | 3.2ab (18a) | 6.4ab (9a) | 20.6a (17a) | 55.0ab (9a) |
| Mixed | 3.0b (18a) | 6.4ab (9a) | 18.8a (15a) | 50.9abc (9a) | |
| 4 | Monoclonal | 3.2ab (16a) | 5.8b (11a) | 20.8a (17a) | 47.1bc (11a) |
| Mixed | 2.8bc (16a) | 6.3ab (18a) | 20.6a (18a) | 49.8abc (18a) | |
| 5 | Monoclonal | 2.6c (16a) | 7.0a (10a) | 21.1a (17a) | 51.8ab (16a) |
| Mixed | 2.8c (17a) | 5.9b (11a) | 18.8a (18a) | 43.8c (18a) | |
| 6 | Monoclonal | 3.3ab (15a) | 6.3ab (6a) | 23.0a (12a) | 47.9bc (7a) |
| Mixed | 3.0b (12a) | 6.0ab (12a) | 21.8a (18a) | 49.8abc (16a) | |
| 7 | Monoclonal | 3.1b (14a) | 5.9b (7a) | 19.1a (12a) | 43.1c (7a) |
| Mixed | 2.8bc (17a) | 6.4ab (16a) | 17.6a (17a) | 50.2abc (16a) | |
| 8 | Monoclonal | 2.6c (15a) | 5.7b (11a) | 18.9a (15a) | 49.6abc (12a) |
| Mixed | 2.5c (14a) | 5.8b (11a) | 17.7a (14a) | 45.2bc (11a) | |
| Mean monoclonal values | 3.1a (15b) | 20.5a (15b) | 6.1a (10b) | 50.5a (11b) | |
| Mean mixed values | 2.9a (22a) | 19.7a (19a) | 6.1a (20a) | 49.1a (18a) | |
In May 2013, stem diameter at base ranged from 2.5 mm (clone 8) to 3.6 mm (clone 2) (Table 3). Significant diameter differences were observed between several clones, specifically between clones 5 and 8 and most others in either deployment-type. Differences between deployment-type for height and diameter were observed in CV with significantly greater CV in mixed plots than in monoclonal plots.
Stem height of clone 5 was significantly lower in mixed plots than in monoclonal plots in August 2015 (Table 3). Several other differences were observed between clones in both deployment-types with the largest differences occurred between clone 2 (57.2 cm) in mixed plots and clone 7 (43.1 cm) in monoclonal plots.
Diameter at base of clone 5 was also significantly affected by deployment-type in May 2015. Ramets of this clone had significantly larger diameters in monoclonal plots than mixed plots and had significantly narrower stems than several other clones in either deployment-type with the largest difference occurring with clone 2 (7.1 cm).
Differences between deployment-type persisted until the end of the experiment with significant differences in height and diameter CV recorded in mixed plots than in monoclonal plots.
3.3 Relative height and diameter
The majority of height growth in both deployment-types occurred between May and June in both years, 29 to 44% in 2013 and 17 to 38% in 2014 and height growth had stopped by October (Fig. 1a and b). Mixed plots had significantly lower relative height than monoclonal plots in September 2013 and from mid-May to August 2014. Several clones differed in relative height in July and August 2013 with the most productive clones, clone 1, 2 and 3, having significantly greater relative height than the least productive clone, clone 8. Clone 1 also had significantly greater relative height than clone 5 in August 2013. Clone 3 had significant greater relative height than clone 2 from mid-May to mid-June 2014. Clone 4 had significantly greater relative height than clone 2 in mid-May 2014 only. In June 2015, significant deployment-type × clone interaction was recorded for clones 5 and 8, which had significantly greater relative height in monoclonal plots and mixed plots respectively.
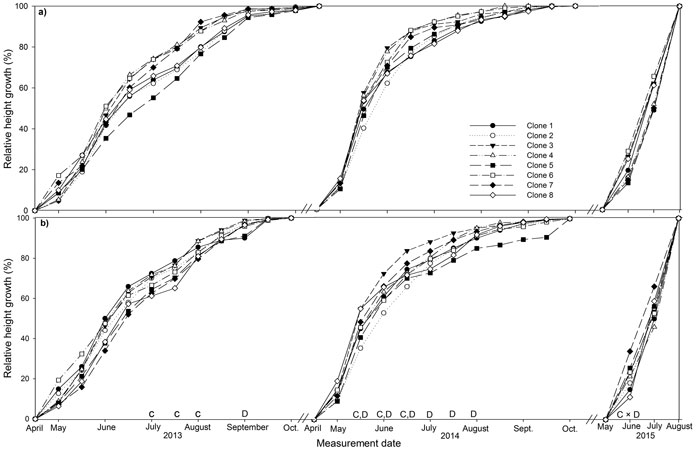
Fig. 1. Stem height relative to final height over the three years (2013, 2014, 2015) of the experiment for eight juvenile clones of Sitka spruce in (a) monoclonal and (b) multi-clonal mixtures. Letters above dates indicate statistically significant (P ≤ 0.05) differences between clones (C), deployment type (D) and clone × deployment type (C × D). View larger in new window/tab
Between 39 to 51% of diameter growth occurred in the first growing season for all clones (Fig. 2). In December 2013, relative diameter was significantly higher in monoclonal plots relative to mixed plots, but this difference was not maintained later in the experiment.
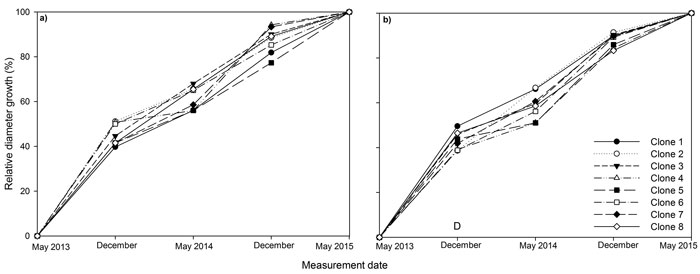
Fig. 2. Stem diameter at base relative to final stem diameter at base over the three years (2013, 2014, 2015) of the experiment for eight juvenile Sitka spruce clones in (a) monoclonal and (b) multi-clonal mixtures. A statistically significant (P ≤ 0.05) difference between deployment type (D) occurred in December 2013. View larger in new window/tab
3.4 Biomass distribution
In January 2015, clone 2 had significantly greater total above-ground biomass than all other clones (Table. 4). In general, all clones allocated the lowest percentage of biomass to branches with clones 7 and 8 allocating significantly less biomass to branch growth in 2015 than clone 2. No significant differences were observed in mean or proportional values for foliage (3.92 g ± 0.58; 26 to 35%), stem (3.53 g ± 0.59; 22 to 31%) or root (4.05 g ± 0.64; 25 to 37%) biomass in 2015.
| Table 4. Biomass partitioning of eight juvenile Sitka spruce clones in January 2015. Data shown are mean values ± 1 SE (standard error). Means showing the same letter are not statistically significant (P ≤ 0.05). n = 10. | |||
| Biomass Partitioning | |||
| Year | Clone | Branch (g) | Total above-ground biomass (g) |
| 2015 | 1 | 1.23 ± 0.2ab | 12.89 ± 1.5b |
| 2 | 1.88 ± 0.3a | 17.26 ± 1.0a | |
| 3 | 1.27 ± 0.3ab | 12.98 ± 1.4b | |
| 4 | 1.33 ± 0.3ab | 12.24 ± 0.6b | |
| 5 | 1.71 ± 0.4ab | 11.77 ± 2.0b | |
| 6 | 1.50 ± 0.3ab | 12.83 ± 1.6b | |
| 7 | 1.11 ± 0.3b | 11.22 ± 1.9b | |
| 8 | 1.16 ± 0.3b | 12.08 ± 1.7b | |
3.5 Relationships between height growth, biomass and crown morphology
Several relationships between crown traits were highly significant (P < 0.001; Fig. 3). Deploying ramets in monoclonal plots significantly reduced regression coefficients (P < 0.001) and the strength of relationships between total biomass and between crown silhouette area (CSA) and branch number and CSA declined by up to 30%.
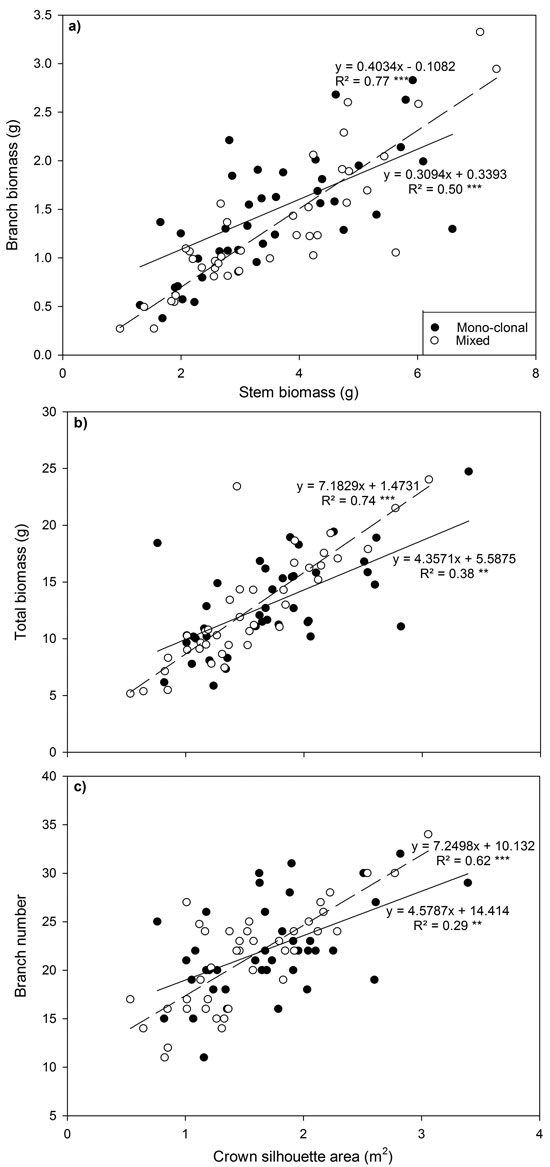
Fig. 3. Relationship between (a) branch biomass and stem biomass, (b) total biomass and crown silhouette area (CSA) and (c) branch number and CSA for all Sitka spruce ramets planted in monoclonal and clonal mixtures in January 2015. Symbols indicate deployment-type. Lines represent linear regressions for each deployment type; solid lines = monoclonal plots, dashed lines = mixed plots. ** = P < 0.01; ***= P < 0.001. Each point represents a ramet.
Highly significant positive relationships were observed for total height and 2014 height increment (Fig. 4a), shoot biomass and stem biomass (Fig. 4b), foliage biomass and branch biomass (Fig. 4c) and shoot biomass and CSA (Fig. 4d). The relationship between 2014 height increment and total height reflected the large increase in height growth that occurred in 2014. The significant positive linear relationship observed between foliage biomass and branch biomass, indicated that more foliage biomass is produced by ramets with larger and heavier branches (Fig. 4c). Shoot biomass had a significant positive linear relationship with CSA (Fig. 4d).
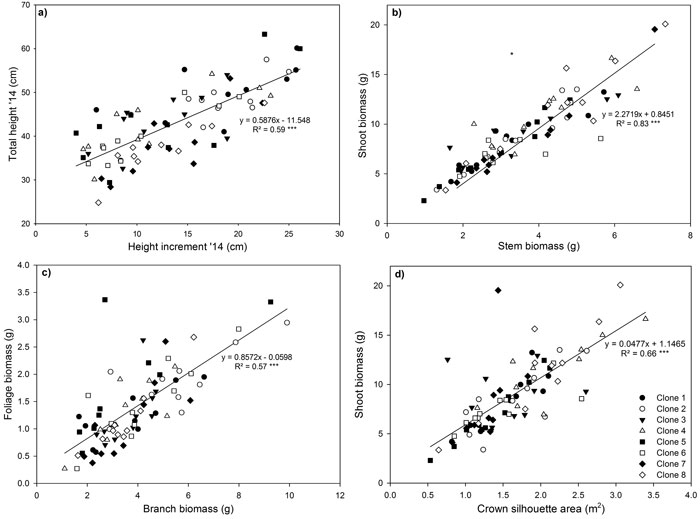
Fig. 4. Relationship between (a) shoot height increment in 2014 and total stem height in 2014, (b) shoot and stem biomass (c) foliage and branch biomass and (d) shoot biomass and crown silhouette area for eight Sitka spruce ramets planted in monoclonal and multi-clonal mixtures in January 2015. Lines represent linear regressions, *** = P < 0.001. Each point represents a ramet. View larger in new window/tab
4 Discussion
4.1 Influence of deployment-type on stem growth
Perhaps the most pertinent question in clonal forestry is determining how deployment-type affects tree performance. The close spacing used in this experiment was intended to accelerate competition between ramets, encouraging faster phenotypic expression and enabling morphological responses to intra- and inter-clonal competitive pressures to be determined earlier (Adams et al. 2008; Gould et al. 2011). Although mean stem diameter was not affected by deployment-type, stem height was lower in mixed plots than monoclonal plots in 2014. Furthermore, the height and diameter of clone 5 was significantly reduced in mixed plots. These results suggest that for some clones, deploying them in mixtures could reduce their growth and their performance could be less predictable which might result in a reduction of mean stand productivity. These results partially agree with other longer-term studies on conifers and broadleaves (Benbrahim et al. 2000; Sharma et al. 2008b), which found that deployment-type did not affect overall growth or productivity, but individual clonal performance differed with deployment-type.
Increased size heterogeneity in mixed plots could be attributed to increased growth of the more productive clones at the expense of the slower growing clones. DeBell and Harrington (1997) and Sharma et al. (2008b) recorded higher coefficients of variation in mixed plots compared to monoclonal plots for diameter at breast height and stem height. In the current study, significantly greater coefficient of variation of absolute height and diameter was found in mixed plots compared to monoclonal plots on several occasions during the study. This result might be related to the assumption that in monoclonal plots all ramets are equally competitive, while in mixed plots, competitive ability varies and the less competitive clones would be dominated by more competitive clones (Sharma et al. 2008b).
Clones which grew faster at an earlier stage could achieve a size advantage in mixed stands once canopy closure occurred, further increasing their ability to dominate their neighbours. Sharma et al. (2007) demonstrated that clones of Pinus radiata, which had slow initial growth after planting, would be at a competitive disadvantage and their growth would be suppressed once competition became intense. Assessing intra-annual growth provides important information on how competitive interactions developed and how differences in growth may affect annual growth rate. Several clones in the current study were found to have different intra-annual growth patterns and one clone demonstrated significantly reduced height growth in mixed plots. Determining when each clone has its peak growth, and thus their peak resource demands, forest managers can influence site productivity by mixing clones which have different temporal demands (Lindgren 1993). Temporarily varying resource demands by planting clones in mixtures could reduce competition between individuals and increase overall stand productivity through more efficient resource use.
Furthermore, size differences at the time of establishment could affect a tree’s ability to compete efficiently with its neighbours (South and Mason 1993). Even slightly greater stem height or vigour at the time of establishment could increase a tree’s ability to capture light, and over time, gain an advantage over smaller neighbours perpetuating their dominance and their neighbours suppression (Oliver and Larson 1990). Although non-significant differences were recorded between ramets at the beginning of the experiment, these did not affect individual height or diameter growth responses in either deployment-type.
Changes in inter-annual growth patterns have been observed for many tree species during stand development, increasing the uncertainty of applying results from juvenile trees to mature stands (Adams et al. 2008). However, very young trees have shown similar growth responses to mature trees in previous studies of Sitka spruce and Douglas fir (Campbell and Wilson 1973; Gill 1987). Furthermore, decreasing spacing causing a corresponding increase in competitive interactions, did not alter the growth response of seedlings relative to mature trees of Douglas fir (Campbell and Wilson 1973). Thus, by increasing planting density and accelerating the competition process, it may be possible to predict growth and competitive responses at an earlier age without compromising selection accuracy.
These results demonstrate the importance of considering competitive conditions when devising clonal mixtures. Ignoring such interactions and growth responses could result in inappropriate mixtures which may decrease stand productivity, depending on deployment-type, site and genetic composition (Adams et al. 2008). Thus, productivity gains may be over-estimated for some clones by excluding competitive interactions during the screening and subsequent planting process. Considering the limited duration, age and number of clones used in this study, it is plausible that the significant variation in growth rates which occurred between clones would further increase stand heterogeneity in mixed plots over time without silvicultural intervention.
4.2 Crown architecture and biomass partitioning
Crown shape or structure can dictate a tree’s competitive ability (Alves and Santos 2002). Asymmetric competition for light can impact stand structural dynamics, dictating competitive interactions between trees of different sizes (Umeki 1997). Trees grown in uniformly aged stands will, over time, separate into several crown classes depending on crown size and architecture. Most clones in the current experiment exhibited similar crown characteristics and biomass partitioning strategies in January 2015; however, clone 2 had significantly greater branch biomass, total biomass and CSA than several other clones during the experiment. The biomass partitioning strategy observed in clone 2 resulted in it allocating more biomass to aboveground components, increasing its competitive ability at an important stage of stand development when competition for light was the main limiting factor for growth in mixed stands. Conversely, if soil resources (i.e. water and nutrients) are limited increased root biomass, particularly fine root biomass, might be a better competitive strategy (Berendse and Moller 2009). However, fine root surface area for roots between 0.2–0.4 mm have been shown to be negatively affected in Sitka spruce clones when deployed in mixed plots (Donnelly et al. 2016).
At the end of the experiment, competition between individuals in mixed plots was more asymmetrical than in monoclonal plots, which could ultimately affect stand composition and overall productivity in mixed plots (Alves and Santos 2002). This suggests that increased inter-clonal competition may be due to differences in growth, biomass partitioning and phenology between clones (Michael et al. 1988; Jonsson and Óskarsson 2007). This is supported by results from the regression analyses, which showed that competitive environment altered the relationships between crown variables. However, an individual’s height and/or its biomass partitioning strategy was more important in determining its growth in mixed than in monoclonal plots.
Genetic and environmental variation plays a critical role in shaping crown architecture, influencing growth rates and biomass partitioning. The young age of material and limited duration of this experiment may restrict the extrapolation of these findings to older trees. Additionally, relatively few clones were studied and therefore results may not apply to all available clones. Thus, more in-depth studies are required to assess deployment effects using older material at several sites through the full planting range of Sitka spruce to see if differences remain over time. The sporadic differences observed between clones over the study highlight the difficulty in assessing such young clones. Although it would be preferential to assess clones at a mature stage such prolonged trials are restricted by logistical and financial limitations. Furthermore, frequent changes over time in mature clones have previously been reported in both mixed (Zsuffa 1975; Ares 2002) and monoclonal plots (Debell and Harrington 1997) of Populus clones.
5 Conclusion
Deployment-type resulted in different competitive pressures affecting growth and biomass partitioning. A significant deployment × clone interaction occurred for one clone in 2015 for absolute stem height and diameter. Additionally, inter-clonal competition increasing within- and between clone variability in tree growth which could affect the contribution of individual clones to plot productivity over time. Deployment-type significantly altered relationships between crown variables and competition was more asymmetric in mixed plots relative to monoclonal plots. Thus, predicted gains in productivity may not be realised for certain clones when deployed in mixtures if competitive interactions are excluded from clonal trials. It is plausible that the significant variation observed between growth rates would further increase stand heterogeneity in mixed plots over time without silvicultural intervention, negatively affecting stand uniformity and productivity.
Acknowledgements
This work was supported by a research grant from the Department of Agriculture, Food and the Marine, Ireland (grant number FORGEN 10/RD/717). Coillte Teoranta kindly provided the experimental site and all plant material. We thank David Thompson for suggestions and guidance throughout the study and staff at the National Tree Improvement Centre, Killmacurra, Ireland, Vasiliki Balogianni for field assistance. We thank Jim Grant for valuable assistance with statistical interpretation and presentation. We are grateful to the editor and the anonymous reviewers for their helpful and constructive comments that greatly contributed to improving the final version of the paper.
References
Adams J.P., Land S.B., Belli K.L., Matney T.G. (2008). Comparison of 17-year realized plot volume gains with selection for early traits for loblolly pine (Pinus taeda L.). Forest Ecology and Management 255(5–6): 1781–1788. https://doi.org/10.1016/j.foreco.2007.11.041.
Adams W., Roberds J., Zobel B. (1973). Intergenotypic interactions among families of loblolly pine (Pinus taeda L.). Theoritical and Applied Genetics 43(7): 319–322. https://doi.org/10.1007/BF00275259.
Alves L.F., Santos F.A. (2002). Tree allometry and crown shape of four tree species in Atlantic rain forest, south-east Brazil. Journal of Tropocial Ecology 18(2): 245–260. https://doi.org/10.1017/S026646740200216X.
Ares A. (2002). Changes through time in traits of poplar clones in selection trials. New Forests 23(2): 105–119. https://doi.org/10.1023/A:1015687708505.
Aspelmeier S., Leuschner C. (2006). Genotypic variation in drought response of silver birch (Betula pendula Roth): leaf and root morphology and carbon partitioning. Trees 20(1): 42–52. https://doi.org/10.1007/s00468-005-0011-9.
Benbrahim M., Gavaland A., Gauvin J. (2000). Growth and yield of mixed polyclonal stands of Populus in short-rotation coppice. Scandanvian Journal of Forest Research 15: 605–610. https://doi.org/10.1080/02827580050216851.
Berendse F., Moller F. (2009). Effects of competition on root–shoot allocation in Plantago lanceolata L.: adaptive plasticity or ontogenetic drift? Plant Ecology 201(2): 567–573. https://doi.org/10.1007/s11258-008-9485-z.
Boyden S., Binkley D., Stape J.L. (2008). Competition among Eucalyptus trees depends on genetic variation and resource supply. Ecology 89(10): 2850–2859. https://doi.org/10.1890/07-1733.1.
Brassard B.W., Chen H.Y., Bergeron Y., Pare D. (2011). Differences in fine root productivity between mixed‐and single‐species stands. Functional Ecology 25(1): 238–246. https://doi.org/10.1111/j.1365-2435.2010.01769.x.
Campbell R.K., Wilson B.C. (1973). Spacing-genotype interaction in Douglas-fir. Silvae Genetica 22: 15–20.
Campbell R.K., Echols R.M, Stonecypher R.W. (1986). Genetic variances and interactions in 9-year old Douglas-fir grown at narrow spacings. Silvae Genetica 35: 24–32.
Cameron A.D. (2015). Building resilience into Sitka spruce (Picea sitchensis [Bong.] Carr.) forests in Scotland in response to the threat of climate change. Forests 6(2): 398–415. https://doi.org/10.3390/f6020398.
Clair J.S., Adams W. (1991). Relative family performance and variance structure of open-pollinated Douglas-fir seedlings grown in three competitive environments. Theoritical and Applied Genetics 81(4): 541–550. https://doi.org/10.1007/BF00219447.
Dawson W., McCracken A. (1995). The performance of polyclonal stands in short rotation coppice willow for energy production. Biomass and Bioenergy 8(1): 1–5. https://doi.org/10.1016/0961-9534(94)00077-7.
Debell D.S., Harrington C.A. (1993). Deploying genotypes in short-rotation plantations: mixtures and pure cultures of clones and species. Forest Chronicles 69(6): 705–713. https://doi.org/10.5558/tfc69705-6.
Debell D.S., Harrington C.A. (1997). Productivity of Populus in monoclonal and polyclonal blocks at three spacings. Canadian Journal of Forest Research 27(7): 978–985. https://doi.org/10.1139/x97-059.
Domisch T., Finér L., Dawud S.M., Vesterdal L., Raulund-Rasmussen K. (2015). Does species richness affect fine root biomass and production in young forest plantations? Oecologia 177(2): 581–594. https://doi.org/10.1007/s00442-014-3107-3.
Donnelly L., Jagodzinski A.M., Grant O.M., O’Reilly C. (2016). Above-and belowground biomass partitioning and fine root morphology in juvenile Sitka spruce clones in monoclonal and polyclonal mixtures. Forest Ecology and Management 373: 17–25. https://doi.org/10.1016/j.foreco.2016.04.029.
Foster G.S., Rousseau R., Nance W. (1998). Eastern cottonwood clonal mixing study: intergenotypic competition effects. Forest Ecology and Management 112(1–2): 9–22. https://doi.org/10.1016/S0378-1127(98)00302-8.
Franklin E.C. (1979). Model relating levels of genetic variance to stand development of four North American conifers. Silvae Genetica 28: 207–210.
Gill J.G.S. (1987). Juvenile-mature correlations and trends in genetic variances in Sitka spruce in Britain. Silvae Genetica 36: 189–194.
Gould P.J., St Clair J.B., Anderson P.D. (2011). Performance of full-sib families of Douglas-fir in pure-family and mixed-family deployments. Forest Ecology and Management 262(8): 1417–1425. https://doi.org/10.1016/j.foreco.2011.06.042.
Hartmann H.T., Kester D.E., Davies Junior F.T., Geneve R.L. (2011). Plant propagation: principles and practices. Prentice-Hall, New Jersey.
Jonsson T.H., Óskarsson Ú. (2007). Shoot growth strategy of 29 Black cottonwood (Populus trichocarpa) clones. Iceland Journal of Agricultural Science 20: 25–36.
King N.T., Seiler J.R., Fox T.R., Johnsen K.H. (2008). Post-fertilizer physiology and growth performance of loblolly pine clones. Tree Physiology 28(5): 703–711. https://doi.org/10.1093/treephys/28.5.703.
Lankau R.A., Strauss S.Y. (2007). Mutual feedbacks maintain both genetic and species diversity in a plant community. Science 317(5844): 1561–1563. https://doi.org/10.1126/science.1147455.
Lee S., Thompson D., Hansen J.K. (2013). Sitka Spruce (Picea sitchensis (Bong.) Carr). In: Pâques L.E. (ed.). Forest tree breeding in Europe. Vol. 25 of the series Managing Forest Ecosystems. Springer, Netherlands. p. 177–227. https://doi.org/10.1007/978-94-007-6146-9_4.
Lepik A., Abakumova M., Zobel K., Semchenko M. (2012). Kin recognition is density-dependent and uncommon among temperate grassland plants. Functional Ecology 26(5): 1214–1220. https://doi.org/10.1111/j.1365-2435.2012.02037.x.
Libby W.J. (1987). Testing for clonal forestry. Annals of Forest Science 13: 61–76.
Lindgren D. (1993). The population biology of clonal deployment. In: Ahuja M.-R., Libby W.J. (eds.). In: Clonal forestry I. Genetics and biotechnology. Springer. https://doi.org/10.1007/978-3-642-84175-0_4.
Markovic J., Herpka I. (1986). Plantations in short rotations. In: Guzina V. (ed.). Poplar and Willows in Yugoslavia. Poplar research institue, Novi Sad, Yougoslavia. p. 182–197.
Mason N.W., Richardson S.J., Peltzer D.A., De Bello F., Wardle D.A., Allen R.B. (2012). Changes in coexistence mechanisms along a long-term soil chronosequence revealed by functional trait diversity. Journal of Ecology 100(3): 678–689. https://doi.org/10.1111/j.1365-2745.2012.01965.x.
Mason W.L., Connolly T. (2013). Mixtures with spruce species can be more productive than monocultures: evidence from the Gisburn experiment in Britain. Forestry 87(2): 209–217. https://doi.org/10.1093/forestry/cpt042.
Mason W.L., Connolly T. (2016). Long-term development of experimental mixtures of Scots pine (Pinus sylvestris L.) and silver birch (Betula pendula Roth.) in northern Britain. Annual of Silvilculture Research 40(1): 11–18. https://doi.org/10.12899/asr-1119.
Mead R., Gilmour S.G., Mead A. (2012). Statistical principles for the design of experiments: applications to real experiments. Cambridge University Press. https://doi.org/10.1017/cbo9781139020879.
Michael D.A., Isebrands J.G., Dickmann D.I., Nelson N.D. (1988). Growth and development during the establishment year of two Populus clones with contrasting morphology and phenology. Tree physiology 4(2): 139–152. https://doi.org/10.1093/treephys/4.2.139.
Oliver C.D., Larson B.C. (1990). Forest stand dynamics, McGraw-Hill, Inc.
Park Y.S. (2002). Implementation of conifer somatic embryogenesis in clonal forestry: technical requirements and deployment considerations. Annals of Forest Science 59(5–6): 651–656. https://doi.org/10.1051/forest:2002051.
Sharma R.K., Mason E.G., Sorensson C.T. (2007). Impact of planting stock quality on initial growth and survival of radiata pine clones and modelling initial growth and survival. New Zealand Journal of Forestry Science 52: 14.
Sharma R.K., Mason E.G., Sorensson C.T. (2008a). Clonal screening plot type can impact growth predictions of clones deployed monoclonally. New Zealand Journal of Forestry Science 53: 7.
Sharma R.K., Mason E.G., Sorensson C.T. (2008b). Productivity of radiata pine (Pinus radiata D. Don.) clones in monoclonal and clonal mixture plots at age 12 years. Forest Ecology and Management 255(1): 140–148. https://doi.org/10.1016/j.foreco.2007.08.033.
South D.B., Mason W.L. (1993). Influence of differences in planting stock size on early height growth of Sitka spruce. Forestry 66(1): 83–96. https://doi.org/10.1093/forestry/66.1.83.
Staudhammer C.L., Jokela E.J., Martin T.A. (2009). Competition dynamics in pure-versus mixed-family stands of loblolly and slash pine in the southeastern United States. Canadian Journal of Forest Research 39(2): 396–409. https://doi.org/10.1139/X08-184.
Stovall J.P., Fox T.R., Seiler J.R. (2013). Allometry varies among 6-year-old Pinus taeda (L.) clones in the Virginia Piedmont. Forest Science 59(1): 50–62. https://doi.org/10.5849/forsci.10-095.
Thompson D. (2013). Development of improved Sitka spruce for Ireland. Irish Forestry 70: 104–118.
Treacy M., Evertsen J., Ní Dhubháin Á. (2000). A comparison of mechanical and physical wood properties: of a range of Sitka spruce provenances. National Council for Forest Research and Development (COFORD).
Umeki K. (1997). Effect of crown asymmetry on size–structure dynamics of plant populations. Annals of Botany 79(6): 631–641. https://doi.org/10.1006/anbo.1996.0388.
Williams C., Bridgwater F., Lambeth C. (1983). Performance of single family versus mixed family plantation blocks of loblolly pine. Proceedings of 17th Southern Forest Tree Improvement Conference, University of Georgia, Athens, GA. p.194–202.
Zhou T., Zhou J., Shelbourne C. (1998). Clonal selection, propagation, and maintenance of juvenility of Chinese fir, and afforestation with monoclonal blocks. New Zealand Journal of Forestry Science 28: 275–292.
Zsuffa L. (1975). Some problems of hybrid Poplar selection and management in Ontario. The Forestry Chronicle. 51(6): 240–242. https://doi.org/10.5558/tfc51240-6.
Total of 50 references.
