Lucas N. López  ,
Hanne K. Sjølie,
Abbas Nabhani,
Francisco X. Aguilar
,
Hanne K. Sjølie,
Abbas Nabhani,
Francisco X. Aguilar
Impacts of biodiversity and carbon policies on the management of Norwegian forest and its ecosystem services
López L. N., Sjølie H. K., Nabhani A., Aguilar F. X. (2024). Impacts of biodiversity and carbon policies on the management of Norwegian forest and its ecosystem services. Silva Fennica vol. 58 no. 4 article id 23067. https://doi.org/10.14214/sf.23067
Highlights
- National-level biodiversity and carbon forest sector policies modelled in a simulation-optimization framework
- Impacts of policies on management along site productivity gradients estimated
- Policies vary in impact across productivity gradients with regional implications.
Abstract
Measures to enhance boreal forests’ biodiversity and climate change mitigation potential are high on the policy agenda. Site productivity influences management, ecological attributes, and economic outcomes. However, national-level analyses of management implementation in response to policies considering site productivity are lacking. We analyzed impacts of a carbon policy (Carb), a biodiversity policy (Bio) and a combined biodiversity and carbon policy (BioCarb) in Norway using a simulation-optimization framework, assessing impacts on forest management, timber harvest, ecological attributes, and carbon fluxes until year 2140. Management alternatives were simulated in the single-tree simulator TreeSim before being fed into a market model NorFor to compare policy outcomes to a business-as-usual (BAU) scenario. All policies led to decreased harvests. Old forests expanded from the current 3% to cover 21% or more of the productive forest area in all scenarios. Impacts of policies depended on site productivity. On low-productive land, management under Bio mirrored BAU, while the Carb and BioCarb policies yielded more set-asides. On high-productive land, management intensity under the Carb policy was similar to BAU but the Bio and BioCarb policies resulted in more set-asides and more old forest. Thus, on low-productive land, the carbon policy showed to have the strongest impact on forest management, while on high-productive land, the biodiversity policy had the strongest impact. With geographical site-productivity gradients, the two policies exhibited different regional effects. The study shows that ex-ante analyses with appropriate tools can provide relevant information of multiple consequences beyond the stated aims which should be considered in policy design.
Keywords
simulation;
optimization;
site productivity;
bio-economic modeling;
NorFor;
regional impacts;
TreeSim
-
López,
Inland Norway University of Applied Sciences, Faculty of Applied Ecology, Agricultural Sciences and Biotechnology, P.O. Box 2400, Koppang, Norway
 https://orcid.org/0009-0006-6860-3408
E-mail
lucas.lopez@inn.no
https://orcid.org/0009-0006-6860-3408
E-mail
lucas.lopez@inn.no
-
Sjølie,
Inland Norway University of Applied Sciences, Faculty of Applied Ecology, Agricultural Sciences and Biotechnology, P.O. Box 2400, Koppang, Norway
https://orcid.org/0000-0001-8099-3521
E-mail
hanne.sjolie@inn.no
- Nabhani, Inland Norway University of Applied Sciences, Faculty of Applied Ecology, Agricultural Sciences and Biotechnology, P.O. Box 2400, Koppang, Norway E-mail abbas.nabhani@inn.no
- Aguilar, Swedish University of Agricultural Sciences, Department of Forest Economics, SE-901 83 Umeå, Sweden E-mail francisco.aguilar@slu.se
Received 2 November 2023 Accepted 10 September 2024 Published 3 October 2024
Views 150191
Available at https://doi.org/10.14214/sf.23067 | Download PDF

Supplementary Files
1 Introduction
The boreal forest biome is one of the largest land biomes and hosts 73% of the world’s coniferous forests (Kuusela 1992; Haila 1994; Wulder et al. 2007; Kayes and Mallik 2020). Boreal forests supply about 17% of the global industrial roundwood (Burton et al. 2010) and multiple other critical ecosystem services (Pohjanmies et al. 2017), thus playing a key role in supporting human well-being. Global wood demand is expected to increase by approx. 37% by 2050 compared to 2020 (FAO 2022). At the same time, international agreements and national regulations increasingly demand other forest ecosystem services (EU 2023). These increasing expectations put greater challenges on the management of boreal forests (Aggestam et al. 2020; Pohjanmies et al. 2021).
In general, timber production is the most prioritized ecosystem service in the boreal forest outside conservation areas (Huuskonen et al. 2021) which might come at the expense of the supply of other ecosystem services through changes in i.a. forest structures (Duncker et al. 2012; Pohjanmies et al. 2017). Hence, different regulative framework and instruments are designed to support other ecosystem services from boreal forests like the international commitments on biodiversity conservation (Convention on Biological Diversity 2011) and the Paris Agreement (UNFCCC 2015) and EU’s regulation on land use, land use change and forestry (EU 2018) that aim at reducing atmospheric greenhouse gas (GHG) concentration through enhancing forest sector carbon pools. In the Nordic countries Finland, Sweden and Norway, large parts of the forests are under management, with even-aged forestry and clearcutting being the dominant silvicultural regime (Savilaakso et al. 2021). Over time, forest policy objectives have been broadened to include public goods alongside timber production (Fridén et al. 2024). Forest certification schemes that focus on improving management practices to support biodiversity within production forests are widely implemented (Sverdrup-Thygeson et al. 2008; Elbakidze et al. 2011). The debate of effects of clearcutting on ecosystem services is ongoing (Keenan and Kimmins 1993). Several studies have been conducted to elucidate the influence of forest management on multiple forest attributes (Johnston and Withey 2017; Pohjanmies et al. 2017; Pingoud et al. 2018; Sabatini et al. 2018). These studies underlined the complex interactions between forest management practices and ecosystem services like biodiversity and carbon pools and the need to balance economic, social, and ecological aims.
There is a rich literature of how policies can support forest management that enhances carbon sequestration and biodiversity. The multi-faceted and complex nature of biodiversity gives rise to a wide set of policy intervention options. The most suitable forest policy instruments to enhance multifunctionality consider economic, social, and ecological factors (Cubbage et al. 2007). Angelstam et al. (2011) and Brukas et al. (2013) discussed how forest policies are implemented in forest management in northern Europe, while Angelstam et al. (2020) stressed how policies should aim at increase landscape connectiveness for conserving biodiversity. Silbaugh and Betters (1997) explored how biodiversity indices may be brought into decision-support forest management tools.
Another branch in the literature has scrutinized how forest policies can support increased forest carbon sequestration. This includes clarifying the frames and opportunities for forest management carbon credits (Fahey et al. 2010; Golden et al. 2011; Malmsheimer et al. 2011). On the stand level, van Kooten et al. (1995) outlined the theory of and investigated numeric impact of carbon taxes and subsidies on profit-maximizing forest management, concluding that optimal rotation ages were increased with higher carbon price.
To assess the impact of policies on management and forest attributes, forest simulation and optimization models (SOM) are widely used, typically based on profit-maximization (Kaya et al. 2016). On the stand level, Niinimäki et al. (2013) combined process-based growth modeling and economic analyses to evaluate carbon storage in Finland. Juutinen et al. (2018) found trough stand-level simulation and optimization that carbon payment increases rotation ages with some impact on forest management in Finland. Also in Finland, Pukkala (2020) employed SOM on a large set of forest stands to evaluate at which carbon price harvesting would no longer be profitable. Market-level analyses approaches are commonly used for understanding how policies influence harvest levels, wood product carbon storage and economic outcomes. Im et al. (2007) used a partial equilibrium model of western Oregon private forests to assess impacts of carbon taxes and subsidies on carbon fluxes. Their findings indicate that carbon policy shapes forest management practice, leading to reduced timber harvest and increased silvicultural investments. Moreover, as the carbon tax level increased, the optimal rotation age increased. Pohjola et al. (2018) utilized a SOM approach with endogenous markets with the FinFEP (Finnish Forest and Energy Policy) partial equilibrium model, which encompasses the forest and energy sectors in Finland. Their model integrates supply and demand with Finnish National Forest Inventory (NFI) data, landowner behavior, technological details of wood industries, and wood products demand. They assessed impacts of a forest carbon policy by considering the behavior of forest owners and firms in response to carbon pricing. Similarly, Guo and Gong (2017) studied the potentials and costs of enhancing forest carbon sequestration in productive forestlands in Sweden through a carbon tax/subsidy policy, analyzing the impacts of carbon prices ranging from approx. 170 to 1428 SEK per Mg of CO2 (approx. 14 to 123 € in 2024). Applying a partial equilibrium model based on intertemporal optimization adapted from the Swedish Timber Market Model (STIMM), they simulated how carbon prices influence timber harvest and forest carbon stocks dynamics. In Norway, a partial equilibrium model integrating wood markets, forest industry, timber harvest and forest management was applied to generate marginal-cost curves for carbon sequestration (Sjølie et al. 2013a), assess climate change mitigation under the first Kyoto protocol (Sjølie et al. 2014) and estimate effects of considering albedo-induced climate impacts in policies (Sjølie et al. 2013b).
A branch of studies has explored trade-offs between biodiversity protection and economic returns in forest management using SOM. Bergseng et al. (2012) used a SOM with exogenous wood prices to analyze economic and habitat impacts of forest management restrictions aimed at biodiversity protection. Vergarechea et al. (2023) applied a single-tree simulator and a multi-objective optimization model to assess the viability of meeting exogenously given quantities of wood and biomass demand and simultaneously ensuring sustainable forest ecosystem services supply in Norway. Pukkala (2011) applied a SOM to analyze the effect of carbon pricing on forest management and economics in Finland. In Sweden, Eggers et al. (2020) examined effects of forest management on biodiversity and wood production based on different stakeholders’ preferences using a SOM. A SOM were also applied by Pohjanmies et al. (2019) to analyze impacts of stand management on the availability of dead wood and wood production in Finland and by Augustynczik et al. (2020) to find the optimal forest management considering biodiversity and wood supply in Southwestern Germany. Few studies have focused on how management implications of policies differ with site characteristics; however, Borges et al. (2016) found that green-up time restrictions yielded site productivity-specific impacts depending on details in the regulations.
In the extensive literature of forest management and biodiversity applying SOM, the lion’s share of studies, including the above-mentioned papers, do not include impacts of policies or management shifts on wood markets. The few works employing SOM with endogenous wood markets to scrutinize costs and effects of policies to preserve biodiversity include Montgomery et al. (1999) and Nalle et al. (2004). Both used regional timber market models to consider opportunity costs under large-scale changes in management and harvest levels. Montgomery et al. (1999) underlined the strength in their approach to cost-effectively select areas for old-growth forest conservation and provide a basis for policymakers to compare conservation goals. Through combining a wildlife model stochastically simulating habitats and a regional wood-market model, Nalle et al. (2004) identified areas with high habitat potential and low economic consequences of set-aside. The literature of SOM considering adaptations in markets caused by biodiversity policies is thus limited. To the best of our knowledge, no studies have combined biodiversity and carbon policies in the same analysis using a SOM with endogenous markets. In addition, we identified that most carbon policy studies have focused on timber markets and industry with relatively less attention being paid to forest management.
We applied a SOM of the Norwegian forest sector with endogenous wood markets to assess how carbon and biodiversity policies induce changes in management, harvest, carbon fluxes and biodiversity. We focused on the management of forest land and regional impacts, using site productivity as a scale due to its crucial role in forest management practice, ecological attributes, and economic value. The objectives of our study were to: i) assess the individual and combined impact of carbon and biodiversity policies on forest management and timber harvest across site productivity levels and geographical areas, and ii) analyze the effects of these policies on habitats and carbon fluxes.
2 Materials and methods
2.1 Study area
Norway’s mainland area extends approx. 324 000 km2 within the Scandinavian Peninsula and the forest cover is circa 121 800 km2 (FAO 2020a) of which about 71%, 86 494 km2, is considered productive forest area, i.e. with an annual growth of minimum 1 m3 ha–1 yr–1 incl. bark (FAO 2020b). Norway experienced from 1990 to 2020 a positive net change in forest area cover of about 570 km2 (FAO 2020a). Floristic composition includes around 30 tree species (NIBIO 2022), where the dominant trees species are the two softwood conifers species spruce (Picea abies (L.) H. Karst.) and pine (Pinus sylvestris L.) and the two broadleaves species silver birch (Betula pendula Roth), and downy birch (Betula pubescens Ehrh.) (Fjellstad and Skrøppa 2020). The main wood industries in Norway consist of board, pellet, pulp & paper, and sawmill plants geographically clustered as the coniferous forests in the central and south-eastern part of the country (Supplementary file S1).
Forest lands are classified into site productivity classes using the H40 Site Index (SI) system. The SI refers to the average height (m) of the one hundred trees per hectare with the largest diameter at breast height age of 40 years (Tveite and Braastad 1981), running from 6 to 26. Based on the Norwegian NFI data, we categorized the total area of productive forest land into three SI levels. Low SI has an SI below 10.5, totaling 45% of the productive forest land area; medium SI ranges from 10.5 to 15.5 and constitutes 39% of the productive forest land area. High SI represents the forests with the greatest growth potential with an SI above 15.5, with 16% of the national productive forest land area. Productivity has important geographical gradients, with most high-productive land located in the lowland in south-eastern Norway. Moving further north and at a higher altitude, productivity is lowered. There are also some high-productive lands along the western coast. The current presence of specific tree species is shown in Suppl. file S1 maps.
2.1.1 Forest management in Norway
The main management method in Norwegian forest is stand management with clearcutting (CC) that take on circa 71% of the total productive forest area, followed by seed tree cut (STC) with 20%, and the remaining 9% including other harvesting methods, e.g. selective cutting and patch cutting (Granhus 2021; Agricultural Agency 2022). Regarding land tenure, about 78% of the productive forest area is distributed among non-industrial private owners divided into about 118 000 individual ownerships (Statistics Norway 2023).
Pine, spruce, and birches are the most important tree species in terms of volume and management (Ministry of Agriculture and Food 2014). However, only spruce and pine constitute the major forest type, i.e. coniferous evergreen forest, which covers circa 64 % of the total productive forest area (Svensson et al. 2021). The total commercial removals of industrial roundwood have experienced variation over time but remains well below the annual increment. Considering a time span of 100 years (1920–2020), Norway’s annual harvest for industry was on average 8 million m3, while the growing stock volume increased during the same period from 323 million m3 to 995 million m3.(Statistics Norway 2022). This source also indicates a pronounced and sustained rise in the annual forest growth. In 2021, about 48% of the annual increment, i.e. net volume increase of wood per year, was harvested (Statistics Norway 2022).
2.2 Simulation-optimization framework
The simulation-optimization work consisted of a sequence of five steps: A) preparation of data and setting functions and equations to simulate forest dynamics; (B) establishing forest management alternatives; (C) simulating forest dynamics for all forest management alternatives; (D) defining a set of policy scenarios; (E) running optimization and analyze results which includes visualizations such as graphs and spatial distribution maps with forest management intensities for all scenarios (Fig. 1).
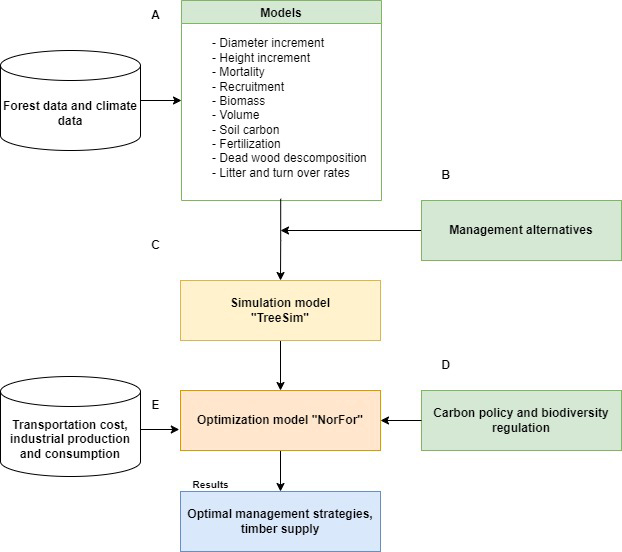
Fig. 1. Workflow of the study, including: (A) forest data preparation from the National Forest Inventory (NFI) and climate data from the Meteorological Institute, and models to simulate forest dynamics, (B) setting of forest management alternatives, (C) forest management simulation, (D) setting of carbon policy and biodiversity regulation scenarios, and (E) optimization that yields the area per management regime for each scenario. Adapted from Nabhani and Sjølie (2022).
For the first step (Fig. 1A), we utilized the Norwegian NFI data representing the productive forest landbase. The NFI design covers the entire land area of Norway and includes a systematic sample of permanent plots. Across the productive forest landbase, the NFI plots are circular-shaped with an area of 250 m2 distributed as a 3×3 km grid; the plots are revisited every five years and all trees with a diameter at breast height (DBH) ≥ 5 cm are recorded (Breidenbach et al. 2020). The NFI dataset comprises information from all plots in productive forest gathered in the period 2015–2019. In addition to the NFI data, meteorological data obtained from Norwegian Meteorological Institute (Meteorologisk institutt 2022) were utilized to estimate soil carbon stocks and fluxes.
We included sets of forest management alternatives that were simulated if plot-level criteria were met (Fig. 1B). The alternatives reflect current common practices in Norwegian forestry along a management intensity gradient and include clearcutting, seed tree cut, thinning, fertilization, planting, and natural regeneration, with varied harvest timing and regeneration intensities as well as no silviculture other than harvest and no management which excludes all treatment, also harvest. Depending on the SI, up to 37 management alternatives were applied for a plot. The alternatives were grouped into five management intensity classes (MIC): High Intensity, Medium Intensity, Low Intensity, No Investment, and No Management. Each MIC has a given regeneration density and species composition, silvicultural activities, and age and type of final harvest. The specific details of the MICs, like regeneration density and set of rotation ages, depend on the SI. For the different MICs we considered the two harvests methods clearcutting (CC) and seed tree cut (STC). As regeneration methods, planting (PL), natural regeneration (NR) and natural regeneration under seed trees (NRST) were modeled. In thinning, 35% of the volume from below was removed. Fertilization only took place after thinning. For the spatial distribution analysis, we also introduced a Moderate Intensity category, which includes Medium, Low Intensity, and No Investment MIC. The MICs with corresponding methods are summarized in Table 1.
| Table 1. Forest management alternatives implemented in TreeSim. Considering two harvest methods, clearcutting (CC) and seed tree cut (STC). In regeneration methods, planting (PL), natural regeneration under seed tree (NRST), and natural regeneration (NR). MIC were grouped into: High, Low, Medium Intensity, No Investment, and No Management. Moderate Intensity is a combined MICs for spatial distribution and visualization purpose used in Fig. 8. | ||||
| Name of the aggregate of Management Intensity Class (MIC) | Harvest methods | Regeneration methods | ||
| Pine | Spruce | Broadleaves | ||
| High Intensity | CC, STC, Thinning | PL, NRST | PL | NR |
| Medium Intensity | CC, STC, Thinning | NRST | PL | NR |
| Low Intensity | CC, STC, Thinning | None | PL | NR |
| No Investment | CC, STC, Thinning | None | None | NR |
| No Management | None | None | None | None |
| Moderate Intensity (combined MIC which includes Medium, Low, and No Investment) | CC, STC, Thinning | PL, NRST | PL | NR |
We applied the open-source, individual-tree simulator TreeSim (Fig. 1C) designed to simulate forest growth, management and stand dynamics based on functions for diameter and height growth, ingrowth and mortality (Nabhani and Sjølie 2022). TreeSim (available in GitHub repository) is written in Python and utilizes an object-oriented programming approach to model individual tree growth based on height and DBH, ingrowth and mortality as well as growing stock wood volumes (live trees), deadwood, and harvest, all categorized by tree species. In addition, TreeSim estimates above- and below-ground carbon storage in living tree biomass, deadwood carbon, soil carbon and includes forest biodiversity attributes. We simulated these individual-tree and plot level features for all 9832 NFI plots and the TreeSim output with multiple forest management alternatives for each plot were then fed into the optimization model NorFor (Suppl. file S2).
In the fifth step (Fig. 1E), we run four scenarios in NorFor (Fig. 1D): biodiversity policy (Bio) and carbon policy (Carb) scenarios in addition to a scenario that combined those (BioCarb). In addition, a BAU (business-as-usual) scenario was run with no new policy from the current situation. In the carbon policy scenarios, we applied a carbon price of 100 € Mg CO2eq–1 that targeted carbon fluxes in the compartments trees and soils (Nabhani and Sjølie 2022), emissions from machinery and transportation, storage in wood products, substitution effects and emissions upon combustion, with non-CO2 GHG converted to CO2-equivalents. All sawn wood was assumed to substitute for concrete and steel in equal parts, while boards were assumed to replace only steel. Bioenergy was assumed to replace a combination of hydropower and coal-power. This assumption is supported by the fact that in Norway, heating is predominantly powered by electricity, with hydropower being the main source of electricity production (Statistics Norway 2024b). However, coal-power is the production technology often on the margin at electricity trading partners (Olkkonen and Syri 2016). The carbon policy was designed as a tax/subsidy system where fluxes deviating from base scenario levels in any period were subject to taxes or subsidies; thus, increased sequestration or lower emissions compared to BAU yielded a subsidy while the opposite triggered a tax. Yearly GHG fluxes were calculated as the difference in GHG stock between two periods divided by the period length. For the biodiversity policy, we considered three attributes (Table 2): warm broadleaves, ungulate forage, and old forests. They were chosen based on their proven capability to enhance forest biodiversity. Temperate broadleaves trees (warm broadleaves) only live on marginal areas in Norway but are ecological hotspots (Direktoratet for naturforvaltning 2007). The forage species were chosen due to their role in the diet of deer (Solberg et al. 2012) with aspen also being considered ecologicallyl important in the boreal zone (Bendiksen et al. 2008). Maintaining old forests in the landscape is important for ecosystem functioning and biodiversity (Kuuluvainen and Gauthier 2018), not at least for specialists (Nordén et al. 2013). In addition, these attributes are available in NFI data and present in the public discourse about forest biodiversity, thus policy relevant.
| Table 2. Overview of policy scenarios analyzed in the study: business-as-usual (BAU), carbon policy (Carb), biodiversity policy (Bio), and their combination (BioCarb). BAU scenario reflects a continuation of trends observed at the time of the study, while the Bio scenario introduces a policy of harvest restrictions of forests containing certain broadleaves and old forests. The Carb scenario implements taxes/subsidies for carbon fluxes based on a carbon price of 100 € MgCO2eq–1. In the BioCarb scenario, biodiversity and carbon policies are combined. Maps of spatial distribution of target tree species described under Bio scenario are provided in Supplementary file S1. | |
| Scenario | Description |
| BAU | Business-as-usual with policies continuing as observed during the study period with no new policies implemented. |
| Bio | Biodiversity policy based on three plot features: Warm broadleaves: harvest does not occur if there is at least one of the following warm broadleaves (Fjellstad and Skrøppa 2020) species present in the plot: lime (Tilia cordata Mill.), common ash (Fraxinus excelsior L.), oaks (Quercus robur L., Quercus petraea (Matt.) Liebl.), European beech (Fagus sylvatica L.), common alm (Ulmus glabra Mill.), Norway maple (Acer platanoides L.), sweet cherry (Prunus avium (L.) L.). Ungulate forage: maximum national, total removal for rowan (Sorbus aucuparia L.), aspen (Populus tremula L.), and great sallow (Salix caprea L.) is 250 000 m3 yr –1 , about halve the base harvest level. Old forest: harvest does not occur if the stand age is equal to or greater than 160 years. |
| Carb | All carbon fluxes subject to tax/subsidies of 100 € Mg CO2eq–1. |
| BioCarb | Combined Bio policy and Carb policy. |
NorFor (Sjølie et al. 2011b) was designed to simulate the behavior of the agents in the forest sector for analyzing, e.g. costs and potentials of climate change mitigation (Sjølie et al. 2013a, 2013b, 2014) and consequences of changes in policy and economic frames (Sjølie et al. 2016). Three groups of agents are included in the model, each with an assumed behavior. Based on extensive literature of non-industrial private forest owners (Amacher et al. 2003; Beach et al. 2005), forest owners are assumed to seek to maximize their utility from market and non-market values, thus from having old forests and profit from selling timber. The wood industry maximizes profit from processing wood into wood products and consumers aim to maximize utility from consuming these products. The model maximizes forest sector welfare across regions calculated as the discounted profits and utility net of transport and capital costs, in accordance with principles established by Samuelson (1952), with optimization being based on perfect foresight. The model encompasses 19 domestic regions and two foreign regions.
Within this framework, forest owners supply spruce, pine, and non-coniferous sawlogs and pulpwood. The allocation of pulpwood is determined as a function of tree species, height, and diameter (Blingsmo and Veidahl 1992). In industry, sawlogs are processed into three types of sawn wood, while pulpwood is transformed into two pulp grades and two board grades, as well as five categories of paper and three bioenergy carriers. Pulp and bioenergy feedstocks serve as intermediate inputs in subsequent processing stages. Firewood, chips, and pellets contribute to heat production in water-borne heating systems and stoves. All pulp, paper, and board mills operating in Norway are included in the model, each represented individually with their respective capacities and processing technologies. Additionally, sawmills and bioenergy manufacturers are specified at the county level. The flow of products in harvest and industry is given in Sjølie et al. (2011).
Demand functions for all end products are specified at the county level. Elasticities regarding changes in price and gross domestic product (GDP) are primarily drawn from Chas-Amil and Buongiorno (2000) and Simangunsong and Buongiorno (2001); these elasticities are found to be rather stable over time (Buongiorno 2015). The two foreign regions are treated as pure trade regions, each characterized by specified demand and supply functions for every product. Transport costs for all products between regions are accounted for, with trade occurring when price differentials between any two regions exceed transport costs, following Samuelson (1952).
Regional GDP growth is determined by county-level population growth and national GDP projections. Population growth is informed by Statistics Norway’s ‘middle scenario’ projections, initially covering the period up to 2030 and extended beyond with 2030 figures. Foreign regions are assigned a growth rate of 1.0%. Together, these assumptions in GDP and population growth result in varying regional GDP growth rates, ranging from 1.27% to 1.64% per annum. GDP elasticities range from 0.0 for newsprint to 0.8 for linerboards, while price elasticities range from –0.3 to –0.8. Leakage is the effect of counterbalancing actions that happen outside the border of the policy implementation as a response to the policy (Richards and Stokes 2004) and should be of consideration in forest policies (Sun and Sohngen 2009). To avoid leakage to foreign regions, international trade in policy scenarios was tied to base scenario levels for all products.
Data of industry, trade, and demand are from Trømborg and Sjølie (2011) and updated to the new base year 2020. This update incorporates data from Statistic Norway (2022) for trade-related data, Mustapha (2016) for bioenergy consumption figures, Norwegian Bioenergy Association (2023) for pellet market statistics, and data from individual companies regarding industry input and output. In addition, the version of the NorFor model used in Sjølie et al. (2016) has been rewritten to the Model I structural framework, from the previous Model II structure (Johnson and Scheurman 1977). In the Model I, all land is tracked throughout the modeling horizon, allowing for keeping forest information between rotations. The model’s base year is set at 2020 with five years period length. The model is run for 30 periods, while we focus on results throughout year 2140 (period 24) to dampen terminal effects. The real discount rate was 2.5% p.a.
3 Results
To present the optimization results, timber harvest was grouped by tree species: spruce, birch, pine, temperate broadleaves (referred to as warm, detailed in Table 2), ungulated forage (referred to as forage, detailed in Table 2), and others (all other tree species).
3.1 Harvest levels and timber prices
All scenarios exhibited a decrease in harvest level in the second period and a subsequently steady growth. However, all policy scenarios yielded lower harvest volumes throughout the horizon than BAU, with the Carb policy impacting harvest levels more than the Bio policy (Fig. 2). The average annual harvested timber volume in the 2025–2140 period under the BAU scenario was 13.3 million m3, in Bio scenario 13.2 million m3, in Carb 11.8 million m3, and in BioCarb 11.7 million m3. When comparing the last period, the BAU scenario resulted in the highest estimated total timber harvested of about 15.0 million m3, while the BioCarb scenario presented the lowest harvest estimation of approx. 12.4 million m3. Carbon pricing led to strong increases in timber price for coniferous (Fig. 3 left) and broadleaves (Fig. 3 right). The BioCarb scenario experienced the highest weighted timber prices in all periods, with coniferous prices ranging from approx. 108 to 150 € per cubic meter and broadleaves prices ranging from about 104 to 145 € per cubic meter, compared to BAU levels of 26–36 € per cubic meter.
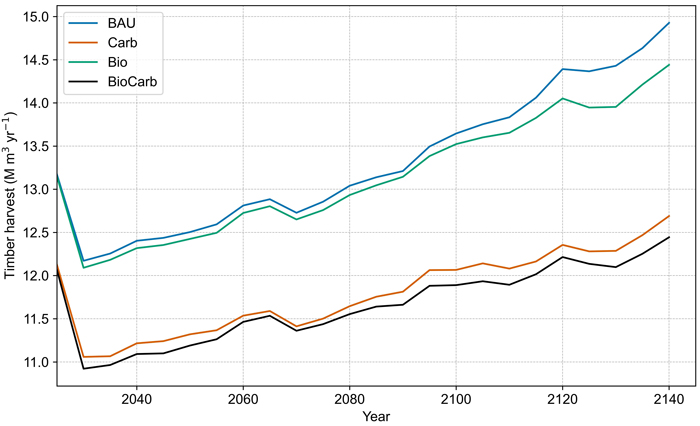
Fig. 2. Estimated total timber harvest expressed in million cubic meters per year (M m3 yr–1) from 2025 to 2140 under four different management scenarios. Business-as-usual (BAU) carbon policy (Carb) biodiversity policy (Bio), and their combination (BioCarb).
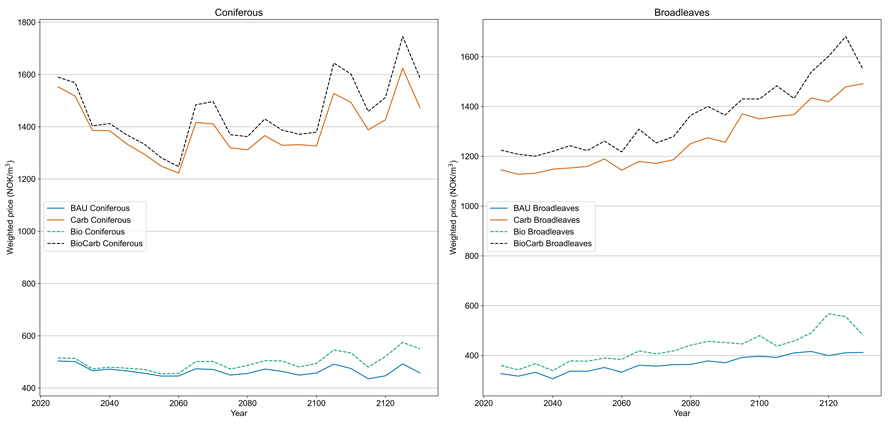
Fig. 3. Weighted timber price expressed in Norwegian Kroner (NOK) per cubic meter (1 NOK equal about 0.086 € in July 2024). Left: weighted timber prices of coniferous pulpwood and saw logs. Right: weighted timber prices of pulpwood and saw logs of broadleaves. Scenarios are business-as-usual (BAU), carbon policy (Carb), biodiversity policy (Bio), and their combination (BioCarb). View larger in new window/tab.
In all scenarios, most of the harvest occurred on medium productive land (Fig. 4). Harvest volumes were reduced across policy scenarios compared to BAU on high-productive land and largely maintained on medium-productive land with only minor deviations found in Carb scenario. While harvests were reduced on high-productive land in the Bio scenario, it was slightly increased in low-productive land while carbon policy led to reduction in both productivity groups. Across all productivity levels, spruce was the predominant harvested species ranging from about 10.3 million m3 in BAU scenario to circa 8.9 million m3 in BioCarb scenario, followed by pine.
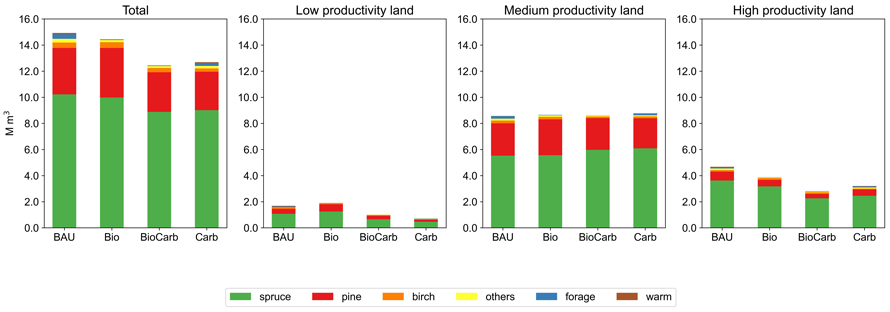
Fig. 4. Timber harvest per tree species group expressed in million m3, total and divided into land productivity levels (site index) for all scenarios. Six tree species group: spruce, birch, pine, temperate broadleaves (warm), ungulated forage (forage), and others (all other tree species). Scenarios are business-as-usual (BAU), carbon policy (Carb), biodiversity policy (Bio), and their combination (BioCarb). View larger in new window/tab.
3.2 Old forest areas and broadleaves inventories
Projections showed an increase in old forest areas and volumes of targeted broadleaves species in year 2140 across BAU and policy scenarios compared to the initial 2020 period (Fig. 5). In 2020, old forest areas, i.e. forests with stand age of at least 160 years, covered around 3000 km2, of which 84% was in low-productivity land, about 15% in medium-productivity land, and less than 1% in high productivity land. In the BAU scenario, the old forest area expanded to about 18 300 km2, that is 21% of the total productive forest in Norway, with 61% allocated in low productivity land, and about 37% in the medium productivity land (Fig. 5A).
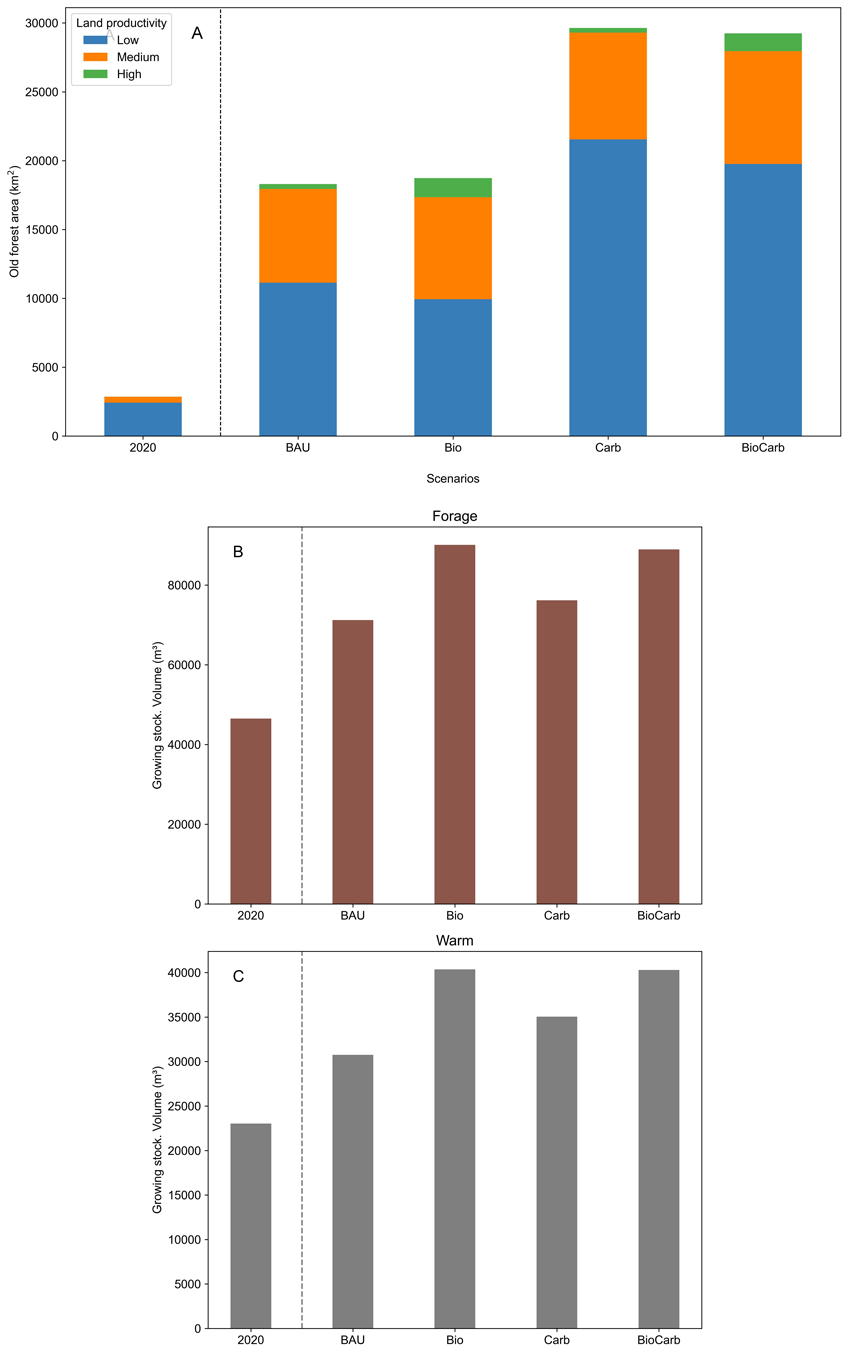
Fig. 5. Biodiversity attributes in 2020 and in 2140. A: Total old forest area (stand age equal to or greater than 160 years) in square kilometer (km2) for three land productivity levels (sites index levels). B: Growing stock volume in m3 of forage (ungulate forage) tree species. C: Growing stock volume in m3 of warm tree species (temperate broadleaves). Scenarios are business-as-usual (BAU), carbon policy (Carb), biodiversity policy (Bio), and their combination (BioCarb).
The impacts of policies on old forest areas varied with land productivity. Within the high productivity lands (14 100 km2), the Bio scenario led to the greatest expansion in old forest areas, followed by the BioCarb scenario. In the medium productivity land of 33 820 km2, the BioCarb scenario resulted in the largest expansion of old forest areas, followed by the Carb scenario. Within the low productivity lands (38 600 km2), the Carb scenario showed the largest expansion of old forests, followed by BioCarb. Finally, out of the total productive forest land (86 494 km2), the Carb policy led to the largest expansion of old forest.
For all scenarios, the total growing stock volume for forage and warm broadleaves increased compared to the initial state. For forage, the BAU scenario demonstrated a growth from approximately 46 500 m³ to 71 000 m³ by 2140, an increase of 53% (Fig. 5B). For warm broadleaves, there was a 34% increase under the BAU scenario, with volumes increasing from around 23 000 m³ to 31 000 m³ (Fig. 5C). Under the Carb scenario, the volumes of forage and warm broadleaves increased by 63% and 52% from year 2020 to year 2140, respectively. The 2020–2140 increases in volumes in the Bio scenario were 91% for forage and 69% for warm broadleaves; the numbers were similar for the BioCarb scenario.
3.3 GHG fluxes
All scenarios experienced a pronounced decrease in net GHG sequestration from 2025 to 2140 (Fig. 6A). The annual average net GHG sequestration was higher under the Carb and BioCarb policies than in the BAU scenario. The Carb scenario showed the highest annual average with 15.7 M Mg CO2eq yr–1, which was 2.0 M Mg CO2eq yr–1 above BAU.
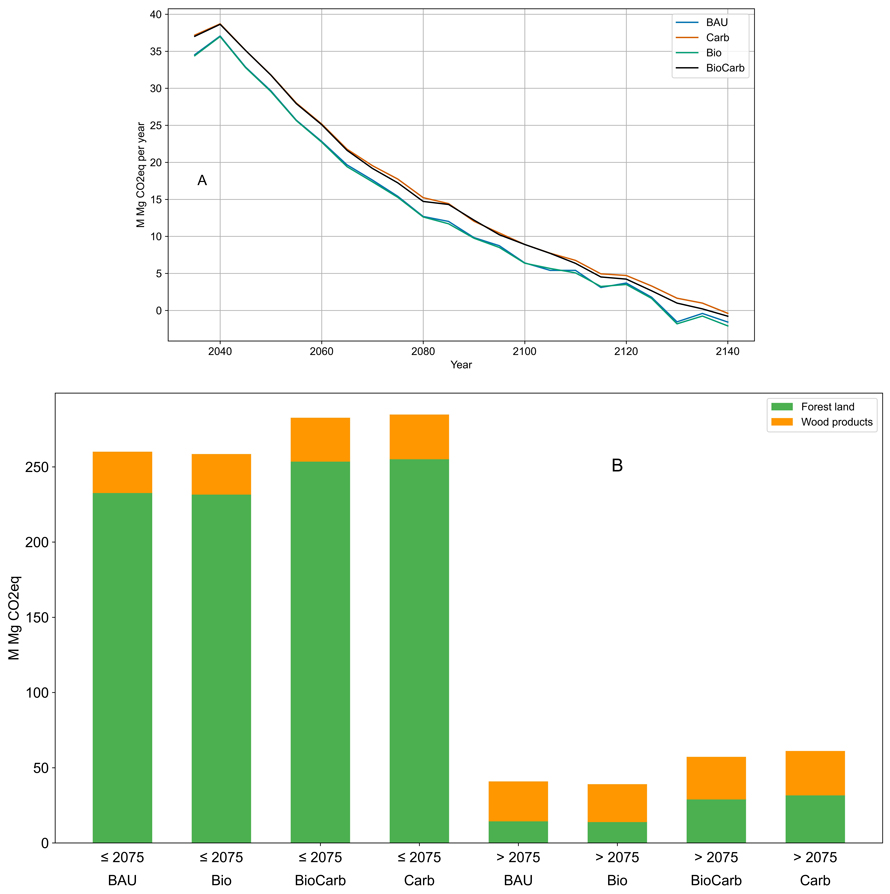
Fig. 6. A: Overall net greenhouse gas (GHG) fluxes of the Norwegian forest sector in the 2025–2140 period, expressed in million megagram of CO2equivalents per year (M Mg CO2eq yr–1). B: Overall net GHG fluxes divided into Forest land (living and dead wood and soil) and Wood products (harvesting, processing, and use of wood products) summed for two periods: up to 2075 and beyond 2075. Positive numbers are net sequestration. Scenarios are business-as-usual (BAU), carbon policy (Carb), biodiversity policy (Bio), and their combination (BioCarb).
GHG fluxes were categorized into ‘Forest land’ and ‘Wood products’ for two periods: 2025–2075 (referred to as ‘≤ 2075’) and 2080–2140 (‘> 2075’) (Fig. 6B). Up to 2075, Forest land, which includes fluxes from dead wood, soil, and living biomass, had the highest average annual net GHG flux with 23.2 M Mg CO2eq yr⁻¹ in Carb, or 2.0 M Mg CO2eq yr⁻¹ more than in BAU. The Wood products category accounted for fluxes from machinery, transportation, processing, storage, substitution, and waste; average figures were very similar between scenarios, ranging from 2.5 in the BAU and Bio scenarios to 2.7 M Mg CO2eq yr⁻¹ in the Carb and BioCarb scenarios.
During the period after 2075, the Carb scenario reported the highest annual average net GHG flux in Forest land with 2.9 M Mg CO2eq yr⁻¹, 1.6 M Mg CO2eq yr⁻¹ above the BAU scenario. The Carb scenario also showed the highest annual average net Wood products GHG flux with 2.7 M Mg CO2eq yr⁻¹, exceeding the BAU scenario by only 0.3 M Mg CO2eq yr⁻¹.
3.4 Forest management
Forest management in the BAU scenario was shaped by productivity. The High-intensity MIC was implemented in 57% of the high productivity land, 47% in medium productivity land, and 35 % of the low productivity land. However, in low-productive land, High-intensity, No Management and No Investment were similar (Fig. 7). Seeing all land together, we observed that the implementation of the carbon policy led to a reduction in High-intensity management by about 10% compared to BAU. Areas under No Management increased by about 16% in both BioCarb and Carb scenario from base levels.
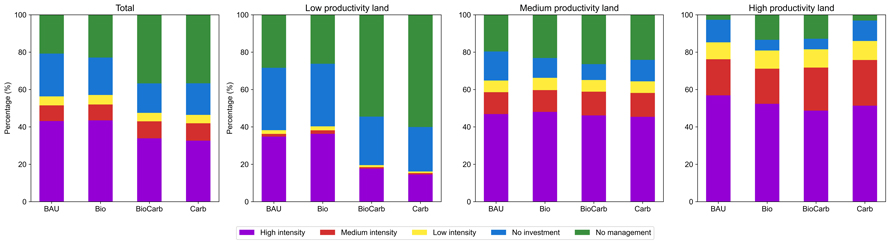
Fig. 7. Five different forest management intensity alternatives: High Intensity, Medium Intensity, Low Intensity, No Investment, and No Management expressed in percentage of total productive forest land, and grouped by low, medium, and high productivity land (site index levels). Scenarios are business-as-usual (BAU), carbon policy (Carb), biodiversity policy (Bio), and their combination (BioCarb). View larger in new window/tab.
In the presence of the carbon policy, No Management, i.e. set-asides, became the predominant alternative on low-productive land, being implemented on 54% of the land in the BioCarb scenario and on 60% of the area in the Carb scenario. However, on high productivity land, the implementation of biodiversity policy as in Bio and BioCarb resulted in the No Management MIC increasing to 13% of the land area from 3% in BAU and Carb. The No Investment MIC decreased from 33% in BAU to 24% in Carb of the low-productive land. The Low and Medium Intensity MICs were implemented on larger areas with higher productivity but remained stable across scenarios.
Fig. 8 shows a spatial distribution map of forest management intensity; definitions are given in Table 1. High Intensity management was prevalent in the southern regions for all scenarios. When contrasting the policy scenarios with BAU, a shift towards No Management (set-aside) in the southern and western coast in the Bio policy was observed alongside more set-aside in higher-altitude, continental areas in the Carb and BioCarb scenarios.
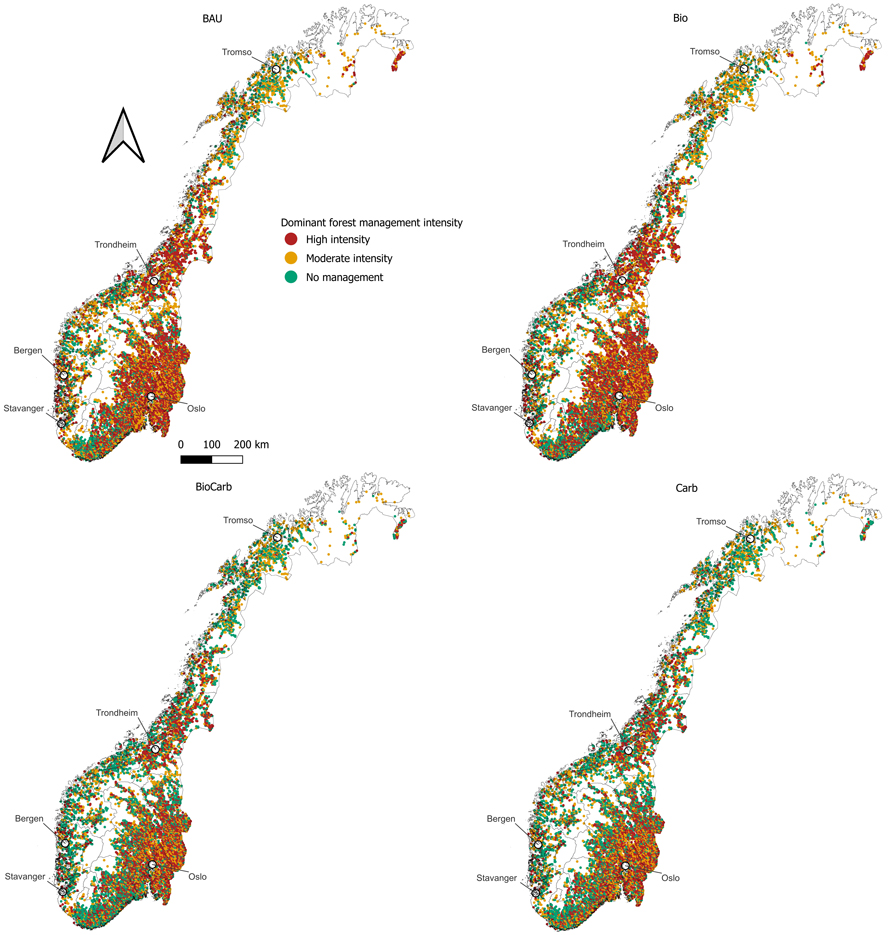
Fig. 8. Spatial distribution of predominant forest management intensities in productive forest in Norway. Scenarios are business-as-usual (BAU), carbon policy (Carb), biodiversity policy (Bio), and their combination (BioCarb). View larger in new window/tab.
4 Discussion
4.1 Impacts of policies
This study quantifies impacts of a carbon policy, a biodiversity policy and a combined policy on the management on Norwegian forests and its potential to deliver multiple ecosystem services. While all policy scenarios yielded lower timber harvest than BAU, carbon sequestration was highest under the carbon policy. However, the impacts of a carbon price of 100 € Mg CO2eq–1 were considerably smaller than what Pohjola et al. (2018) found in a comparable study in Finland at a carbon price of 30 € Mg CO2eq–1 where the harvest level was reduced by 50% in the short term and 20% in the long term. Also, Sjølie et al. (2013a) applied the same forest sector model as us but another forest growth simulator for Norway to study impacts of carbon pricing and found harvest levels to be reduced by up to 40% for a carbon price of 100 € Mg CO2eq–1. Our approach shares multiple similarities to Sjølie et al. (2013a), but also to Pohjola et al. (2018) in terms of forest growth simulation and forest-sector optimization, and carbon pricing. Pohjola et al. (2018) was based on a carbon rent scheme while ours related to the flux which Lintunen et al. (2016) proved yield the same economic incentives. Thus, other factors could explain the discrepancy between our results and the two comparable studies. Trade is known to steer consequences of carbon and biodiversity policies (Sun and Sohngen 2009; Schier et al. 2022), and where Sjølie et al. (2013a) and Pohjola et al. (2018) allowed for increased imports, trade was fixed to BAU levels in our study. To study the effects of trade on our results, we carried out additional runs were import and export were not constrained to base level (results not shown) and found that harvest levels were reduced by 46% and 47% in the Carb and BioCarb scenarios, respectively. Thus, how trade is allowed to change or treated in the model set-up in small, open economies clearly has huge effects on domestic harvest levels and thus carbon fluxes. Allowing for changes in trade levels, the harvest level reduction was 5% in the Bio scenario (results not shown). We thus conclude that it is the carbon pricing that steers the harvest reduction in the BioCarb policy. Another factor that also could contribute to the gaps between model outputs include different forest conditions in Finland and Norway. While 43.5% of Norway’s forest lands are older than 80 years (Svensson et al. 2021), the same number for Finland is 27.5% (LUKE 2022). Older forests have fewer options of shifting forest management towards activities that yield higher carbon sequestration. The Norwegian forests have grown older the last decade. Finally, differences in simulators, forest dynamics functions and forest management alternatives may have impacted the potential for carbon sequestration. According to Lintunen et al. (2015), thinning intensity and harvest timing varies in the model used by Pohjola et al. (2018) but the total set of management options is hard to compare.
Carbon sequestration decreased substantially over time, reaching below zero at the end of the modeling horizon for all scenarios. By implementing the carbon policy, the carbon net balance remained positive for all years except for the last period, yet the numeric differences compared to BAU were minor. Pohjola et al. (2018) observed that while forest carbon policy could lead to significant and immediate increases in carbon sinks, even at low carbon prices, the carbon sink diminishes over time despite high carbon payment. Guo and Gong (2017) also found that while a higher carbon price led to an increase in forest carbon stocks, the rate of net carbon sequestration decreased over time. Similar pattern of forests turning into net source was found for a study area in southern Finland (Akujärvi et al. 2021), while another study based on the same Norwegian NFI data as we employed (Vergarechea et al. 2023), found substantial variation in forest carbon fluxes over time and between scenarios. As Norwegian forests are becoming older (Svensson and Dalen 2021), its future sink capacity may be considerably reduced. The findings align with the conclusions of Korosuo et al. (2023) that highlight the observed increased mortality and reduced increment of European forests and project continued reduction in the carbon sink capacity over the next decades.
Timber prices surged in the Carb scenario. Extended rotations, permanent set-asides on low-productive land and decreased timber supply caused by carbon pricing are findings supported by previous studies (Niinimäki et al. 2013; Tahvonen et al. 2013; Pukkala 2020) which in the presence of downward-sloping demand curves, cause prices to rise. Carbon pricing leads to higher opportunity costs of harvesting, sparked by the foregone carbon sequestration payment upon harvest and in addition taxes caused by the immediate emissions. The economic value of future carbon sequestration in the next rotation is discounted with the interest rate. Thus, harvest only gets profitable at very high timber prices. The Bio scenario had minor impact on timber prices, probably due to the possibilities of substituting the restricted hardwood species with other species and hardwood’s minor role in the timber markets. In contrast, the BioCarb scenario suggests that the synergistic effects of both biodiversity and carbon policies amplify the scarcity and cost of timber. As Sjølie et al. (2013a) and Pohjola et al. (2018) observed, exclusion of market responses to consequential policies in large-scale studies lead to incorrect estimates of adaptation to policies, resource scarcity, societal costs and consequences.
While the Carb policy gives economic incentives to sequester more carbon and emit less GHG, the Bio policy was instrumentalized as a set of hard constraints where forests with certain characteristics were not allowed to be harvested. The designs were chosen due to the availability of carbon tax levels and the absence of reasonable or realistic tax levels for biodiversity. The Carb policy enhanced the old forest areas more than the Bio policy (Fig. 5A), which might be explained by the policy design. To maximize the objective function under Bio, stands may be harvested to avoid the 160-years ban. Under Carb, the pricing scheme is put in effect from the first period thus avoiding such adaptations to future restrictions. While the perfect-foresight assumption of the agents is extreme, yet moderated by discounting, some forest owners would presumably adapt to an anticipated ban of harvesting certain forest types. Intertemporal optimization models can be modified to reflect various degrees of foresight of future policy and market changes (Sjølie et al. 2011a).
4.2 Implications for policy
The dominant forest management strategy in both the BAU and Bio scenario was High Intensity. However, implementing the Bio policy led to more set-asides in high productivity land with consequently more old forest and larger volumes of the targeted broadleaves species. The carbon policy, on the other hand, led to more set-asides with a significant expansion of old-forest area on low-productive land, but not on high-productive land. Furthermore, a combined carbon and biodiversity policy led to the largest decrease in total timber harvest volume and the largest expansion of old forest areas. The volumes of the targeted broadleaves species increased in all scenarios, but no synergistic effect was observed for the two policies, as levels were similar for Bio and BioCarb.
Using the attributes defined in the Bio policy as indicators of biodiversity, we observed an increase in biodiversity across all scenarios yet most in BioCarb. Old forests were projected to expand from their reported level in 2020 of 3.3% of the national productive forest area (Stokland et al. 2020) to 21% of forest land area in year 2140 in BAU, together with a slight increase in harvest level. Thus, current trends, where distribution is observed to be more skewed as old-forest areas are expanding (Svensson and Dalen 2021) are expected to continue. However, even if also forage and warm broadleaves volumes grow in all scenarios, there is a trade-off between timber harvest and biodiversity, as the levels of all biodiversity indicators exceed BAU levels while timber harvest is lower, supported by previous findings (Ceccherini et al. 2020; Blattert et al. 2023). The trade-off between timber harvest and carbon sequestration can be observed from the lower harvest levels and higher carbon uptake in the Carb scenario than in the BAU scenario. However, the additional carbon uptake in Carb was limited, yielding another 1.18 M Mg CO2eq by the year 2140 compared to BAU, in opposition to a 2.2 M m3 (15 %) decrease in timber harvest.
Our simulation-optimization results showed that in the absence of new policies, timber harvest will increase over the next century, driven by forests that are growing older and thus mature for harvest and the growing demand for wood, in line with Nepal et al. (2021) of global coniferous timber demand increase. In all scenarios, initial timber harvest dropped before gradually increasing. This dynamics might be due to initial suboptimal stocking in older stands which makes it profitable to increase harvest to replace the stands in the simulation-optimization approach.
On high-productive lands, base scenario management intensity was maintained under the Carb policy, while Bio pushed towards more set-asides. In the combined BioCarb policy, Bio management intensity levels were maintained, indicating that the biodiversity regulations dominated the combined policy on high-productive land. Opposite effects were found on low-productive lands, with management intensity being similar in Bio as in BAU, but BioCarb and Carb scenarios providing similar outcomes with substantially more set-asides. Thus, the carbon policy was for these sites the dominant policy shaping management. Consequently, the two policies differed in geographical impacts. While the Bio policy gave more set-asides along the southern and western coasts of Norway rich in endemic warm tree species, the Carb policy reduced management intensity and harvests on continental, higher-altitude areas with lower productivity and fewer tree species. Medium-productive land was hardly impacted by either policy, in terms of management intensity, harvest level and old forest area. Medium-productive land does not have the same species composition as high-productive lands, thus partly fell outside the target in Bio. Since the age threshold for old forests was set independently of site productivity, it was most profitable to take low-productive lands out of production. The continuation of BAU management on medium-productive land under the Carb policy are presumably due to a combination of factors like faster regrowth after harvest on medium-productive than on low-productive land (Pukkala 2020) and increasing opportunity costs of setting aside land as timber prices rise (Busby et al. 2007).
Low-productive forest areas that constitute almost half (44.7%) of the productive forest landbase experience the largest relative reduction in harvest volume in the presence of the Carb policy and ends up with the lion’s share of old forest, even more so in the long term. This indicates that setting aside low-productive forests is a cost-effective measure to enhance forest biodiversity, in line with previous studies (Ekvall et al. 2013; Pukkala 2020). However, high-productive forests have richer biodiversity (Gjerde et al. 2005; Hämäläinen et al. 2018), more multifunctional ecosystem services (Jönsson and Snäll 2020) and accommodate to a higher extent important habitats by management (Felton et al. 2017); therefore, a cost-minimizing strategy may not be optimal in terms of conservation outcomes.
4.3 Limitations and future research
Even if our SOM is tested and calibrated on the Norwegian forest sector, certain limitations should be kept in mind. The simulator mirrors current forestry practice but should preferably be expanded with a broader range of management alternatives and potential species composition under climate change (Löf et al. 2012). Empirically tested models for forest dynamics is a strength, but when forests grow old, solid data backing the mortality functions are lacking. Climate change is expected to exacerbate disturbance like windstorms, droughts, and disease outbreaks (VKM 2022) while sparking higher growth (Čermák et al. 2017). Process-based growth models can integrate these drivers and have been combined with economic optimization in stand-level analyses (Hyytiäinen et al. 2004; Niinimäki et al. 2012). However, they represent another branch of research than large-scale simulation and market optimization. Collaborative software frameworks of forest growth simulation through integration of multiple models are an alternative path to explore impacts of forest management across different landscape levels and forest ecosystems (Dufour-Kowalski et al. 2012). The extensive set-asides observed under the carbon policy indicated that with a carbon price of 100 € Mg CO2eq–1, it was optimal to never harvest low-productive stands. However, if the risk of mortality or calamities increases, the set-aside may no longer be optimal. Another simplification is the underlying assumption of agent behavior in the model, where the three agent groups each have separate objectives. However, there is considerable diversity within the groups, most pivotal within the forest owner population (Majumdar et al. 2008; Favada et al. 2009; Bashir 2021). Incorporating more specific behavior of the forest owner types linked to the forest landbase (Pohjola et al. 2018) might improve projections.
While the biodiversity targets were chosen because of their known importance for biodiversity, policy relevance and availability, multiple alternative indicators exist (Oettel and Lapin 2021). Dead wood would also be a relevant attribute (Stokland et al. 2004). Contrasting management, harvest and ecological outcomes between different indicators is a relevant research theme for better understanding the costs and effectiveness of policies. An alternative method is backcasting, where a future objective is set and the policies that would lead to the societal or policy goals are identified with the associated costs (Gordon 2015; Sjølie et al. 2016).
Previous studies of distributional impacts of forest policies include Riera et al. (2007) and Zhang et al. (2023); however, few studies have compared impacts of policies across site productivity gradients in a regional setting. Our findings add to the literature of ex-ante forest policy analyses that elucidate outcomes from policies that go beyond the stated policy aims. By paying attention to wide economic, social, and environmental impacts, policymakers have a better basis for designing effective policies with high legitimacy and low costs. With the uncertainty of future forest policies, like the EU policies which may constrain harvest and management (EU 2021), testing impacts of candidate policy measures on the forest sector should be a prioritized area of research where a broad set of social, economic, and environmental consequences ought to be evaluated.
5 Conclusion
Our study aimed to unveil impact of carbon and biodiversity policies on timber harvest, ecological outcomes, GHG fluxes, and forest management across site productivity gradients in Norwegian forests. Our approach is based on economic theory and empirical forest dynamics models. We found that carbon and biodiversity policies vary in impacts across site productivity classes. While the biodiversity policy led to lower management intensity and more set-asides on high-productive land, its impacts on low-productive land were minor. In contrast, the carbon policy gave lower management intensity and more set-aside on low-productive lands while base scenario management on high-productive forest was largely maintained. Geographical impacts were given by site productivity with set-aside being accentuated in coastal areas in the biodiversity scenario and in higher-altitude continental areas in the carbon scenario. We found that old forest areas will increase substantially in the absence of policies but slightly more with the biodiversity policy while under the carbon policy, the expansion would be considerable. However, this comes at the expense of lower harvest volumes. Carbon sequestration was projected to decline considerably over time but may be enhanced to some extent by the carbon policy. Our study offers insight into effectiveness, synergies, trade-offs, and geographical distributional impacts of policies and offers support to policymakers in designing effective policies.
Data availability
Norwegian National Forest Inventory (NFI) 2015–2019 data are not publicly available but can be requested from the Norwegian Institute of Bioeconomy Research (NIBIO). The TreeSim model is available in Github.com. Detailed descriptions and specifications of NorFor are provided in the Supplementary file S2. Further inquiries can be directed to the corresponding author.
Author’s contributions
Conceptualization (H.S.; L.L.; F.A.), data curation (H.S.; L.L.; A.N.), data analysis (H.S.; L.L.; F.A.), writing – original draft preparation (L.L.; H.S.; F.A.), visualization (L.L.; H.S.), writing – review and editing, (L.L.; H.S.; F.A.; A.N.), project administration (H.S.). All authors have read and agreed to the published version of the manuscript.
Funding
Funding for this research was provided by the Research Council of Norway (project number 326843) and the Inland Norway University of Applied Sciences.
References
Aggestam F, Konczal A, Sotirov M, Wallin I, Paillet Y, Spinelli R, Lindner M, Derks J, Hanewinkel M, Winkel G (2020) Can nature conservation and wood production be reconciled in managed forests? A review of driving factors for integrated forest management in Europe. J Environ Manage 268, article id 110670. https://doi.org/10.1016/j.jenvman.2020.110670.
Akujärvi A, Repo A, Akujärvi AM, Liski J (2021) Bridging mapping and simulation modelling in the ecosystem service assessments of boreal forests: effects of bioenergy production on carbon dynamics. For Ecosyst 8, article id 4. https://doi.org/10.1186/s40663-021-00283-2.
Amacher GS, Christine Conway M, Sullivan J, Gregory SA (2003) Econometric analyses of nonindustrial forest landowners: is there anything left to study? J For Econ 9: 137–164. https://doi.org/10.1078/1104-6899-00028.
Angelstam P, Andersson K, Axelsson R, Elbakidze M, Jonsson B, Roberge J-M (2011) Protecting forest areas for biodiversity in Sweden 1991–2010: the policy implementation process and outcomes on the ground. Silva Fenn 45: 1111–1133. https://doi.org/10.14214/sf.90.
Angelstam P, Manton M, Green M, Jonsson B-G, Mikusiński G, Svensson J, Maria Sabatini F (2020) Sweden does not meet agreed national and international forest biodiversity targets: a call for adaptive landscape planning. Landsc Urban Plan 202, article id 103838. https://doi.org/10.1016/j.landurbplan.2020.103838.
Augustynczik ALD, Gutsch M, Basile M, Suckow F, Lasch P, Yousefpour R, Hanewinkel M (2020) Socially optimal forest management and biodiversity conservation in temperate forests under climate change. Ecol Econ 169, article id 106504. https://doi.org/10.1016/j.ecolecon.2019.106504.
Bashir A (2021) Non-industrial private forest owners’ attitudes and forest management decisions. Doctoral thesis, Inland Norway University of Applied Sciences. https://hdl.handle.net/11250/2833277.
Beach RH, Pattanayak SK, Yang J-C, Murray BC, Abt RC (2005) Econometric studies of non-industrial private forest management: a review and synthesis. For Policy Econ 7: 261–281. https://doi.org/10.1016/S1389-9341(03)00065-0.
Bendiksen E, Brandrud TE, Røsok Ø, Framstad E, Gaarder G, Hofton TH, Jordal JB, Klepsland JT, Reiso S (2008) Boreale lauvskoger i Norge. Naturverdier og udekket vernebehov. [Boreal deciduous forests in Norway. Nature values and remaining need for protection]. NINA Rapp 367. http://hdl.handle.net/11250/2467526.
Bergseng E, Ask JA, Framstad E, Gobakken T, Solberg B, Hoen HF (2012) Biodiversity protection and economics in long term boreal forest management – a detailed case for the valuation of protection measures. For Policy Econ 15: 12–21. https://doi.org/10.1016/j.forpol.2011.11.002.
Blattert C, Mönkkönen M, Burgas D, Di Fulvio F, Toraño Caicoya A, Vergarechea M, Klein J, Hartikainen M, Antón-Fernández C, Astrup R (2023) Climate targets in European timber-producing countries conflict with goals on forest ecosystem services and biodiversity. Commun Earth Environ 4, article id 119. https://doi.org/10.1038/s43247-023-00771-z.
Blingsmo KR, Veidahl A (1992) Functions for gross price of standing spruce and pine trees. Norwegian Forest Research Institute, Ås.
Borges P, Martins I, Bergseng E, Eid T, Gobakken T (2016) Effects of site productivity on forest harvest scheduling subject to green-up and maximum area restrictions. Scand J For Res 31: 507–516. https://doi.org/10.1080/02827581.2015.1089931.
Breidenbach J, Granhus A, Hylen G, Eriksen R, Astrup R (2020) A century of National Forest Inventory in Norway – informing past, present, and future decisions. For Ecosyst 7, article id 46. https://doi.org/10.1186/s40663-020-00261-0.
Brukas V, Felton A, Lindbladh M, Sallnäs O (2013) Linking forest management, policy and biodiversity indicators – a comparison of Lithuania and Southern Sweden. For Ecol Manag 291: 181–189. https://doi.org/10.1016/j.foreco.2012.11.034.
Buongiorno J (2015) Income and time dependence of forest product demand elasticities and implications for forecasting. Silva Fenn 49, article id 1395. https://doi.org/10.14214/sf.1395.
Burton P, Bergeron Y, Bogdanski B, Juday G, Kuuluvainen T, Mcafee B, Ogden A, Teplyakov V, Alfaro R, Francis DA, Gauthier S, Hantula J (2010) Sustainability of boreal forests and forestry in a changing environment. In: Mery G, Katila P, Galloway G, Alfaro RI, Kanninen M, Lobovikov M, Varjo J (eds) Forests and society – responding to global drivers of change. International Union of Forest Research Organizations (IUFRO), Vienna, Austria, pp 249–282.
Busby GM, Montgomery CA, Latta GS (2007) The opportunity cost of forest certification on private land in Western Oregon. West J Appl For 22: 55–60. https://doi.org/10.1093/wjaf/22.1.55.
Ceccherini G, Duveiller G, Grassi G, Lemoine G, Avitabile V, Pilli R, Cescatti A (2020) Abrupt increase in harvested forest area over Europe after 2015. Nature 583: 72–77. https://doi.org/10.1038/s41586-020-2438-y.
Čermák P, Rybníček M, Žid T, Andreassen K, Børja I, Kolář T (2017) Impact of climate change on growth dynamics of Norway spruce in south-eastern Norway. Silva Fenn 51, article id 1781. https://doi.org/10.14214/sf.1781.
Chas-Amil ML, Buongiorno J (2000) The demand for paper and paperboard: econometric models for the European Union. Appl Econ 32: 987–999. https://doi.org/10.1080/000368400322048.
Convention on Biological Diversity (2011) Text and annexes. United Nations Environment Programme, Montreal.
Cubbage F, Harou P, Sills E (2007) Policy instruments to enhance multi-functional forest management. For Policy Econ 9: 833–851. https://doi.org/10.1016/j.forpol.2006.03.010.
Direktoratet for naturforvaltning (2007) Kartlegging av naturtyper – verdisetting av biologisk mangfold. [Mapping of habitat types – valuation of biological diversity]. DN-håndbok 13 2.utgave 2006, Trondheim. ISBN 978-82-7072-708-7.
Dufour-Kowalski S, Courbaud B, Dreyfus P, Meredieu C, De Coligny F (2012) Capsis: an open software framework and community for forest growth modelling. Ann For Sci 69: 221–233. https://doi.org/10.1007/s13595-011-0140-9.
Duncker PS, Raulund-Rasmussen K, Gundersen P, Katzensteiner K, De Jong J, Ravn HP, Smith M, Eckmüllner O, Spiecker H (2012) How forest management affects ecosystem services, including timber production and economic return: synergies and trade-offs. Ecol Soc 17, article id 50. https://doi.org/10.5751/ES-05066-170450.
Eggers J, Räty M, Öhman K, Snäll T (2020) How well do stakeholder-defined forest management scenarios balance economic and ecological forest values? Forests 11, article id 86. https://doi.org/10.3390/f11010086.
Ekvall H, Bostedt G, Jonsson M (2013) Least-cost allocation of measures to increase the amount of coarse woody debris in forest estates. J For Econ 19: 267–285. https://doi.org/10.1016/j.jfe.2013.05.002.
Elbakidze M, Angelstam P, Andersson K, Nordberg M, Pautov Y (2011) How does forest certification contribute to boreal biodiversity conservation? Standards and outcomes in Sweden and NW Russia. For Ecol Manag 262: 1983–1995. https://doi.org/10.1016/j.foreco.2011.08.040.
EU (2018) Regulation (EU) 2018/841 of the European Parliament and of the Council. EUR-Lex. https://eur-lex.europa.eu/eli/reg/2018/841/oj/eng. Accessed 25 March 2024.
EU (2021) Communication from the Commission to the European Parliament, the Council, the European Economic and Social Committee and the Committee for the Regions: new EU forest strategy for 2030. COM/2021/572 Final. https://eur-lex.europa.eu/legal-content/EN/TXT/?uri=CELEX%3A52021DC0572. Accessed 12 October 2023.
EU (2023) Guidance on the development of public and private payment schemes for forest ecosystem services. SWD 285 final, Brussels.
Fahey TJ, Woodbury PB, Battles JJ, Goodale CL, Hamburg SP, Ollinger SV, Woodall CW (2010) Forest carbon storage: ecology, management, and policy. Front Ecol Environ 8: 245–252. https://doi.org/10.1890/080169.
FAO (2020a) Global Forest Resources Assessment 2020: main report. FAO, Rome.
FAO (2020b) Global Forest Resources Assessment (FRA) 2020: Norway report. Food and Agriculture Organization of the United Nations, Rome.
FAO (2022) Global forest sector outlook 2050: assessing future demand and sources of timber for a sustainable economy – background paper for The State of the World’s Forests 2022. Forestry Working Paper 31. https://doi.org/10.4060/cc2265en.
Favada IM, Karppinen H, Kuuluvainen J, Mikkola J, Stavness C (2009) Effects of timber prices, ownership objectives, and owner characteristics on timber supply. For Sci 55: 512–523. https://doi.org/10.1093/forestscience/55.6.512.
Felton A, Sonesson J, Nilsson U, Lämås T, Lundmark T, Nordin A, Ranius T, Roberge J-M (2017) Varying rotation lengths in northern production forests: implications for habitats provided by retention and production trees. Ambio 46: 324–334. https://doi.org/10.1007/s13280-017-0909-7.
Fjellstad KB, Skrøppa T (2020) State of forest genetic resources in Norway 2020 to the FAO 2nd report on State of the World´s Forest Genetic Resources. NIBIO report 6, no. 167. https://hdl.handle.net/11250/2720189.
Fridén A, D’Amato D, Ekström H, Iliev B, Nebasifu A, May W, Thomsen M, Droste N (2024) Mapping two centuries of forest governance in Nordic countries: an open access database. For Policy Econ 160, article id 103142. https://doi.org/10.1016/j.forpol.2023.103142.
Gjerde I, Sætersdal M, Rolstad J, Olaf Storaunet K, Blom HH, Gundersen V, Heegaard E (2005) Productivity-diversity relationships for plants, bryophytes, lichens, and polypore fungi in six northern forest landscapes. Ecography 28: 705–720. https://doi.org/10.1111/j.2005.0906-7590.04249.x.
Golden D, Smith MA, Colombo S (2011) Forest carbon management and carbon trading: a review of Canadian forest options for climate change mitigation. For Chron 87: 625–635. https://doi.org/10.5558/tfc2011-069.
Gordon A (2015) Implementing backcasting for conservation: determining multiple policy pathways for retaining future targets of endangered woodlands in Sydney, Australia. Biol Conserv 181: 182–189. https://doi.org/10.1016/j.biocon.2014.10.025.
Granhus A (2021) Miljøhensyn ved hogst og skogkultur. [Environmental Considerations in Logging and Forestry]. Bærekraftig Skogbruk i Norge. Norwegian Institute of Bioeconomy Research (NIBIO). https://www.skogbruk.nibio.no/miljohensyn-ved-hogst-og-skogkultur. Accessed 13 April 2023.
Guo J, Gong P (2017) The potential and cost of increasing forest carbon sequestration in Sweden. J For Econ 29: 78–86. https://doi.org/10.1016/j.jfe.2017.09.001.
Haila Y (1994) Preserving ecological diversity in boreal forests: ecological background, research, and management. Finn Zool Bot Publ Board 31: 203–217.
Hämäläinen A, Strengbom J, Ranius T (2018) Conservation value of low-productivity forests measured as the amount and diversity of dead wood and saproxylic beetles. Ecol Appl 28: 1011–1019. https://doi.org/10.1002/eap.1705.
Hyytiäinen K, Hari P, Kokkila T, Mäkelä A, Tahvonen O, Taipale J (2004) Connecting a process-based forest growth model to stand-level economic optimization. Can J For Res 34: 2060–2073. https://doi.org/10.1139/x04-056.
Im EH, Adams DM, Latta GS (2007) Potential impacts of carbon taxes on carbon flux in western Oregon private forests. For Policy Econ 9: 1006–1017. https://doi.org/10.1016/j.forpol.2006.09.006.
Johnson KN, Scheurman L (1977) Techniques for prescribing optimal timber harvest and investment under different objectives – discussion and synthesis. Forest science: Monograph 18.
Johnston C, Withey P (2017) Managing forests for carbon and timber: a Markov decision model of uneven-aged forest management with risk. Ecol Econ 138: 31–39. https://doi.org/10.1016/J.ECOLECON.2017.03.023.
Jönsson M, Snäll T (2020) Ecosystem service multifunctionality of low-productivity forests and implications for conservation and management. J Appl Ecol 57: 695–706. https://doi.org/10.1111/1365-2664.13569.
Juutinen A, Ahtikoski A, Lehtonen M, Mäkipää R, Ollikainen M (2018) The impact of a short-term carbon payment scheme on forest management. For Policy Econ 90: 115–127. https://doi.org/10.1016/j.forpol.2018.02.005.
Kaya A, Bettinger P, Boston K, Akbulut R, Ucar Z, Siry J, Merry K, Cieszewski C (2016) Optimisation in forest management. Curr For Rep 2: 1–17. https://doi.org/10.1007/s40725-016-0027-y.
Kayes I, Mallik A (2020) Boreal forests: distributions, biodiversity, and management. In: Leal Filho W, Azul A, Brandli L, Lange Salvia A, Wall T (eds) Life on land. Encyclopedia of the un sustainable development goals. Springer, Cham. https://doi.org/10.1007/978-3-319-71065-5_17-1.
Keenan RJ, (Hamish) Kimmins JP (1993) The ecological effects of clear-cutting. Environ Rev 1: 121–144. https://doi.org/10.1139/a93-010.
Korosuo A, Pilli R, Abad Viñas R, Blujdea VNB, Colditz RR, Fiorese G, Rossi S, Vizzarri M, Grassi G (2023) The role of forests in the EU climate policy: are we on the right track? Carbon Balance Manag 18, article id 15. https://doi.org/10.1186/s13021-023-00234-0.
Kuuluvainen T, Gauthier S (2018) Young and old forest in the boreal: critical stages of ecosystem dynamics and management under global change. For Ecosyst 5, article id 26. https://doi.org/10.1186/s40663-018-0142-2.
Kuusela K (1992) The boreal forests: an overview. In: Dembner SA (ed) Unasylva 170, Boreal forests. https://www.fao.org/3/u6850e/u6850e03.htm#the%20boreal%20forests:%20an%20overview. Accessed 19 April 2023.
Landbruksdirektoratet (2022) Foryngelse og miljøhensyn. [Regeneration and environmental considerations]. https://www.landbruksdirektoratet.no/nb/statistikk-og-utviklingstrekk/utviklingstrekk-i-skogbruket/foryngelse-og-miljohensyn. Accessed 19 April 2023.
Lintunen J, Laturi J, Uusivuori J (2015) Finnish Forest and Energy Policy model (FinFEP). A model description. Natural resources and bioeconomy studies 59, Natural Resources Institute Finland (Luke). http://urn.fi/URN:ISBN:978-952-326-119-8.
Lintunen J, Laturi J, Uusivuori J (2016) How should a forest carbon rent policy be implemented? For Policy Econ 69: 31–39. https://doi.org/10.1016/j.forpol.2016.04.005.
Löf M, Brunet J, Hickler T, Birkedal M, Jensen A (2012) Restoring broadleaved forests in southern Sweden as climate changes. In: Stanturf J, Madsen P, Lamb D (eds) A goal-oriented approach to forest landscape restoration. Springer Netherlands, Dordrecht, pp 373–391. https://doi.org/10.1007/978-94-007-5338-9_14.
LUKE (2022) Age of forest stands on forest land (1000 ha) by inventory, region and age class. Natural Resources Institute Finland (Luke). https://statdb.luke.fi/PxWeb/pxweb/en/LUKE/LUKE__04%20Metsa__06%20Metsavarat/1.13_Metsikoiden_ikaluokat_metsamaalla.px/. Accessed 15 March 2024.
Majumdar I, Teeter L, Butler B (2008) Characterizing family forest owners: a cluster analysis approach. For Sci 54: 176–184. https://doi.org/10.1093/forestscience/54.2.176.
Malmsheimer RW, Bowyer JL, Fried JS, Gee E, Izlar RL, Miner RA, Munn IA, Oneil E, Stewart WC (2011) Managing forests because C matters: integrating energy, products and land management policy. J For 109: S7–S50. https://doi.org/10.1093/jof/109.s1.S7.
Meteorologisk institutt (2022). Norwegian Meteorological Institute. https://frost.met.no/ex_portingwsklima. Accessed 27 April 2023.
Montgomery CA, Pollak RA, Freemark K, White D (1999) Pricing biodiversity. J Environ Econ Manag 38: 1–19. https://doi.org/10.1006/jeem.1999.1073.
Mustapha W (2016) The Nordic Forest Sector Model (NFSM): Data and model structure. Norwegian University of Life Sciences (NMBU), Ås.
Nabhani A, Sjølie HK (2022) TreeSim: an object-oriented individual tree simulator and 3D visualization tool in Python. SoftwareX 20, article id 101221. https://doi.org/10.1016/j.softx.2022.101221.
Nalle DJ, Montgomery CA, Arthur JL, Polasky S, Schumaker NH (2004) Modeling joint production of wildlife and timber. J Environ Econ Manag 48: 997–1017. https://doi.org/10.1016/j.jeem.2004.01.001.
Nepal P, Johnston C, Ganguly I (2021) Effects on global forests and wood product markets of increased demand for mass timber. Sustainability 13, article id 13943. https://doi.org/10.3390/su132413943.
Niinimäki S, Tahvonen O, Mäkelä A (2012) Applying a process-based model in Norway spruce management. For Ecol Manag 265: 102–115. https://doi.org/10.1016/j.foreco.2011.10.023.
Niinimäki S, Tahvonen O, Mäkelä A, Linkosalo T (2013) On the economics of Norway spruce stands and carbon storage. Can J For Res 43: 637–648. https://doi.org/10.1139/cjfr-2012-0516.
Nordén J, Penttilä R, Siitonen J, Tomppo E, Ovaskainen O (2013) Specialist species of wood‐inhabiting fungi struggle while generalists thrive in fragmented boreal forests. J Ecol 101: 701–712. https://doi.org/10.1111/1365-2745.12085.
Norwegian Bioenergy Association (2023) The Norwegian Bioenergy Association. https://nobio.no/bioenergiens-rolle-i-energisystemet/. Accessed 22 March 2024.
Oettel J, Lapin K (2021) Linking forest management and biodiversity indicators to strengthen sustainable forest management in Europe. Ecol Indic 122, article id 107275. https://doi.org/10.1016/j.ecolind.2020.107275.
Olkkonen V, Syri S (2016) Spatial and temporal variations of marginal electricity generation: the case of the Finnish, Nordic, and European energy systems up to 2030. J Clean Prod 126: 515–525. https://doi.org/10.1016/j.jclepro.2016.03.112.
Pingoud K, Ekholm T, Sievänen R, Huuskonen S, Hynynen J (2018) Trade-offs between forest carbon stocks and harvests in a steady state – a multi-criteria analysis. J Environ Manage 210: 96–103. https://doi.org/10.1016/j.jenvman.2017.12.076.
Pohjanmies T, Triviño M, Le Tortorec E, Mazziotta A, Snäll T,. Mönkkönen M (2017) Impacts of forestry on boreal forests: an ecosystem services perspective. Ambio 46: 743–755. https://doi.org/10.1007/s13280-017-0919-5.
Pohjanmies T, Eyvindson K, Mönkkönen M (2019) Forest management optimization across spatial scales to reconcile economic and conservation objectives. PLOS ONE 14, article id e0218213. https://doi.org/10.1371/journal.pone.0218213.
Pohjanmies T, Eyvindson K, Triviño M, Bengtsson J, Mönkkönen M (2021) Forest multifunctionality is not resilient to intensive forestry. Eur J For Res 140: 537–549. https://doi.org/10.1007/s10342-020-01348-7.
Pohjola J, Laturi J, Lintunen J, Uusivuori J (2018) Immediate and long-run impacts of a forest carbon policy – market-level assessment with heterogeneous forest owners. J For Econ 32: 94–105. https://doi.org/10.1016/j.jfe.2018.03.001.
Pukkala T (2011) Optimizing forest management in Finland with carbon subsidies and taxes. For Policy Econ 13: 425–434. https://doi.org/10.1016/j.forpol.2011.06.004.
Pukkala T (2020) At what carbon price forest cutting should stop. J For Res 31: 713–727. https://doi.org/10.1007/s11676-020-01101-1.
Richards KR, Stokes C (2004) A review of forest carbon sequestration cost studies: a dozen years of research. Clim Change 63: 1–48. https://doi.org/10.1023/B:CLIM.0000018503.10080.89.
Riera P, Aranda L, Mavsar R (2007) Efficiency and equity of forest policies: a graphic analysis using the partial equilibrium framework. For Policy Econ 9: 852–861. https://doi.org/10.1016/j.forpol.2006.03.011.
Sabatini F, Andrade RB de, Paillet Y, Ódor P, Bouget C, Campagnaro T, Gosselin F, Janssen P, Mattioli W, Nascimbene J, Sitzia T, Kuemmerle T, Burrascano S (2018) Trade‐offs between carbon stocks and biodiversity in European temperate forests. Glob Change Biol 25: 536–548. https://doi.org/10.1111/gcb.14503.
Samuelson PA (1952) The transfer problem and transport costs: the terms of trade when impediments are absent. Econ J 62: 278–304. https://doi.org/10.2307/2227005.
Savilaakso S, Johansson A, Häkkilä M, Uusitalo A, Sandgren T, Mönkkönen M, Puttonen P (2021) What are the effects of even-aged and uneven-aged forest management on boreal forest biodiversity in Fennoscandia and European Russia? A systematic review. Environ Evid 10, article id 1. https://doi.org/10.1186/s13750-020-00215-7.
Schier F, Iost S, Seintsch B, Weimar H, Dieter M (2022) Assessment of possible production leakage from implementing the EU biodiversity strategy on forest product markets. Forests 13, article id 1225. https://doi.org/10.3390/f13081225.
Silbaugh JM, Betters DR (1997) Biodiversity values and measures applied to forest management. J Sustain For 5: 235–248. https://doi.org/10.1300/J091v05n01_04.
Simangunsong BCH, Buongiorno J (2001) International demand equations for forest products: a comparison of methods. Scand J For Res 16: 155–172. https://doi.org/10.1080/028275801300088242.
Sjølie HK, Latta GS, Adams DM, Solberg B (2011a) Impacts of agent information assumptions in forest sector modeling. J For Econ 17: 169–184. https://doi.org/10.1016/j.jfe.2011.02.009.
Sjølie HK, Latta GS, Gobakken T, Solberg B (2011b) NorFor – a forest sector model of Norway. Model overview and structure. INA fagrapport 18, Department of Ecology and Natural Resource Management Norwegian University of Life Sciences.
Sjølie HK, Latta GS, Solberg B (2013a) Potentials and costs of climate change mitigation in the Norwegian forest sector – does choice of policy matter? Can J For Res 43: 589–598. https://doi.org/10.1139/cjfr-2012-0457.
Sjølie HK, Latta GS, Solberg B (2013b) Potential impact of albedo incorporation in boreal forest sector climate change policy effectiveness. Clim Policy 13: 665–679. https://doi.org/10.1080/14693062.2013.786302.
Sjølie HK, Latta GS, Solberg B (2014) Impacts of the Kyoto Protocol on boreal forest climate change mitigation. Ann For Sci 71: 267–277. https://doi.org/10.1007/s13595-013-0289-5.
Sjølie HK, Latta GS, Solberg B (2016) Combining backcasting with forest sector projection models to provide paths into the future bio-economy. Scand J For Res 31: 708–718. https://doi.org/10.1080/02827581.2016.1186218.
Solberg EJ, Myking T, Austrheim G, Bøhler F, Eriksen R, Speed JDM, Astrup RA (2012) Rogn, osp og selje-Har de en framtid i norsk natur? [Rowan, aspen, and willow – do they have a future in Norwegian nature?]. Norwegian Institute for Nature Research (NINA), Trondheim.
Statistics Norway (2022) Commercial roundwood removals. https://www.ssb.no/en/jord-skog-jakt-og-fiskeri/skogbruk/statistikk/skogavvirkning-for-salg. Accessed 1 November 2023.
Statistics Norway (2023) Forest properties and productive forest area, by type of forest owner 2013–2021. https://www.ssb.no/en/statbank/table/10613/. Accessed 20 September 2023.
Statistics Norway (2024a) Electricity. https://www.ssb.no/en/energi-og-industri/energi/statistikk/elektrisitet. Accessed 22 March 2024.
Statistics Norway (2024b) Energy consumption in households. https://www.ssb.no/en/energi-og-industri/energi/statistikk/energibruk-i-husholdningene. Accessed 22 March 2024.
Stokland JN, Tomter SM, Söderberg U (2004) Development of dead wood indicators for biodiversity monitoring: experiences from Scandinavia. In: Marchetti M (ed) Monitoring and indicators of forest biodiversity in Europe, from ideas to operationality. EFI-Proceedings 51: 207–226.
Stokland JN, Eriksen R, Granhus A (2020) Tilstand og utvikling i skog 2002–2017 for noen utvalgte miljøegenskaper. [Condition and development in forests 2002–2017 for some selected environmental characteristics]. NIBIO-rapport 6, Norwegian Institute of Bioeconomy Research (NIBIO), Ås. https://hdl.handle.net/11250/2721804.
Sun B, Sohngen B (2009) Set-asides for carbon sequestration: implications for permanence and leakage. Clim Change 96: 409–419. https://doi.org/10.1007/s10584-009-9628-9.
Svensson A, Dalen LS (2021) Alder og utviklingstrinn. [Age and development stage]. https://www.skogbruk.nibio.no/alder-og-utviklingstrinn. Norwegian Institute of Bioeconomy Research (NIBIO), Ås. Accessed 11 March 2024.
Svensson A, Eriksen, R, Hylen G, Granhus A (2021) Skogen i Norge. [The forest in Norway]. NIBIO-rapport 7, Norwegian Institute of Bioeconomy Research (NIBIO), Ås. https://hdl.handle.net/11250/2763651.
Sverdrup-Thygeson A, Borg P, Bergsaker E (2008) A comparison of biodiversity values in boreal forest regeneration areas before and after forest certification. Scand J For Res 23: 236–243. https://doi.org/10.1080/02827580802158228.
Tahvonen O, Pihlainen S, Niinimäki S (2013) On the economics of optimal timber production in boreal Scots pine stands. Can J For Res 43: 719–730. https://doi.org/10.1139/cjfr-2012-0494.
Trømborg E, Sjølie HK (2011) Data applied in the forest sector models NorFor and NTMIII. MINA fagrapport 17, Norwegian University of Life Sciences, Ås. https://hdl.handle.net/11250/2647226.
Tveite B, Braastad H (1981) Bonitering for gran, furu og bjørk. [Site quality assessment for spruce, pine, and birch]. Norsk Skogbruk 27: 17–21.
UNFCCC (2015) Paris Agreement. Paris Climate Change Conference, COP 21. United Nations, Climate Change. https://unfccc.int/documents/37107. Accessed 29 September 2023.
van Kooten GC, Binkley CS, Delcourt G (1995) Effect of carbon taxes and subsidies on optimal forest rotation age and supply of carbon services. Am J Agric Econ 77: 365–374. https://doi.org/10.2307/1243546.
Vergarechea M, Astrup R, Fischer C, Øistad K, Blattert C, Hartikainen M, Eyvindson K, Di Fulvio F, Forsell N, Burgas D, Toraño-Caicoya A, Mönkkönen M, Antón-Fernández C (2023) Future wood demands and ecosystem services trade-offs: a policy analysis in Norway. For Policy Econ 147, article id 102899. https://doi.org/10.1016/j.forpol.2022.102899.
VKM (2022) Impacts of climate change on the boreal forest ecosystem. Report 15, Norwegian Scientific Committee for Food and Environment, Oslo.
Wulder MA, Campbell C, White JC, Flannigan M, Campbell ID (2007) National circumstances in the international circumboreal community. For Chron 83: 539–556. https://doi.org/10.5558/tfc83539-4.
Zhang Q, Bista R, Bilsborrow RE, Zhang Z, Huang Q, Song C (2023) Understanding the mediating role of labor out-migration in household income generation and distribution under a reforestation policy in rural China. J Environ Manage 345, article id 118539. https://doi.org/10.1016/j.jenvman.2023.118539.
Total of 119 references.
