Jaakko Repola  ,
Jaana Luoranen,
Saija Huuskonen,
Mikko Peltoniemi,
Päivi Väänänen,
Karri Uotila
,
Jaana Luoranen,
Saija Huuskonen,
Mikko Peltoniemi,
Päivi Väänänen,
Karri Uotila
Biomass models for young planted Norway spruce and naturally regenerated silver birch, aspen and rowan trees
Repola J., Luoranen J., Huuskonen S., Peltoniemi M., Väänänen P., Uotila K. (2024). Biomass models for young planted Norway spruce and naturally regenerated silver birch, aspen and rowan trees. Silva Fennica vol. 58 no. 5 article id 24031. https://doi.org/10.14214/sf.24031
Highlights
- Needle biomass was the greatest tree component of young spruce trees, and its proportion of whole biomass was 40-50%
- The proportion of foliage biomass showed a decreasing tendency with tree height for all tree species
- The existing models (Repola 2008, 2009) were not suitable for predicting spruce and birch biomass growing in young planted stands allocating too much biomass to roots and too little to crown.
Abstract
We developed tree level biomass (dry weight) models for Norway spruce (Picea abies [L.] H. Karst.), silver birch (Betula pendula Roth), rowan (Sorbus aucuparia L.) and aspen (Populus tremula L.) growing in young spruce dominated seedling stands with high mixture of broadleaves. The study material was collected from three planted Norway spruce seedling stands located on mineral soil in southern Finland. Biomass models were estimated by individual tree component (stem, living branches, foliage, stump, and roots with diameter of 2 mm) by using a multi-response approach (seemingly unrelated regression), which estimated the parameters of the sub-models (tree component) simultaneously. Even though the application and generalization of the developed models can be restricted by the limited material, they provide new information of seedling biomass allocation and more reliable biomass predictions for spruce and birch growing in young seedling stand compared with those of the commonly applied biomass models (Repola 2008, 2009) in Finland. Repola’s models (2008, 2009) tended to produce biased predictions for crown and below-ground biomasses of seedlings by allocating too much biomass to roots and too little to needle and branches. In addition, this study provides biomass models for aspen and rowan, which were not previously available.
Keywords
deciduous trees;
Picea abies;
tree biomass;
model;
multi-response
-
Repola,
Natural Resources Institute Finland (Luke), Ounasjoentie 6, FI-96200 Rovaniemi, Finland
 https://orcid.org/0000-0001-7086-0549
E-mail
jaakko.repola@luke.fi
https://orcid.org/0000-0001-7086-0549
E-mail
jaakko.repola@luke.fi
-
Luoranen,
Natural Resources Institute Finland (Luke), Juntintie 154, FI-77600 Suonenjoki, Finland
https://orcid.org/0000-0002-6970-2030
E-mail
jaana.luoranen@luke.fi
-
Huuskonen,
Natural Resources Institute Finland (Luke), Latokartanonkaari 9, FI-00790 Helsinki, Finland
https://orcid.org/0000-0001-8630-3982
E-mail
saija.huuskonen@luke.fi
-
Peltoniemi,
Natural Resources Institute Finland (Luke), Latokartanonkaari 9, FI-00790 Helsinki, Finland
https://orcid.org/0000-0003-2028-6969
E-mail
mikko.peltoniemi@luke.fi
- Väänänen, Natural Resources Institute Finland (Luke), Latokartanonkaari 9, FI-00790 Helsinki, Finland E-mail paivi.vaananen@luke.fi
- Uotila, Natural Resources Institute Finland (Luke), Juntintie 154, FI-77600 Suonenjoki, Finland E-mail karri.uotila@luke.fi
Received 27 May 2024 Accepted 10 October 2024 Published 17 October 2024
Views 37325
Available at https://doi.org/10.14214/sf.24031 | Download PDF

Supplementary Files
1 Introduction
Nowadays, information about stand biomass is needed for many purposes e.g., for estimating forest carbon storage, energy wood resources and nutrient cycling and fluxes. The forest carbon sinks have played an important role when assessing greenhouse gas balance. The assessment of the forest carbon stock is mostly based on estimates of stand biomass expressed as dry mass. Dry mass is appropriate variable for determining of forest carbon stock because 50% of tree dry mass is carbon. In practise, stand biomass is not direct measurable but biomass estimates have been commonly obtained by utilizing tree or stand characteristics and regression models, biomass tables or expansion factors (Baskerville 1965; Satoo and Madgwick 1982; Marklund 1989; Hakkila 1991; Lehtonen et al. 2004; Aguirre et al. 2021)
Biomass estimates of a stand are commonly obtained with stand or tree level regression models. Stand level models based on stand level characteristics such as volume (m3 ha–1) (Castedo-Dorado et al. 2012; Aguirre et al. 2021; Xin et al. 2023). Tree level models predict biomasses as a function of easily measurable tree dimensions such as diameter and height, and stand biomass are obtained by summing tree biomass predictions.
Prerequisite for the widely applicable (general) tree level biomass models is that they should base on tree variables which are commonly gathered in forest inventory, or which is available or derivable from forest database (Kärkkäinen 2005). The most commonly used independent variables are tree breast height diameter and height. For the crown components also crown length and ratio have been used as regressors (Marklund 1989; Mäkelä and Valentine 2006; Repola 2008, 2009).
In addition to regressors selection, the model specification needs to be correct to have reliable biomass predictions. Therefore, it is important to address the correlation structure of the data in the model specification. Different correlations (spatial, temporal, contemporaneous) are common in biomass data. Modelling these correlations provide considerable gains in the efficiency of estimation (Parresol 1999; Gregoire et al. 1995). When biomass models are developed by individual tree components, contemporaneous correlation i.e., inherent correlations between tree components in the same tree or stand should not be ignored (Parresol 1999, 2001). This inherent correlation can be addressed with multi-response approaches, in which models for individual tree component are estimated simultaneously by using e.g., seemingly unrelated regression (SUR). Contemporaneous correlation at tree level has been utilized in model estimation of many studies (Zellner 1962; Parresol 2001; Carvalho et al. 2003; Bi et al. 2004; Návar et al. 2004; Zhao et al. 2015, 2019; Zhang et al. 2016; Xie et al. 2020). Utilization of contemporaneous correlation both at tree and stand level in model specification was applied more sparsely (Repola 2008, 2009; Bronisz and Mehtätalo 2020). This approach enables across-equation model calibration at stand level if observations of dependent variables are available (Lappi 1991; Repola 2008). In practice biomass observations of tree component are seldom available. Instead Bronisz and Mehtätalo (2020) compiled the multi-response model including in addition tree components also tree height as a dependent variable. Their model produced fixed prediction as function of tree diameter only, but measurements of tree height were able to also calibrate biomass prediction of tree components with correlation of random stand effects.
Tree level biomass models are generally applied in Nordic countries (Marklund 1989; Repola 2008, 2009). These models provide biomass estimates of spruce, pine and birch for total tree and individual tree components (stem, stem bark, branches, foliage, stump, and roots) over wide range of site conditions. Nevertheless, there have been set some restrictions to the model application. The feasibility of the Repola’s models (2008, 2009) to seedling stand especially trees with a height< 1.3 m is uncertain. In Finland there are no biomass models which are primarily intended to young seedling stands, and biomass predictions are commonly obtained by extrapolating Repola’s models (2008, 2009). Reliable biomass estimates of young stand are needed when e.g., assessing the effect of stand management on stand carbon sink of whole rotation period or assessing national level forest carbon budget. In Finland the proportion of seedlings stand of total forest area (available for wood production) is significant, 17% (of which 37% is young seedlings stand). Also, planting of Norway spruce (Picea abies [L.] H. Karst.) plays an important role in regeneration, and at national level the total area of clear cuttings is about 140 000 ha per year of which notable part, 51 000 ha were planted with spruce (Luke Statistics database, Forests Statistics).
The objectives of the study were I) to compile tree level biomass models for above- and below-ground tree components of trees growing in planted Norway spruce seedling stand with admixture of naturally regenerated silver birch (Betula pendula Roth), aspen (Populus tremula L.) and rowan (Sorbus aucuparia L.), and II) to test the feasibility of Repola’s models (2008, 2009) in the seedling stand.
2 Material and methods
2.1 Material
The study material consisted of three Norway spruce seedling stands with varying mixtures of naturally regenerated silver birch, aspen and rowan. The stands were located on mesic heath forest site on mineral soil Nastola, Karkkila and Tammela in Southern Finland (Fig. 1). Sites were clearcut in 2014–2015, and after soil preparation (spot mounding) two-year-old Norway spruce container seedlings were planted in 2016–2017. At the time of the establishment in 2021, the total stem number of the stands ranged from 21 335 to 43 793 ha–1 of which 1893–2384 was planted spruce. The proportion of birch was 70–80 %. The mean height was 0.95–1.35 m and 1.41–1.87 m for planted spruce and broadleaves trees (Table 1).
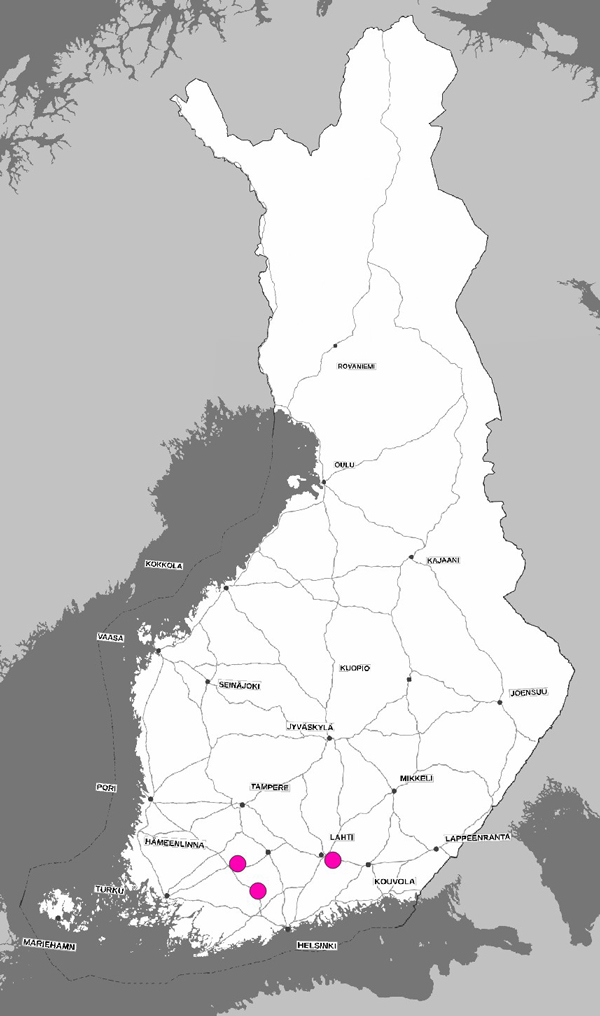
Fig. 1. Location of the experiments for modelling tree biomass for spruce and deciduous trees in Finland.
| Table 1. Stand characteristics at the establishment of the experiments in 2021, and numbers of sampled biomass trees. For height, mean is presented with standard deviation in parentheses. For number of sampled biomass trees by tree species, the number of above-ground tree components is presented with the number of root samples in the parentheses. | |||
| Finland, Nastola | Finland, Karkkila | Finland, Tammela | |
| Coordinates | 60°55.417’N, 25o53.208’E | 60o33.783’N, 24o15.693’E | 60o51.140’N, 23o46.211’E |
| Number of sample plots | 8 | 12 | 12 |
| Sample plot size, m2 | 625 | 500 | 500 |
| Number of stems, ha–1 | |||
| Planted spruce | 2384 | 2235 | 1893 |
| Broadleaves trees | 27 900 | 19 100 | 41 900 |
| Height, m | |||
| Planted spruce | 0.95 (0.44) | 1.34 (0.46) | 1.02 (0.29) |
| Deciduous trees | 1.87 (0.78) | 1.79 (0.77) | 1.41 (0.68) |
| Number of sampled biomass trees: | |||
| Norway spruce | 16 (8) | 8 (8) | 20 (10) |
| Silver birch | 20 (10) | 10 (10) | 24 (12) |
| Aspen | 20 (10) | - | - |
| Rowan | - | 10 (10) | 24 (12) |
There were established 8–12 rectangular shaped sample plots with size of 500 or 625 m2 to each stand (Table 1). All the planted spruce were mapped, and tree height and diameters at breast height (1.3 m) and stump height (0.1 m), and crown base height and diameter were measured. Broadleaves trees were inventoried from five circular plots with sized of 50 m2, one located in middle and four in the corners of the rectangular plot. Number of trees by tree species and the previously mentioned tree characteristics were measured on every fifth deciduous tree.
2.2 Sample tree selection for biomass determination
For biomass measurement there were selected totally 152 sample trees of which 44, 54, 20 and 34 were spruce, birch, aspen and rowan, respectively. Above-ground biomass by tree components (stem, living branches, foliage) were measured on all sample trees, and belowground biomass (stump, roots) was determined every second sample tree (Table 1). Spruce and birch sample trees were gathered from each stand, but aspen was only found from Nastola and rowan from Karkkila and Tammela (Table 1). The sample trees were selected through the height distribution so that they represented the whole growing stock. Different size of trees in each tree species were subjectively selected to representing certain height-classes in each site. Root system of rowan could contain also more than one stem when the highest stem was measured as a sample tree. Damaged trees were not accepted as sample trees. The height of the spruce sample trees was on average 1.3 m ranging between 0.5 m and 2.6 m (Table 2). The mean height of birch, aspen and rowan was 2.2 m, 2.6 m and 1.4 m, respectively (Table 2).
| Table 2. Characteristics of biomass sample trees gathered from the experiments. | |||||
| N | Stem diameter at stump height*, cm | Tree height, m | |||
| Mean | Range | Mean | Range | ||
| Norway spruce | 44 | 2.4 | 0.7–4.2 | 1.3 | 0.5–2.6 |
| Silver birch | 54 | 2.5 | 0.6–5.3 | 2.2 | 0.6–4.3 |
| Aspen | 20 | 2.2 | 0.5–4.6 | 2.6 | 0.6–4.8 |
| Rowan | 34 | 1.4 | 0.6–2.7 | 1.4 | 0.6–2.3 |
| * Measured at 0.1 m height. | |||||
The sample trees were cut in July 2022, and stump diameter, tree height, crown length and annual height increment during last four years were measured. Roots with diameter > 2 mm were dug up in Nastola in summer 2022, and in other sites (Karkkila, Tammela) in May 2023. Due to the big stones, stumps or planted seedlings, whole root systems of all sample trees were not possible to dig up. The half of root systems were tried to dig up in Nastola. In other site, the proportion of roots left to the soil were visually estimated, assuming even distribution of roots. This proportion was accounted in the determination of total root biomass.
Whole above-ground part of tree and roots were packed in plastic bags in the field and transferred to laboratory for the biomass (dry weight) determination. In the laboratory, foliage, branches and stem of each sample trees were separated. Some tallest silver birch trees had catkins and they were measured as own plant part. Root systems were carefully cleaned from the soil and washed and roots with diameter < 2 mm were cut off. Whole tree was dried by the tree components in oven in 60 °C at least a week. The real drying time was determined by weighing some sample of different plant parts and different size of samples regularly, and when the weight remained unchanged samples were taken out. All samples were weighed with the accuracy of 0.001 g. Root system of rowan contained mostly one stem, but also more stems could be originated from the same root system. In that case only one stem was selected for measurement of tree dimensions and biomass modelling.
2.3 Statistical methods
Regression models were estimated for biomasses of individual tree components (stem including bark, branches, foliage, stump, and roots with diameter > 2 mm) by tree species. The component biomasses on the same site and in the same tree were assumed to be dependent on each other. This means that there exists also a statistical dependency among the models of biomass components, i.e., the errors of the individual models are correlated. Multi-response procedure was applied to address this across-equation correlation and to obtain more reliable parameter estimates compared to models estimated independently (Parresol 1999).
Statistical analysis was carried out in two phases. First biomass models of the individual tree components were specified by fitting the models independently. Then, a set of linear models was constructed to form a multi-response linear model, and its parameters were estimated simultaneously. The independently estimated biomass models for the tree component addressed random stand and tree effects could be written as follows:
![]()
where i and j refer to stand and tree, Yij is the response variable (biomass of tree component), β is a vector of fixed effects parameters, Xij is the vector of independent variables, ui is random stand effect, and eij is the model residual.
The independently estimated models showed, partly due to low number of the study stand (N = 3), random stand effect was insignificant, and it was omitted from the final multi-response models. Thus, in multi-response approach the across-equation correlations were addressed only at tree level. The final multi-response model was presented as follows:
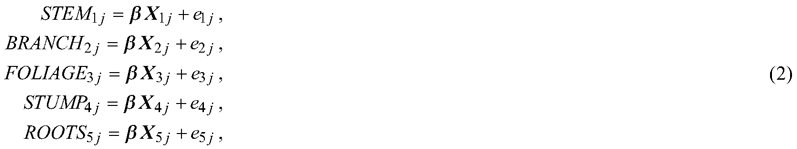
where STEM, BRANCH, FOLIAGE, STUMP and ROOTS are response variables (biomass of tree components), description of the parameters is as in MODEL 1. Residuals errors (e1ij, e2ij, e3ij, e4ij, e5ij,) of the same tree were assumed to be correlated, and to be identically distributed Gaussian random variables with an expected value of 0. In addition, the residual errors were also assumed to have different variances. To obtain homoscedasticity of the variance, and to transform the models to a linear form logarithmic transformation of the response variables were used. When applying the models, a variance correction term, var(ej)/2 should be added to the intercept to correct for bias due to the logarithmic transformation of the response variable. The maximum likelihood (ML) method in the MIXED procedure of SAS (SAS Institute Inc. 1999) was used in the estimation of the models.
Model validation was based on visually inspection of residuals, and transformation of independent variables was applied to remove bias trends related of explanatory variables when needed. The aim was to specify the models so that the predictions would be logically throughout the range and outside of the material.
2.4 Comparison with other biomass models
For the model performance, the observed biomass values of spruce and birch were compared with the predictions of the developed multi-response models and with the predictions obtained with the reference models of Repola (2008, 2009), which are commonly used in Finland. Repola’s models based on tree breast height diameter (d) and/or height (h) were used for all tree components. In addition, for the crown components (foliage, branches) also the Repola’s models with the independent variable of crown length (cl) or crown ratio (cr) were also tested. The comparisons were carried out by the tree components: stem (bark included), branches, foliage, and below-ground biomass (stump and roots). Repola (2008, 2009) used an approximation of stump diameter derived from breast height diameter (2 + 1.25d) as regressor (Laasasenaho 1982). Instead of this approximation we replaced it with the measured stump diameter (ds). Reliability of the predictions in relation to data was assessed by calculating BIAS (Eq. 3):

where ![]() is the observed biomass value of a tree component,
is the observed biomass value of a tree component, ![]() is the corresponding predicted value obtained by the models, and n is the number of observations.
is the corresponding predicted value obtained by the models, and n is the number of observations.
3 Results
3.1 Biomass models
The multi-response biomass models for stem, branches, foliage, stump, and roots with diameter > 2 mm were developed by the tree species (spruce, birch, aspen and rowan). Stump diameter (ds) and heigh (h) or only stump diameter were used as independent variables (Tables 3–6). Commonly used regressor breast height diameter could not be used because part of the sample trees were < 1.3 m in height. Stump diameter was expressed as logarithmic scale or expression of dS / (dS + k), where k is a constant determined by the grid search method (Marklund 1988; Repola 2008, 2009). Tree height was expressed as arithmetic or logarithmic scale. Residual analysis of the developed multi-response models were presented in Supplementary files S1–S4.
| Table 3. The parameter estimates of multi-response model for biomass of Norway spruce (kg). For the fixed parameters the standard error is given in parentheses. Variances and correlations of residual errors (enj) are given. The response variables are in logarithmic scale. | |||||
| Stem | Branches | Foliage | Stump | Roots | |
| Intercept | –5.676 (0.405) | –4.163 (0.092) | –7.003 (0.194) | –8.570 (0.479) | –10.183 (0.775) |
| 5.260 (0.874) | 9.038 (0.323) | 6.618 (0.677) | 9.874 (1.219) | ||
| k | 2 | 1.5 | 1 | 1 | |
| ln(ds) | 2.285 (0.103) | ||||
| ln(h) | 1.288 (0.216) | 0.795 (0.264) | |||
| var(enj) | 0.062 | 0.067 | 0.037 | 0.096 | 0.083 |
| e1j | e2j | e3j | e4j | e5j | |
| e2j | –0.37 | ||||
| e3j | 0.04 | 0.59 | |||
| e4j | 0.26 | 0.50 | 0.34 | ||
| e5j | 0.20 | 0.42 | 0.65 | 0.71 | |
| Table 4. The parameter estimates of multi-response model for biomass of birch (kg). For the fixed parameters the standard error is given in parentheses. Variances and correlations of residual errors (enj) are given. The response variables are in logarithmic scale. | |||||
| Stem | Branches | Foliage | Stump | Roots | |
| Intercept | –6.471 (0.320) | –5.937 (0.084) | –7.104 (0.118) | –6.209 (0.120) | –6.679 (0.286) |
| 5.111 (0.911) | 9.123 (0.248) | 8.476 (1.933) | |||
| k | 2 | 3 | 6 | ||
| ln(ds) | 2.293 (0.226) | 2.157 (0.103) | |||
| ln(h) | 1.599 (0.260) | 0.655 (0.267) | 1.418 (0.486) | ||
| var(enj) | 0.071 | 0.104 | 0.058 | 0.096 | 0.076 |
| e1j | e2j | e3j | e4j | e5j | |
| e2j | 0.30 | ||||
| e3j | 0.41 | 0.67 | |||
| e4j | –0.56 | –0.24 | –0.25 | ||
| e5j | 0.15 | 0.18 | 0.21 | –0.21 | |
| Table 5. The parameter estimates of multi-response model for biomass of aspen (kg). For the fixed parameters the standard error is given in parentheses. Variances and correlations of residual errors (enj) are given. The response variables are in logarithmic scale. | |||||
| Stem | Branches | Foliage | Stump | Roots* | |
| Intercept | –4.489 (0.107) | –15.326 (0.571) | –4.809 (0.056) | - | –6.579 (0.260) |
| 18.844 (1.211) | 10.700 (0.647) | ||||
| k | 1 | 4 | |||
| ln(ds) | 1.873 (0.119) | 2.169 (0.058) | |||
| h | 0.345 (0.063) | –0.314 (0.136) | |||
| var(enj) | 0.022 | 0.204 | 0.026 | 0.116 | |
| e1j | e2j | e3j | e4j | e5j | |
| e2j | 0.05 | ||||
| e3j | 0.01 | 0.52 | |||
| e4j | - | - | - | ||
| e5j | 0.05 | 0.74 | 0.65 | - | |
| * Stump included. | |||||
| Table 6. The parameter estimates of multi-response model for biomass of rowan (kg). For the fixed parameters the standard error is given in parentheses. Variances and correlations of residual errors (enj) are given. The response variables are in logarithmic scale. | |||||
| Stem | Branches | Foliage | Stump | Roots | |
| Intercept | –4.443 (0.054) | –14.193 (0.928) | –7.809 (0.338) | –8.292 (0.442) | –7.586 (0.636) |
| 14.980 (1.524) | 8.700 (0.772) | 8.054 (0.991) | 9.690 (1.434) | ||
| k | 1 | 2 | 2 | 2 | |
| ln(ds) | 1.260 (0.145) | ||||
| ln(h) | 1.420 (0.160) | ||||
| var(enj) | 0.060 | 0.784 | 0.227 | 0.302 | 0.657 |
| e1j | e2j | e3j | e4j | e5j | |
| e2j | 0.55 | ||||
| e3j | 0.74 | 0.48 | |||
| e4j | 0.56 | –0.11 | 0.41 | ||
| e5j | 0.76 | 0.48 | 0.52 | 0.68 | |
The biomasses of tree components estimated with the multi-response model were not independent, i.e., correlations of residuals errors were detected between the biomass sub-models. Regardless of tree species, high across-equation correlations (>0.5) between the biomass components occurred mainly between the foliage and roots as well as between foliage and branches (Tables 3–6). The detected positive correlations showed that, in the trees where foliage biomass was overestimated, the root and branch biomass tended to be also overestimated and vice versa. The variance-covariance matrix of the fixed effects of the developed multi-response models was presented in Suppl. files S5–S8.
3.2 Biomass allocation to the tree components
Allometric relationships among biomass of the tree components and total biomass varied by the tree species. Spruce showed the highest and aspen lowest total biomass with the equal tree height (at the given height) (Fig. 2). For spruce needle biomass was the greatest tree component, and its proportion of whole biomass was 40–50% although it showed a decreasing tendency with tree height (Fig. 3). Branches and stem of spruce showed almost equal biomass with 20% proportion of total biomass. Proportion of stump and roots was about 15%. For birch total biomass shared almost equally, about 1/3 with crown, stem, and below-ground biomass. Proportion of birch foliage biomass seemed to have decreasing tendency with tree size. For aspen proportion of foliage and below-ground biomass decreased with tree height, and of 65–75% of total biomass consisted of stem, stump and roots. Similar tendency was detected in below-ground biomass of rowan but biomass allocation to stump and roots was noteworthy high 45–50% (Fig. 3).
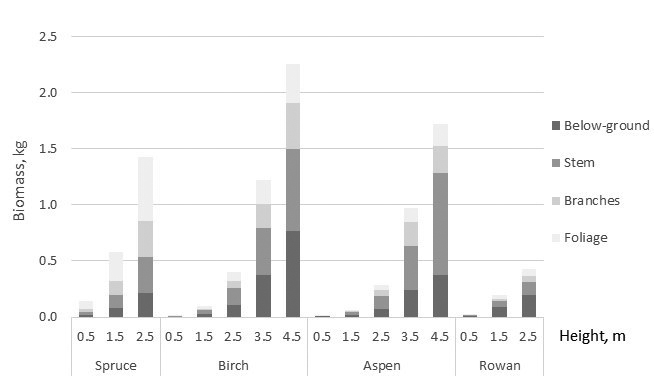
Fig. 2. Predictions of the compiled biomass models for tree components as a function of tree height. Stump and roots are included to below-ground biomass.
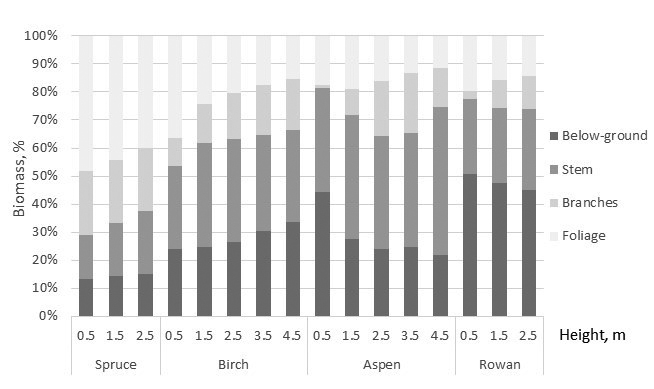
Fig. 3. The biomass allocation to the biomass of the tree components based on the developed biomass models. Stump and roots are included to below-ground biomass.
Root-to-shoot ratio, root biomass divided by above-ground biomass (stump, stem, branches, foliage), varied by the tree species: Root-to-shoot ratio was on average 0.12, 0.27, 0.38 and 0.67 for spruce, birch, aspen and rowan, respectively. For spruce and birch root-to-shoot ratio showed increasing tendency and aspen slightly decreasing with tree height (Fig. 4). Rowan had high tree-to tree variation in root-to-shoot ratio and no clear tendency was detected (Fig. 4).
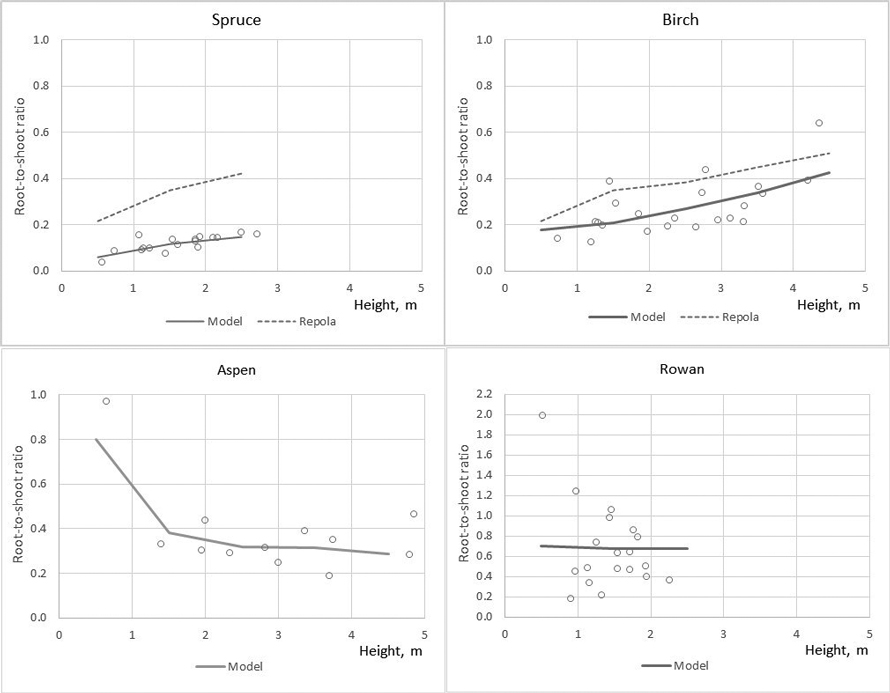
Fig. 4. The observed (circle marks) and predicted root-to-shoot ratio in the modelling data predicted by the developed models (MODEL) and models of Repola (2008, 2009).
3.3 Comparison with Repola’s models
The developed models produced lower bias for all tree components compared with that of Repola’s models for birch and spruce (2008, 2009) (Table 7). The biomass predictions of stem, including stem wood and bark, given by the compiled and Repola’s (2008, 2009) models showed quite similar trend thorough the range of stump diameter especially for spruce (Fig. 5). Of above-ground tree components Repola’s models underestimated most foliage biomass with bias of 0.185 kg and 0.101 kg for spruce and birch (Table 7, Fig. 5). Reliability of foliage predictions improved by using Repola’s models in which also crown variable (cl or cr) was as regressor, but bias was sill notable through the whole tree size range (Fig. 5). For branch biomass, similar but lower tendency of bias was detected also for spruce but not for birch (Table 7, Fig. 5). The models showed systematically different behaviour of biomass predictions for belowground biomass (Fig. 6). Repola’s models (2008, 2009) predicted systematically too high stump and roots biomass and bias of whole below-ground biomass was –0.290 kg and –0.196 kg for spruce and birch (Table 7). Correspondingly, the overestimates of root biomass resulted in too high root-to-shoot ratios for both spruce and birch (Fig. 4).
| Table 7. Bias (kg) of the predicted biomass of spruce and birch obtained by the developed (MODEL) and Repola (2008, 2009) models. Bias of the model based also on the crown variable are presented in parenthesis. | ||||
| Spruce | Birch | |||
| MODEL | Repola 2009 | MODEL | Repola 2008 | |
| Stem | –0.001 | –0.029 | 0.001 | 0.003 |
| Branches | –0.001 | 0.059 (0.012) | –0.001 | –0.009 (0.010) |
| Foliage | 0.006 | 0.185 (0.164) | 0.000 | 0.101 (0.067) |
| Below-ground | 0.005 | –0.290 | –0.008 | –0.196 |
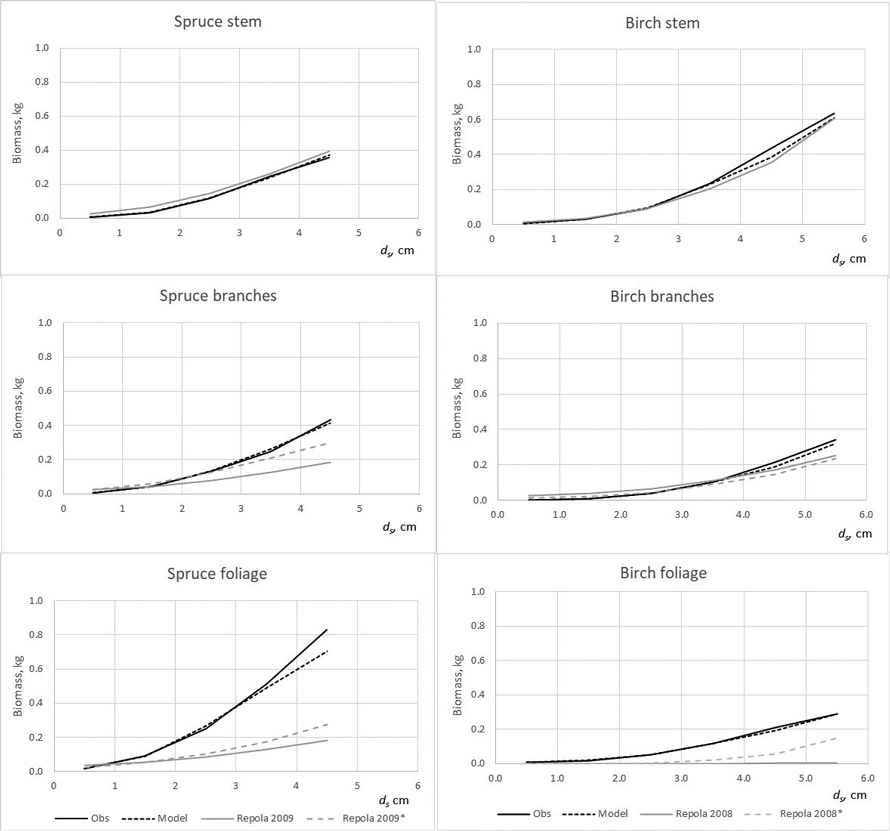
Fig. 5. The observed (Obs.) and predicted spruce and birch above-ground biomass in the modelling data predicted by the developed models (Model) and models of Repola (2008, 2009). * Predictions of the model with the independent variables of diameter, height, crown length or crown ratio.
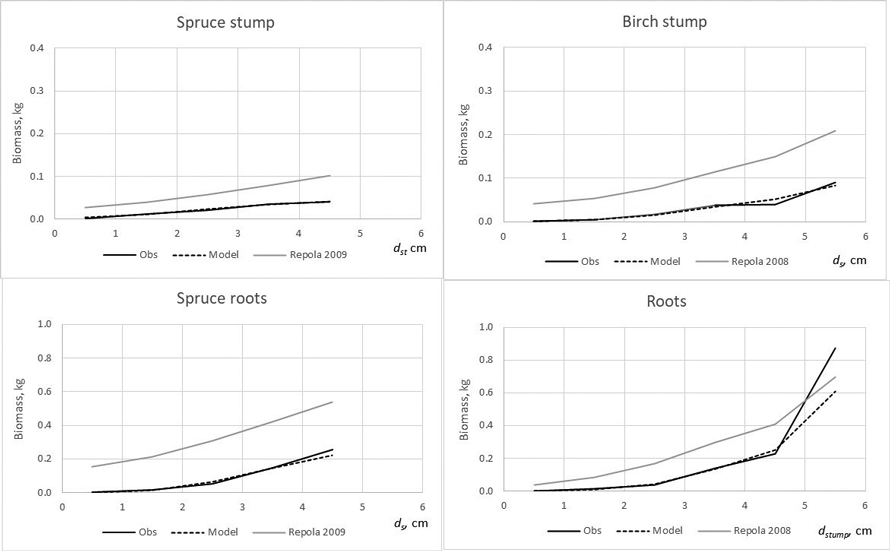
Fig. 6. The observed (Obs.) and expected spruce and birch below-ground biomass in the modelling data predicted by the developed models (Model) and models of Repola (2008, 2009).
4 Discussion
In this study, we developed tree level biomass models for spruce, silver birch, aspen and rowan growing in young seedlings spruce stands with high mixture of broadleaves. The models extended the existing biomass models (Repola 2008, 2009) to seedlings and smaller trees (< 2.5 m and < 4.5 m for spruce/rowan, and aspen/birch, respectively), new tree species (aspen and rowan), and mixed species growing environments, thus providing new and missing information about seedling biomass allocation. However, the developed biomass models were based on the limited material, on the three young spruce stands with the narrow range of geographical location and site conditions, which may restrict the application and generalization of the models for larger area.
The model validations showed that the developed models provide more reliable biomass estimates for spruce and birch growing in young stands than those of Repola’s models (2008, 2009). The model validations further revealed that Repola’s (2008, 2009) models were unreliable for predicting crown and below-ground biomasses, thus emphasizing the need to apply the new models in future. Generally, the existing models allocated too much biomass to roots and too little to needle and branches. Biases were highest for spruce, and especially when applying the simplest version of Repola’s models based on diameter and height, only.
Similarly, the Repola’s (2008, 2009) models were not suitable for predicting birch foliage biomass in young stands. This is likely due to two reasons. First, biomass allocation changes with tree ontogeny are large for birch, which means that the models derived for large trees are not applicable. Second, Repola’s models for foliage biomass were derived from small material, the sample trees gathered only from one middle-aged stand. It was also remarkable that the root biomass predictions were not directly comparable when root biomass in our data included roots with diameter > 2 mm and Repola’s models gave prediction for roots with diameter > 10 mm. Despite this Repola’s models (2008, 2009) produced too high root biomass, and consequently also too high, on average 0.35 root to shoot ratios for spruce and birch. In our data spruce root to shoot ratios was on average 0.12 which is near the previously reported values 0.14–0.16 (Bolte et al. 2004; Drexhage and Gruber 1999). Konôpka et al. (2010) concluded that root to shoot ratio of spruce stabilized at around 0.2, and DeAngelis et al. (1981) showed root to shoot ratios generally varying between 0.20–0.33. Hees and Clerkx (2003) reported 0.34–0.45 root-to-shoot ratios for birch depending on light conditions, which is higher than that in our data (0.27). However, the results of different studies are not direct comparable because several factors such as site fertility, climate conditions, between tree competition, and species admixture have shown to have an impact on root biomass and root to shoot ratios (Axelson and Axelson 1986; Hees and Clerkx 2003; Bolte et al. 2004).
It needs to keep in mind that our data was mostly out of Repola’s models validity range. Repola’s models are primarily applicable for older stands and trees with height > 2–4 m, so our test led in the case when these models were extrapolated. In Sweden, Claesson et. al (2001) drew a similar conclusion when they tested the commonly used biomass models (Marklund 1988) in young stand with high densities. In most cases Marklund’s models didn’t give sufficiently reliable biomass predictions of the tree components by producing too high proportion of biomass allocated to the stem and too small proportion to foliage. This was analogous with our results.
Our data was hierarchically structured consisting of tree stands, which should be addressed in the model estimation to obtain reliable standard error of parameter estimates (Lappi 1993). In our data, random stand effect didn’t show to be significant and hierarchically structured data, between stand correlation was not accounted in the final model. So, this didn’t mean any loss of reliability of parameter estimates. Non-significant random stand effect indicates similarity of tree properties between stands which can result from low number of stands (N = 3) with low variation of site conditions. Also, age of planted spruce trees was equal, and mounding was used as soil preparation in all sites.
Multi-response approach has an advantage of informing about across-equation correlation if statistical dependencies among sub-models exist (Parresol 1999, 2001; Repola 2008, 2009). In this study, the across-equation correlation was addressed only at the tree level. For this reason, the across-equation calibration of the sub-models was not possible to do at the stand level but only the tree level (Lappi 1991). This mean that biomass measurements of a single tree can be utilized only in tree level calibration but not in the calibration of other trees of a stand. However, in practice biomass predictions are commonly based only on fixed effect, and there are rarely available measured or estimated biomass of an individual tree components (Bronisz and Mehtätalo 2020), which could be utilized in model calibration to carry information to one sub-model to another. In our case, the main advantage of the use of multi-response model was to obtain more reliable parameter estimates (lower standard error of parameter estimates, result not shown) and information on correlation of residual errors between the tree components. The multi-response models provided also across-equation covariances of the fixed parameters which allow to calculate the prediction reliability for any combination of the biomass components. This is not possible if biomass models are estimated independently.
Commonly in biomass studies, dependent variables include statistical errors caused by the determination of sample tree biomass by sub-sampling (Parresol 1999, 2001). In our study, however, the biomasses of the sample trees were determined with direct measurement of an entire tree component, i.e. not by sampling. This meant that biomass (dry weight) of whole tree by tree components were measured, and biomasses of the sample trees contained only measurement errors but not the previously mentioned statistical errors caused by sub-sampling. Direct biomass measurement is in practice possible only with small trees as it was in our study (Briggs et al. 1987).
This study provided new information of seedling biomass allocation and supplemented the existing biomass models applied in Finland (Repola 2008, 2009). The new models also provide tools to predicted more reliably carbon balance of young stands, which has previously based on extrapolation of Repola’s models (2008, 2009). The compiled models are applicable for trees with height up to 2–5 m depending on tree species, and for this bigger tree the validity of the models is uncertain. For spruce and birch with height > 3–4 m Repola’s models (2008, 2009) are recommended to applied. However, in future, there is a need to collect more comprehensive biomass data for developing general species-specific models which are valid over the whole country and represent different development stages of trees with wider range of site conditions. This is important as previous biomass data have rarely been based on an objective sampling (Marklund 1988), which can restrict the generalization of the models for larger scales, e.g., for national level. Until that, it is important that the representativeness of biomass data is carefully assessed, and when necessary, considered in the model estimation by weighting the observations appropriately with representative information from larger surveys (e.g., national forest inventory).
Declaration of openness of research materials, data, and code
The data with statistical code are available at https://zenodo.org/uploads/13907020 and upon request from Natural Resources Institute Finland (Luke). Data code can be acquired from the authors and the statistical from the corresponded authors (jaakko.repola@luke.fi.).
Author’s contribution
All authors participated in writing, reviewing, and editing the manuscript. Jaakko Repola: Data management and statistical analysis. Jaana Luoranen: Project administration, funding acquisition, experimental design, data management. Saija Huuskonen: Funding acquisition, experimental design. Mikko Peltoniemi: Conceptualization, experiment design. Päivi Väänänen: experiment design, data acquisition. Karri Uotila: Project administration, funding acquisition, experiment design, data management and acquisition. All authors have read and agreed to the published version of the manuscript.
Acknowledgements
We would like to thank the staff of Natural Resources Institute Finland (Luke) in Suonenjoki and Viikki for carrying out the field and laboratory works.
Funding
The project was supported by Ministry of Agriculture and forestry of Finland (project 41007-00205200).
References
Aguirre A, del Río M, Ruiz-Peinado R, Condés S (2021) Stand-level biomass models for predicting C stock for the main Spanish pine species. For Ecosyst 8, article id 29. https://doi.org/10.1186/s40663-021-00308-w.
Axelson E, Axelson B (1986) Changes in carbon allocation patterns in spruce and pine trees following irrigation and fertilization. Tree Physiol 2: 1898–204. https://doi.org/10.1093/treephys/2.1-2-3.189.
Baskerville GL (1965) Estimation of dry weight of tree components and total standing crop in conifer stands. Ecology 46: 867–869. https://doi.org/10.2307/1934021.
Bi H, Turner J, Lambert MJ (2004) Additive biomass equations for native eucalyptus forest trees of temperate Australia. Trees 18: 467–479. https://doi.org/10.1007/s00468-004-0333-z.
Bolte A, Rahmann T, Kuhr M, Pogoda P, Murach D, Gadow Kv (2004) Relationships between tree dimension and coarse root biomass in mixed stands of European beech (Fagus sylvatica L.) and Norway spruce (Picea abies[L.] Karst.). Plant Soil 264: 1–11. https://doi.org/10.1023/B:PLSO.0000047777.23344.a3.
Briggs RD, Cunia T, White EH, Yawney HW (1987) Estimating sample tree biomass by subsampling: some empirical results. In: Wharton EH, Cunia T (eds) Estimating Tree Biomass Regressions and Their Error. Proceedings of the Workshop on Tree Biomass Regression Functions and their Contribution to the Error of Forest Inventory Estimates. ASDA For Serv Gen Tech Rep NE-117, pp 119–127.
Bronisz K, Mehtätalo L (2020) Seemingly unrelated mixed-effects biomass models for young silver birch stands on post-agricultural lands. Forests 11, article id 381. https://doi.org/10.3390/f11040381.
Carvalho JP, Parresol BR (2003) Additivity in the tree biomass components of Pyrenean oak (Quercus pyrenaica Willd.). Forest Ecol Manag 179: 269–276. https://doi.org/10.1016/S0378-1127(02)00549-2.
Castedo-Dorado F, Gómez-García E, Diéguez-Aranda U (2012) Aboveground stand-level biomass estimation: a comparison of two methods for major forest species in northwest Spain. Ann For Sci 69: 735–746. https://doi.org/10.1007/s13595-012-0191-6.
Claesson S, Sahlén K, Lundmark T (2001) Functions for biomass estimation of young Pinus sylvestris, Picea abies and Betula spp. from stands in northern Sweden with high stand densities. Scand J Forest Res 16: 138–146. https://doi.org/10.1080/028275801300088206.
DeAngelis D , Gardner RH, Shugart HH (1981) Productivity of forest ecosystems studies during the IBP: the woodland data sets. In: Reichle DE (eds) Dynamic Properties of Forest Ecosystems. Cambridge University Press, Cambridge, pp 567–672.
Drexhage M, Gruber F (1999) Architecture of the skeletal root system of 40-year-old Picea abies on strongly acidified soils in the Harz Mountains (Germany). Can J For Res 28: 13–22. https://doi.org/10.1139/x97-181.
Fu L, Sharma RP, Hao K, Tang S (2017) A generalized interregional nonlinear mixed-effects crown width model for Prince Rupprecht larch in northern China. For Ecol Manag 389: 364–373. https://doi.org/10.1016/j.foreco.2016.12.034.
Gregoire TG, Schabenberger O, Barrett JP (1995) Linear modeling of irregularly space, unbalanced, longitudinal data from permanent-plot measurements. Can J For Res 25: 137–156. https://doi.org/10.1139/x95-017.
Hakkila P (1979) Wood density surveys and dry weight tables for pine, spruce and birch stems in Finland. Communicationes Instituti Forestalis Fenniae 96.3. http://urn.fi/URN:ISBN:951-40-0470-1.
Kärkkäinen L (2005) Evaluation of performance of tree-level biomass models for forestry modelling and analyses. Finnish Forest Research Institute Research Papers 940. http://urn.fi/URN:ISBN:951-40-1956-3.
Konôpka B, Pajtík J, Moravčík M, Lukac M (2010) Biomass partitioning and growth efficiency in four naturally regenerated forest tree species. Basic Appl Ecol 11: 234–243. https://doi.org/10.1016/j.baae.2010.02.004.
Laasasenaho J (1982) Taper curve and volume functions for pine, spruce and birch. Communicationes Institute Forestalis Fenniae 108. http://urn.fi/URN:ISBN:951-40-0589-9.
Lehtonen A, Mäkipää R, Heikkinen J, Sievänen R, Liski J (2004) Biomass expansion factors (BEFs) for Scots pine, Norway spruce and birch according to stand age for boreal forests. For Ecol Manag 188: 211–224. https://doi.org/10.1016/j.foreco.2003.07.008.
Mäkelä A, Valentine HT (2006) Crown ratio influences allometric scaling in trees. Ecology 87: 2967–2972. https://doi.org/10.1890/0012-9658(2006)87[2967:CRIASI]2.0.CO;2.
Marklund G (1988) Biomass functions for pine, spruce and birch in Sweden. Swedish University of Agricultural Sciences, Department of Forest Survey, Report 45.
Návar C, González B, Graciano L, Dale V, Parresol BP (2004) Additive biomass equations for pine species of forest plantations of Durango, Mexico. Madera y Bosques 10: 17–28. https://www.redalyc.org/articulo.oa?id=61710202.
Lappi J (1991) Calibration of height and volume equation with random parameter. Forest Sci 37: 781–801. https://doi.org/10.1093/forestscience/37.3.781.
Lappi J (1993) Metsäbiometrian menetelmiä. [Methods of forest biometrics]. University of Joensuu, Faculty of Forest Sciences, Silva Carelica 24.
Monserud RA, Marshall JD (1999) Allometric crown relations in three northern Idaho conifer species. Can J For Res 29: 521–535. https://doi.org/10.1139/x99-015.
Parresol BR (1999) Assessing tree and stand biomass: a review with examples and critical comparisons. Forest Sci 45: 573–593. https://doi.org/10.1093/forestscience/45.4.573.
Parresol BR (2001) Additivity of nonlinear biomass equations. Can J For Res 31: 865–878. https://doi.org/10.1139/x00-202.
Repola J (2008) Biomass equations for birch in Finland.Silva Fenn 42: 605–624. https://doi.org/10.14214/sf.236.
Repola J (2009) Biomass equations for Scots pine and Norway spruce in Finland. Silva Fenn 43: 625–647. https://doi.org/10.14214/sf.184.
Repola J (2013) Modelling tree biomasses in Finland. Diss For 158. https://doi.org/10.14214/df.158.
Satoo T, Madgwick HAI (1982) Forest biomass. In: Madgwick HAI (eds) Forestry Sciences. Martinus Nijhoff/Dr. W. Junk Publisher, The Hague. https://doi.org/10.1007/978-94-009-7627-6_4.
Siddique MRH, Mahmood H, Siddiqui B, Abdullah S, Akhter M, Sola G, Iqbal Z, Henry M (2021) Conventional and additive models for estimating the biomass, carbon and nutrient stock in individual Shorea robusta Gaertn. f. tree of the Sal forests of Bangladesh. Environ Challenges 4, article id 100178. https://doi.org/10.1016/j.envc.2021.100178.
Van Hees AFM, Clerkx APPM (2003) Shading and root–shoot relations in saplings of silver birch, pedunculate oak and beech. For Ecol Manag 176: 439–448. https://doi.org/10.1016/S0378-1127(02)00307-9.
Zellner A (1962) An efficient method of estimating seemingly unrelated regressions and tests for aggregation bias. J Am Stat Assoc 57: 348–368. https://doi.org/10.2307/2281644.
Zhang CD, Peng DL, Huang GS, Zeng WS (2016) Developing aboveground biomass equations both compatible with tree volume equations and additive systems for single-trees in poplar plantations in Jiangsu province, China. Forests 7, article id 32. https://doi.org/10.3390/f7020032.
Zhao D, Kane M, Markewitz D, Teskey R, Clutter M (2015) Additive tree biomass equations for midrotation loblolly pine plantations. Forest Sci 61: 613–623. https://doi.org/10.5849/forsci.14-193.
Zhao D, Westfall J, Coulston JW, Lynch TB, Bullock BP, Montes CR (2019) Additive biomass equations for slash pine trees: comparing three modeling approaches. Can J For Res 49: 27–40. https://doi.org/10.1139/cjfr-2018-0246.
Xie L, Li F, Zhang L, Widagdo FRA, Dong L (2020) A Bayesian approach to estimating seemingly unrelated regression for tree biomass model systems. Forests 11, article id 1302. https://doi.org/10.3390/f11121302.
Xin S, Shahzad MK, Mahardika SB, Wang W, Jiang L (2023) An alternative method for estimation of stand-level biomass for three conifer species in northeast China. Forests 14, article id 1274. https://doi.org/10.3390/f14061274.
Total of 39 references.
