Lennart Noordermeer  ,
Terje Gobakken,
Johannes Breidenbach,
Rune Eriksen,
Erik Næsset,
Hans Ole Ørka,
Ole M. Bollandsås
,
Terje Gobakken,
Johannes Breidenbach,
Rune Eriksen,
Erik Næsset,
Hans Ole Ørka,
Ole M. Bollandsås
Effects of sample tree selection and calculation methods on the accuracy of field plot values in area-based forest inventories
Noordermeer L., Gobakken T., Breidenbach J., Eriksen R., Næsset E., Ørka H. O., Bollandsås O. M. (2025). Effects of sample tree selection and calculation methods on the accuracy of field plot values in area-based forest inventories. Silva Fennica vol. 59 no. 2 article id 25003. https://doi.org/10.14214/sf.25003
Highlights
- Retaining field-measured heights of sample trees improved accuracies of plot values
- Selecting sample trees with probability proportional to basal area was recommended
- The number of sample trees and sample tree selection method impacted accuracies
- The choice of calculation method had a strong influence on accuracies of plot values.
Abstract
Accurate field plot data on forest attributes are crucial in area-based forest inventories assisted by airborne laser scanning, providing an essential reference for calibrating predictive models. This study assessed how sample tree selection methods and plot data calculation methods affect the accuracy of field plot values of timber volume, Lorey’s mean height, and dominant height. We used data obtained from 12 420 circular sample plots of 250 m2, measured as part of the Norwegian national forest inventory and 45 local forest management inventories. We applied Monte Carlo simulations by which we tested various numbers of sample trees, methods to select sample trees, and methods to calculate plot-level values from tree-level measurements. Accuracies of plot values were statistically significantly affected by the number of sample trees, sample tree selection method, and calculation method. Obtained values of root mean square error ranged from 5% to 16% relative to the mean observed values, across the factors studied. Accuracy improved with increasing numbers of sample trees for all forest attributes. We obtained greatest accuracies by selecting sample trees with a probability proportional to basal area, and by retaining field-measured heights for sample trees and using heights predicted with a height-diameter model for non-sample trees. This study highlights the importance of appropriate sample tree selection methods and calculation methods in obtaining accurate field plot data in area-based forest inventories.
Keywords
forest inventory methods;
field plot accuracy;
height-diameter modeling;
sample tree selection
-
Noordermeer,
Faculty of Environmental Sciences and Natural Resource Management, Norwegian University of Life Sciences, NMBU, P.O. Box 5003, NO-1432 Ås, Norway
 https://orcid.org/0000-0002-8840-0345
E-mail
lennart.noordermeer@nmbu.no
https://orcid.org/0000-0002-8840-0345
E-mail
lennart.noordermeer@nmbu.no
-
Gobakken,
Faculty of Environmental Sciences and Natural Resource Management, Norwegian University of Life Sciences, NMBU, P.O. Box 5003, NO-1432 Ås, Norway
https://orcid.org/0000-0001-5534-049X
E-mail
terje.gobakken@nmbu.no
- Breidenbach, Division of Forest and Forest Resources, Norwegian Institute of Bioeconomy Research (NIBIO), P.O. Box 115, NO-1431 Ås, Norway E-mail johannes.breidenbach@nibio.no
- Eriksen, Division of Forest and Forest Resources, Norwegian Institute of Bioeconomy Research (NIBIO), P.O. Box 115, NO-1431 Ås, Norway E-mail rune.eriksen@nibio.no
- Næsset, Faculty of Environmental Sciences and Natural Resource Management, Norwegian University of Life Sciences, NMBU, P.O. Box 5003, NO-1432 Ås, Norway E-mail erik.naesset@nmbu.no
- Ørka, Faculty of Environmental Sciences and Natural Resource Management, Norwegian University of Life Sciences, NMBU, P.O. Box 5003, NO-1432 Ås, Norway E-mail hans-ole.orka@nmbu.no
-
Bollandsås,
Faculty of Environmental Sciences and Natural Resource Management, Norwegian University of Life Sciences, NMBU, P.O. Box 5003, NO-1432 Ås, Norway
https://orcid.org/0000-0002-1231-7692
E-mail
ole.martin.bollandsas@nmbu.no
Received 21 January 2025 Accepted 11 May 2025 Published 2 June 2025
Views 47920
Available at https://doi.org/10.14214/sf.25003 | Download PDF

Supplementary Files
1 Introduction
Accurate and timely information on forest resources is crucial for rational decision-making in forest management. This information is obtained in forest inventories, which provide essential data on forest attributes such as timber volume, Lorey’s mean height, and dominant height to inform operational forest management. In operational forest inventories, forest attributes are commonly predicted from airborne laser scanning (ALS) data. The area-based approach, proposed by Næsset (2002), is the most common method for using ALS data to predict forest attributes using models based on ALS data (White et al. 2013). Although ALS has become an important data source in various regions, many operational forest inventories still rely primarily on traditional field work and aerial imagery (Goodbody et al. 2024). As noted by Fassnacht et al. (2024), despite the demonstrated value of ALS, its uptake remains uneven due to constraints related to cost, technical capacity, and data infrastructure.
In area-based forest inventories, field data are obtained from a sample of plots distributed throughout the inventory area, which are then linked to ALS data in predictive models. The models are applied over a grid tessellating the inventory area, with ALS metrics computed for each grid cell, to enable wall-to-wall predictions of the target attributes. Predictions for individual grid cells within stands are then aggregated to obtain stand-level estimates of the target attributes, forming the basis for operational forest management planning. Thus, while the inventories largely rely on ALS data, the acquisition of accurate field plot data remains essential for developing reliable prediction models.
Errors in field plot data are commonly ignored both in operational forest inventories and in research, meaning that the values are assumed to be free of error. Besides potentially leading to an underestimation of the variance of used estimators (Saarela et al. 2016), errors in input data in forest planning systems can accumulate in magnitude, particularly over long planning horizons such as the 10–15 years that are the typical time frame in which area-based inventories are updated (Haara 2005). Such accumulated errors can in turn lead to suboptimal decisions and economic losses in forest planning, for example by affecting the selection of treatments aimed at maximizing economic returns and carbon payments (Ruotsalainen 2021).
Field data obtained from sample plots are affected by various sources of error, including measurement errors, model errors, and positioning errors, which can reduce the reported accuracies of ALS-based predictions (Persson et al. 2022). With ongoing advancements and increasing accuracy in remote sensing techniques, the influence of uncertainties in field plot data on the accuracies of remote sensing-based predictions is becoming increasingly evident. Full census data are generally not feasible for forest inventories due to the extensive fieldwork and associated costs. Thus, in obtaining accurate field plot data, the costs of data collection should be balanced with the quality of the collected data for decision-making (Kangas 2010). This tradeoff is commonly addressed by selecting a sample from the observed population for measurement, determining an appropriate sample size, and limiting the number of characteristics to be measured (Husch et al. 2002).
On a sample plot, easily observed characteristics such as species and diameter at breast height (dbh) are typically recorded for all trees with a dbh above a certain threshold, such as 5 cm. In contrast, more costly measurements such as tree height, are taken from a smaller subsample of trees (Lappi et al. 2006); hereafter sample trees. Models are then commonly developed that relate tree height to dbh (HD models) and used to predict missing heights based on the measured dbh (Sharma et al. 2015). Stem volume is even more difficult to measure in the field and is therefore commonly predicted using allometric models dependent on dbh and height (Hansen et al. 2023).
Sample trees can be selected using several sampling methods (Schreuder et al. 1993). In Norway, sample trees are commonly selected using a relascope, where every nth tree of the relascope sample is selected for height measurement. This implies that sample trees are selected with a probability proportional to basal area (Bitterlich 1984). Methods used for selecting sample trees may impact HD models and subsequent height and volume predictions for individual trees. Uncertainty from those models as well as measurement errors can in turn propagate to calculated plot values of, e.g., volume, Lorey’s mean height, and dominant height (Moundounga Mavouroulou et al. 2014; Magnussen et al. 2020). Furthermore, additional uncertainty may arise from differences in how tree heights and volumes are aggregated within plots, for example due to alternative methods for estimating dominant height from heights of trees within a plot (Ochal et al. 2017).
In area-based inventories in Norway, fixed-area circular plots of 250 m2 are conventionally used, for which field procedures and calculation methods have largely been standardized. The plots are commonly distributed throughout the inventory area following stratified sampling designs, the strata representing forest types according to dominant tree species, forest maturity class, and site productivity. Typically, around 40 plots are allocated to each stratum, with approximately 10 sample trees selected for height measurement on each plot. Various plot attributes are routinely computed, including the number of trees, basal area, mean diameter weighted by basal area, volume, Lorey’s mean height, and dominant height. The number of trees, basal area, and mean basal area diameter are calculated from the callipered trees, making these calculations relatively straightforward and solely influenced by measurement errors. Volume is calculated as above-bark volume per hectare, while Lorey’s mean height is defined as the mean tree height, weighted by basal area (Næsset 1997). For dominant height, various terms and definitions have been proposed (Rennolls 1978; Tarmu et al. 2020), however in Norway it is defined as the mean height of the 100 largest trees per hectare according to dbh (Sharma et al. 2011).
Previous studies have investigated the effects of measurement errors on tree volume predictions (Berger et al. 2014) as well as the effects of model errors on forest inventory estimates (Breidenbach et al. 2014). Accuracies of plot-level values of volume, Lorey’s mean height, and dominant height can be influenced by the methods used to select sample trees (Magnussen et al. 2020). While the potential impacts of these procedures on calculated plot values have been highlighted (Ochal et al. 2017), no empirical studies have explored the effects of numbers of sample trees on the accuracies of calculated plot values. In addition, no previous studies have comprehensively assessed the effects of sample tree selection methods and calculation methods on accuracies of field plot data.
This study aimed to assess the effects of sample tree selection methods and calculation methods on accuracies of field plot values in area-based forest inventories. The specific objectives were to:
• Assess the effects of the number of sample trees and sample tree selection methods on the accuracies of field plot values of volume, Lorey’s mean height, and dominant height.
• Compare a range of calculation methods for the studied plot attributes by quantifying the accuracy of each method.
2 Materials and methods
2.1 Study area
We used field data obtained from sample plots from the Norwegian national forest inventory (NFI; n = 5625) and 45 local forest management inventories (FMI; n = 6795) in South Norway (Fig. 1). Further details are provided in the following sections. The main tree species in the study area are Norway spruce (Picea abies (L.) Karst.), Scots pine (Pinus sylvestris L.), and deciduous species, mainly birch (Betula pendula Roth and B. pubescens Ehrh.). The FMIs were carried out by the forest owners’ cooperatives Allskog SA, AT Skog SA, Glommen Mjøsen Skog SA, and Viken Skog SA.
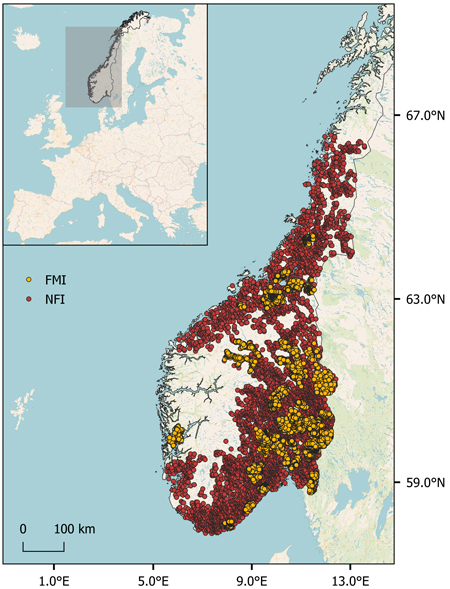
Fig. 1. Locations of circular sample plots of 250 m2 measured as part of the Norwegian national forest inventory (NFI, n = 5625) and 45 local forest management inventories (FMI, n = 6795) in Norway.
2.2 Data collection – national forest inventory
The Norwegian NFI, established in 1919, provides nationwide forest data through a systematic network of permanent sample plots (Breidenbach et al. 2020). The current sampling design was introduced during the 6th inventory cycle (1986–1993), and since 1994, the NFI has operated as a continuous inventory, in which one-fifth of the plots are measured annually, resulting in a five-year cycle. Except for high mountain areas and some northern regions, the sample plots are distributed on a 3×3-km grid (Viken 2021).
On circular sample plots of 250 m2, tree attributes such as species and dbh are recorded for all trees with a dbh ≥ 5 cm. Around 10 sample trees are selected on each plot for height measurement, with selection probability proportional to basal area, i.e., trees with larger basal area have a greater probability of being selected. If there are fewer than 10 trees on the plot, all tree heights are measured using hypsometers. The forest maturity class is determined for each plot based on stand age, the dominant tree species, and site productivity, following a Norwegian classification system outlined in Anon. (1987). Class I signifies recently clear-felled stands, class II represents regeneration forests with satisfactory density, typically with a height < 10 m, class III signifies younger production forests capable of yielding timber, class IV represents older production forests on the way to becoming mature for harvesting, in which thinning is often applicable, and class V signifies mature forests ready for harvest. In this study, we used sample plots with forest maturity classes of III–V measured in the years 2019–2023 in South Norway, omitting split plots for which inventory practices differ. This comprised a total of 5,625 plots from the NFI.
2.3 Data collection – forest management inventories
Sample plot data acquired as part of 45 FMIs were collected in the years 2004 to 2021. In total, the FMIs comprised 6795 circular sample plots of 250 m2. In accordance with standard practices in Norwegian FMIs, the plots were distributed across the inventory areas using stratified designs, with strata representing different forest types in terms of dominant tree species, site productivity, and forest maturity class. Although the sampling followed probability-based principles in some inventories, deviations from strict probability sampling occurred in others due to practical considerations such as plot clustering, re-measurement of plots from a previous inventory or other operational constraints.
In the inventories, stands were delineated from aerial images and the dominant tree species was interpreted from the images for each stand. Site productivity was characterized as the site index, which in Norway denotes the expected dominant height at the breast height age of 40 (Tveite 1977). The site index was determined for each stand based on a combination of photo interpretation, field observations, and information obtained from previous inventories. The forest maturity class was determined for each plot following the same classification system as in the NFI, and plots of classes of III-V were used in the analysis. On each sample plot, all trees with a dbh above a specific caliper limit were recorded. The caliper limits varied across the FMIs and strata. The species was recorded for each tree, and dbh was measured with mm precision. Typically, around 10 sample trees were selected on each plot for height measurement using a relascope, consistent with the field protocol used on NFI plots. Tree heights were measured using hypsometers with dm precision.
2.4 Plot data processing
To compare various numbers of sample trees, sample tree selection methods, and calculation methods across the plot attributes, this study required plot-level reference values of volume, Lorey’s mean height, and dominant height. Thus, reference values of tree heights and volumes were needed for all trees. While the field data comprised dbh for all trees on all plots, heights had only been measured for sample trees, and tree volumes were not directly measured.
To address the abovementioned limitation, we imputed missing tree heights by sampling randomly with replacement from the measured heights of trees. We stratified the imputation by species group (spruce, pine, deciduous), 1-cm diameter class, and forest type. We defined three forest types: (1) forests with maturity class III, (2) spruce-dominated forests with a maturity class of IV or V, and (3) pine-dominated forests with a maturity class of IV or V. We classified the main tree species for each plot as the species with the greatest share of the total basal area on the plot. We further accounted for the geographical location by searching iteratively for measured heights within expanding radii (100–1300 km), favoring the use of geographically close trees.
On the 12 420 sample plots, a total of 374 381 trees were recorded, of which 117 743 had measured heights. To address the uncertainty in imputed heights and consequent uncertainty in calculated plot attributes based on those heights, we repeated the height imputation for each non-sample tree 100 times. In such a way, the plot calculations performed in the analysis (see section 2.6 for details) were repeated 100 times, each time using a newly sampled set of imputed heights for trees whose heights had not been measured. By repeating the calculations multiple times, we captured the range of possible outcomes of individual tree heights and subsequent calculated plot attributes, thus accounting for this variability.
To assess whether the imputation procedure gave realistic tree heights for trees for which heights had not been measured, we also used the imputation procedure to generate heights for sample trees. We compared the imputed heights of sample trees with corresponding field-measured heights, which served as a validation of the imputation procedure.
We computed reference volumes (above bark) for all trees as predictions from species-specific allometric models developed by Hansen et al. (2023), with dbh and height as predictor variables. Thus, we assumed that the published models accurately reflect relationships between dbh, height, and volume for tree species in Norway. We further assumed the measured tree heights and predicted tree volumes to be free of error and assumed these values to accurately represent the forest conditions on the plots. A summary of the obtained field reference data is shown in Table 1.
| Table 1. Summary of tree diameters at breast height (dbh) and heights, and plot-level volume, Lorey’s mean height, and dominant height across the three strata. | |||
| Range | Mean | Standard deviation | |
| Stratum 1 - Younger production forest (144 210 trees, 3714 plots) | |||
| Tree dbh (cm) | 4.0–78.0 | 12.0 | 6.0 |
| Tree height (m) | 1.4–38.1 | 9.9 | 4.2 |
| Tree volume (m3) | 0.0–3.5 | 0.1 | 0.1 |
| Plot volume (m3 ha–1) | 1–719 | 138 | 88 |
| Plot Lorey’s mean height (m) | 4.8–24.7 | 11.3 | 2.4 |
| Plot dominant height (m) | 3.6–38.1 | 15.7 | 4.1 |
| Stratum 2 - Mature forest, spruce-dominated (161 148 trees, 5387 plots) | |||
| Tree dbh (cm) | 4–83.7 | 15.4 | 8.7 |
| Tree height (m) | 1.4–42.6 | 12.0 | 5.7 |
| Tree volume (m3) | 0.0–5.9 | 0.2 | 0.3 |
| Plot volume (m3 ha–1) | 0–1023 | 226 | 144 |
| Plot Lorey’s mean height (m) | 4.3–32.0 | 14.4 | 3.7 |
| Plot dominant height (m) | 4–42.6 | 19.4 | 5.2 |
| Stratum 3 - Mature forest, pine-dominated (69 023 trees, 3318 plots) | |||
| Tree dbh (cm) | 4–97 | 17.0 | 9.7 |
| Tree height (m) | 1.4–33 | 12.1 | 5.4 |
| Tree volume (m3) | 0.0–5.5 | 0.2 | 0.3 |
| Plot volume (m3 ha–1) | 5–1162 | 184 | 110 |
| Plot Lorey’s mean height (m) | 6.6–25.6 | 14.2 | 3.1 |
| Plot dominant height (m) | 5.6–32.2 | 17.6 | 4.1 |
2.5 Plot-level reference values
We computed plot-level reference volumes as the sum of individual tree volumes, scaled to per hectare values. We computed plot-level reference values of Lorey’s mean height as the mean height of trees on the plot, weighted by basal area (Lorey 1878). We computed plot-level reference values of dominant height as the mean height of the two largest trees according to dbh, aligning with established practices in Norwegian FMIs (Fitje 1989). Following conventional criteria for dominant trees (Sharma et al. 2011), on a 250 m2 plot, the two trees with the largest dbh are assumed to rank among the 100 largest trees per hectare.
2.6 Simulations
To assess the effects of sample tree selection methods and calculation methods on accuracies of field plot values in area-based forest inventories, we applied Monte Carlo simulations. The simulations reflected common practices in Norwegian FMIs assisted by ALS data, in which sample plots are distributed within local inventory areas. We applied 1000 replications for each number of sample trees, where for each replication, we selected 151 sample plots from within a geographic region. The number of 151 plots was based on the average number of plots per inventory across the 45 FMIs included in the study (6795 plots in total). To obtain the 151 plots, we first randomly selected one plot, followed by the 150 geographically nearest plots. We then conducted all calculations on the sample plots within each replication, 100 times to account for the uncertainty arising from imputed heights. The calculations are described in the following sections and comprised various numbers of sample trees, sample tree selection methods, and calculation methods. Fig. 2 displays a flowchart showing the analyses performed in each Monte Carlo replication.
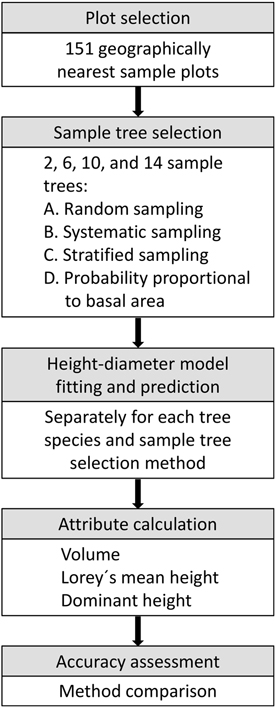
Fig. 2. Analyses performed in each Monte Carlo replication to assess the effects of sample tree selection methods and calculation methods on accuracies of field plot values.
2.7 Sample tree selection
To assess how different sample tree selection methods affected the accuracies of plot values, we compared four numbers of sample trees (2, 6, 10, and 14 trees per plot) and four methods for selecting sample trees. The selection methods were as follows:
A. Random sampling: the required number of sample trees was randomly selected from the full set of trees on the plot.
B. Systematic sampling: every nth tree was selected, where n was determined by the total number of trees and the required number of sample trees.
C. Stratified sampling: the dbh range on each plot was divided into as many equal-width intervals as the number of required sample trees, and one sample tree was randomly selected from each interval.
D. Probability proportional to basal area: trees were selected with probability proportional to their basal area, i.e., larger trees had a greater probability of being selected.
2.8 Height-diameter models
We fitted HD models using the heights and diameters of those trees selected as sample trees on the 151 plots. We fitted separate models for the different species and sample tree selection methods, using a modified version of the Näslund model (Näslund 1936), with one parameter fixed (b3 = 3), following Sharma et al. (2015):

where hij is the height in m of tree j on plot i, dbhij is the corresponding dbh in cm, b1 and b2 are parameters to be estimated, and ui is the random effect associated with plot i. The model error, denoted εij, was assumed to follow a normal distribution with mean zero and a within-plot variance-covariance structure, addressing the hierarchical data structure where sets of trees were grouped within plots. This ensured that the models captured plot-specific HD relationships, as recommended by Eerikäinen (2009) and supported by Mehtätalo et al. (2015). We fitted the models using the nlme package (Pinheiro et al. 2017) in R. We set a minimum of 30 observations for fitting the models. In case fewer than 30 sample trees were available for a given species, we used sample trees from all species to fit the HD model for that species. We then used the HD models to predict the heights of all trees on the 151 plots selected for each replication.
2.9 Calculation methods
2.9.1 Volume
We compared five methods for calculating plot-level values of volume:
I. Using species-specific allometric volume models based on dbh and heights predicted for all trees, including sample trees, using plot-specific HD models (Eq. 1), e.g., Magnussen et al. (2020).
II. Method I, however retaining measured heights of sample trees, i.e., only using predicted heights for non-sample trees, e.g., Hawryło et al. (2017).
III. Using ratio estimation (see details below), e.g., Ørka et al. (2018).
IV. Method III, however retaining reference volumes of sample trees, i.e., only using tariff volumes for non-sample trees, e.g., Breidenbach et al. (2020).
Ratio estimation is the standard practice both in the Norwegian NFI and in FMIs and involves predicting the heights of all trees using standardized height models with dbh as a predictor variable (Vestjordet 1968; Fitje et al. 1977; Eid et al. 1993). The dbh and predicted height are then used to predict a “tariff volume” for each tree using published allometric volume models (Carron 1971). For sample trees, volumes are predicted using the dbh and measured height as input in the same published models. If sample trees are selected with a probability proportional to basal area, species- and plot-specific mean ratios between volumes and tariff volumes are then estimated (mean of ratios). The ratios are then used to adjust the tariff volumes of all calipered trees. If sample trees are selected with equal probability, a ratio of means estimator is applied, i.e., based on species- and plot-specific ratios between mean volumes and mean tariff volumes. We used Hansen et al. (2023) volume models with dbh and height as input variables.
When applying ratio estimation as described in the above, some plots may lack sufficient representation for a particular tree species. In those cases, the ratio for that species is commonly estimated using pooled data from all plots within the stratum. We set a minimum of two trees per plot for a given species. In instances where fewer trees were recorded for a given species, we computed the ratio based on all trees of that species within the respective stratum for that replication.
For method III, we multiplied the tariff volumes with the estimated ratios to obtain volumes for all trees. For method IV, we only multiplied tariff volumes of non-sample trees with the obtained ratios, retaining reference volumes of sample trees. For all methods of volume calculation, we calculated the total volume for each plot as the sum of tree volumes, scaled to per hectare values.
2.9.2 Lorey’s mean height
We compared four methods for calculating plot-level values of Lorey’s mean height:
I. The mean height of sample trees, weighted by basal area, e.g., Næsset (1997).
II. The mean predicted height of all trees on the plot, weighted by basal area, e.g., Magnussen et al. (2012).
III. Method II, however retaining field-measured heights of sample trees, e.g., Hansen et al. (2017).
IV. Model-assisted estimation.
For method I and in case sample trees were selected with probability proportional to basal area, the unweighted mean instead of the mean weighted by basal area was used to avoid bias. For method IV, we estimated the mean predicted height of all trees on the plot, weighted by basal area, and corrected with the mean difference between predicted and observed heights of sample trees:

where Hlor is the Lorey’s mean height calculated for plot i in m, N is the total number of trees on the plot, gij is the basal area of tree j on plot i, ![]() is the corresponding height in m predicted using a HD model, n is the number of sample trees on the plot, gis is the basal area of sample tree s in m2,
is the corresponding height in m predicted using a HD model, n is the number of sample trees on the plot, gis is the basal area of sample tree s in m2, ![]() is the predicted height of sample tree s and his is the field-measured height of sample tree s. Like method I, the second term was not weighted by basal area in case of sample tree selection with a probability proportional to basal area:
is the predicted height of sample tree s and his is the field-measured height of sample tree s. Like method I, the second term was not weighted by basal area in case of sample tree selection with a probability proportional to basal area:

2.9.3 Dominant height
We compared five methods for calculating plot-level values of dominant height:
I. The mean predicted height of the two largest trees on the plot according to dbh, e.g., de Lera Garrido et al. (2023).
II. Method I, however retaining the measured heights of sample trees, e.g., Kangas et al. (2018).
III. The mean measured height of the two largest sample trees, e.g., Næsset (2004).
IV. Method III in case both dominant trees on the plot were selected as sample trees. If this was not the case, the height of the single largest sample tree was used (Næsset 2002).
V. The mean predicted height of the dominant trees on the plot, corrected with the ratio between reference and predicted dominant tree heights:

where Hdom i is the dominant height calculated for plot i in m, nid is the number of dominant trees on the plot, ![]() is the height predicted for dominant tree d using the HD model, and hid is the corresponding field-measured height. In case both dominant trees on the plot were selected as sample trees, the numerator of the first term and the denominator of the second term cancel each other out. Thus, in those cases, the estimator becomes the mean of the measured heights of the dominant trees on the plot. In cases where only one dominant tree was selected as a sample tree, the observed height of that tree is used to estimate the ratio in the second term of the estimator. In cases where neither of the dominant trees on the plot had been measured for height, the estimator becomes the mean predicted height of the dominant trees.
is the height predicted for dominant tree d using the HD model, and hid is the corresponding field-measured height. In case both dominant trees on the plot were selected as sample trees, the numerator of the first term and the denominator of the second term cancel each other out. Thus, in those cases, the estimator becomes the mean of the measured heights of the dominant trees on the plot. In cases where only one dominant tree was selected as a sample tree, the observed height of that tree is used to estimate the ratio in the second term of the estimator. In cases where neither of the dominant trees on the plot had been measured for height, the estimator becomes the mean predicted height of the dominant trees.
2.10 Accuracy assessment
For each replication, we evaluated the accuracies of the calculated plot-level values of volume, Lorey’s mean height, and dominant height using the root mean square error between reference and calculated plot values, relative to the mean reference value (RMSE%):
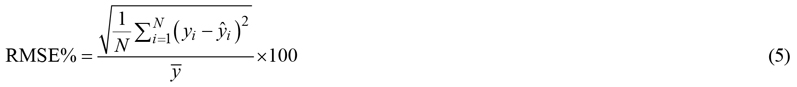
where yi is the reference value for plot i (either volume, Lorey’s mean height, or dominant height), ![]() is the corresponding calculated value, and
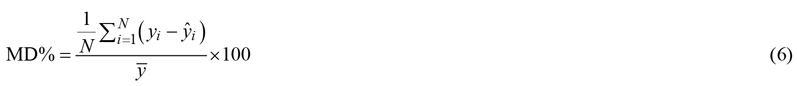
is the corresponding calculated value, and ![]() is the mean reference value for the replication. We further computed the mean differences between reference and calculated plot values, relative to the mean reference value (MD%):
is the mean reference value for the replication. We further computed the mean differences between reference and calculated plot values, relative to the mean reference value (MD%):
The simulation entailed repeatedly selecting sample trees using various selection methods, calculating plot values of the studied plot attributes, and assessing the accuracy in terms of RMSE% and MD%. After completing the 1000 replications, we evaluated the stabilization of RMSE% and MD% values obtained for the studied plot attributes, numbers of sample trees, sample tree selection methods, and calculation methods. We determined stabilization following McRoberts et al. (2023) by assessing whether the maximum accumulated standard deviation of RMSE% and MD% values from the last 50% of replications deviated by no more than 0.5% from the accumulated standard deviation across all replications.
We further conducted an analysis of variance (ANOVA) using linear models to evaluate the main effects and two-way interactions among the studied factors: plot attribute, numbers of sample trees, sample tree selection method, and calculation method on obtained values of RMSE% and MD%. Each model included all possible two-way interactions, and Type III sum of squares was used for the ANOVA to assess the significance of these effects. To interpret practical significance, we calculated partial eta-squared values (η2) for each effect. Additionally, p-values were adjusted using the Bonferroni correction to account for multiple comparisons and avoid Type I errors, by which we multiplied the obtained p-values by the number of comparisons (Neyman and Pearson, 1928).
3 Results
We obtained a mean RMSE of 2.7 m for heights imputed for sample trees (Table 2), corresponding to 19% relative to the mean of measured tree heights. Values of RMSE% obtained for imputed tree heights ranged from 17.1% to 22.7% across strata (forest types) and species, with MD% values close to zero in most cases. Errors varied moderately between species and strata.
| Table 2. Root mean square errors (RMSE%) and mean differences (MD%) between field-measured tree heights and the mean of the 100 corresponding imputed heights, relative to the mean field-measured height obtained for sample trees across species and strata (forest types). | ||||||
| Stratum | ||||||
| 1 | 2 | 3 | ||||
| RMSE% | MD% | RMSE% | MD% | RMSE% | MD% | |
| Spruce | 17.1 | 0.0 | 17.8 | –0.3 | 17.9 | –0.2 |
| Pine | 18.1 | –0.5 | 17.6 | –0.6 | 19.8 | –0.4 |
| Deciduous | 20.8 | –0.4 | 22.7 | –0.2 | 21.2 | 0.1 |
The 1000 replications were sufficient for the results to stabilize according to the criteria described in 2.10. For calculated plot values of volume and Lorey’s mean height, sample tree selection with a probability proportional to basal area gave the greatest accuracy, while for dominant height, systematic and stratified sampling gave the greatest accuracy (Table 3). Accuracies improved with increasing numbers of sample trees for all plot attributes, sample tree selection methods, and calculation methods (Fig. 3). For all calculation methods, we obtained greatest accuracies by retaining field-measured heights for sample trees and using heights predicted with a HD model for non-sample trees.
| Table 3. Mean values of root mean square errors relative to the observed mean values (RMSE%), and mean differences (MD%) in parentheses, obtained for the calculated field plot values in the Monte Carlo simulation in which we sampled 151 plots in each replication, and compared numbers of sample trees, sample tree selection methods and calculation methods. | |||
| Volume (m3 ha–1) | Lorey’s mean height (m) | Dominant height (m) | |
| Number of sample trees | |||
| 2 | 11.6 (1.5) | 12.8 (–1.1) | 15.8 (3.8) |
| 6 | 7.9 (0.5) | 7.7 (–0.6) | 10.8 (0.4) |
| 10 | 6 (0.3) | 6.1 (–0.3) | 8.2 (–0.2) |
| 14 | 5 (0.2) | 5.3 (–0.1) | 6.7 (–0.4) |
| Sample tree selection method* | |||
| A | 8.7 (–0.2) | 9.3 (0.1) | 15.6 (2.4) |
| B | 7.5 (1.4) | 7.6 (–1.5) | 8.2 (0.4) |
| C | 7.5 (1.4) | 7.6 (–1.6) | 8.2 (0.4) |
| D | 6.7 (0.1) | 7.5 (0.9) | 9.5 (0.4) |
| Calculation method** | |||
| I | 8.2 (0.6) | 12.4 (–1.3) | 12.4 (–3) |
| II | 6.5 (0.7) | 7.5 (–1) | 7.4 (–1.2) |
| III | 8.1 (0.6) | 5.1 (–0.1) | 13.3 (7.4) |
| IV | 7.6 (0.8) | 6.9 (0.3) | 10.8 (2) |
| V | - (-) | - (-) | 7.9 (–0.7) |
| *A = random sampling; B = systematic sampling, where every nth tree was selected, C = stratified sampling from dbh classes; D = sampling with a probability proportional to basal area. **For volume: I = allometric models; II = method I, retaining reference volumes of sample trees; III = ratio estimation; IV = method III, retaining reference volumes of sample trees. For Lorey’s mean height: I = (basal area-weighted) mean height of sample trees; II = basal area-weighted mean predicted height; III = method II, retaining sample tree heights; IV = model-assisted estimation. For dominant height: I = mean predicted height of the two largest trees; II = method I, retaining sample tree heights; III = mean height of the two largest sample trees; IV = height of the largest sample tree(s); V = mean predicted height of the two largest trees, corrected with the ratio between reference- and predicted sample tree heights. | |||
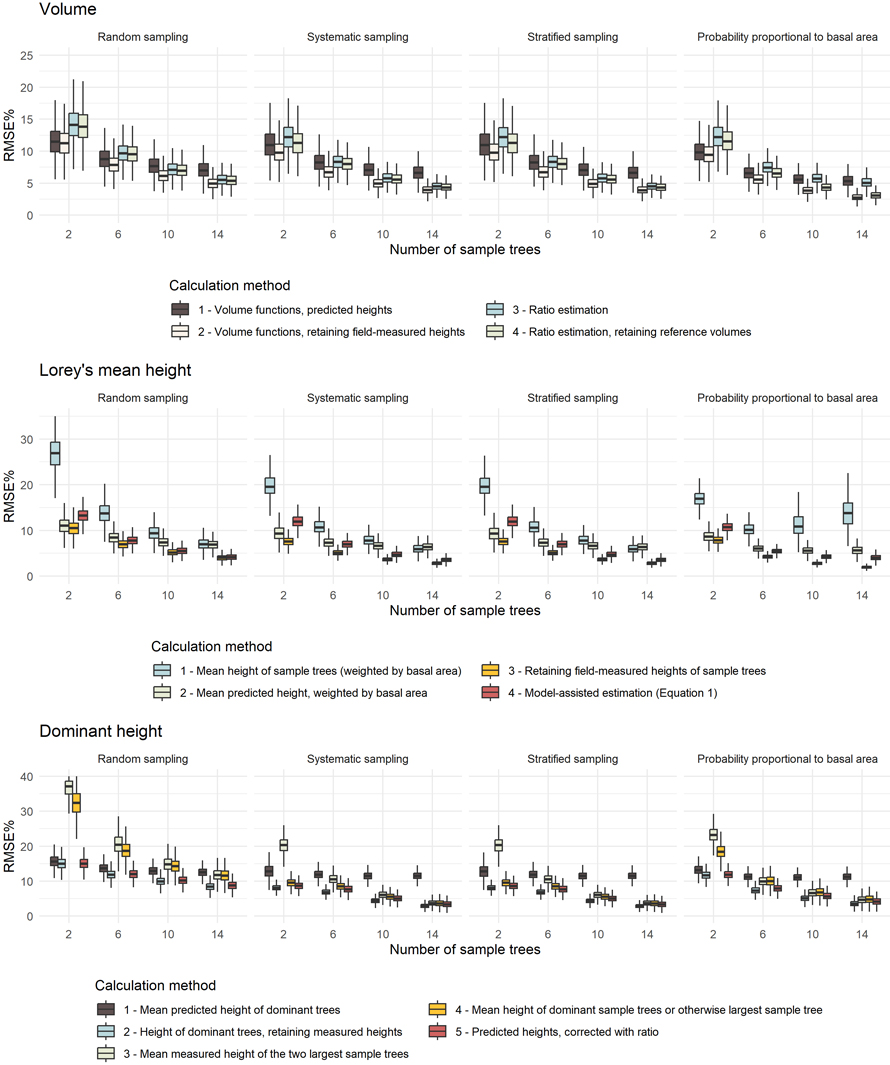
Fig. 3. Root mean square errors relative to the observed mean values (RMSE%) obtained for plot attributes calculated in the Monte Carlo simulation in which we sampled 151 plots in each replication, and compared numbers of sample trees (2, 6, 10, 14), sample tree selection methods, and calculation methods. View larger in new window/tab.
For Lorey’s mean height, there were substantial differences in accuracies obtained for the different calculation methods. The mean tree height weighted by basal area, retaining field-measured heights of sample trees and otherwise predicted tree heights for non-sample trees, gave the greatest accuracy. Similarly, for dominant height, the mean height of the two largest trees, retaining field-measured heights, gave the greatest accuracy. This result underscores the importance of using field-measured heights where available, minimizing uncertainties resulting from model predictions of tree heights.
The ANOVA revealed that all main effects and interactions were statistically significant (p < 0.01). For RMSE%, the number of sample trees had the largest effect size (η² = 0.12, Table 4), indicating a strong influence on the accuracy on field plot values. The calculation method had a moderate effect (η² = 0.07), while other factors, such as the sample tree selection method and two-way interactions, including sampling × number of sample trees and number of sample trees × calculation method, had small to moderate effect sizes (η² ≤ 0.06). For MD%, the calculation method had a large effect size (η² = 0.15). Interaction terms, particularly sampling × method and number of sample trees × method, had moderate effects, while main effects of sample tree selection and number of sample trees were small (η² ≤ 0.03).
| Table 4. Partial eta-squared values (η2) obtained for main effects and two-way interactions in the analysis of variance (ANOVA) obtained for root mean square error relative to the observed mean values (RMSE%) and mean difference relative to the observed mean values (MD%). | ||
| Factor | RMSE% | MD% |
| η2 | η2 | |
| Sampling* | 0.03 | 0.03 |
| n.samp.tree** | 0.12 | 0.00 |
| method*** | 0.07 | 0.15 |
| sampling:n.samp.tree | 0.03 | 0.01 |
| sampling:method | 0.03 | 0.07 |
| n.samp.tree:method | 0.06 | 0.09 |
| * = sample tree selection method; ** = number of sample trees; *** = calculation method. | ||
4 Discussion
The main objective of this study was to assess the effects of sample tree selection methods and field plot calculation methods on accuracies of field plot data in area-based FMIs. To address this, we conducted a systematic evaluation of how different numbers of sample trees and selection methods, as well as calculation methods, influenced plot values of forest attributes. The results provide a basis for improving field protocols and the methods used to calculate plot-level values in FMIs. We simulated conventional practices in area-based FMIs where tree measurements are collected from sample plots distributed within an inventory area and used to compute the field plot values. We assessed the effects of various numbers of sample trees and sample tree selection methods on the accuracies of plot values of volume, Lorey’s mean height, and dominant height. We further compared a range of calculation methods for the studied plot attributes and assessed whether the results were consistent across forest types regarding species and maturity class.
The observed improvement in accuracies of plot values with increasing number of sample trees was consistent with the expected outcome of more extensive field measurements contributing to reduced uncertainty in height and volume estimates. In determining the number of sample trees, however, the challenge lies in balancing the time and cost involved in fieldwork and achieving the desired accuracy (Kangas 2010). In Norwegian forest inventories, it has been common practice to select around 10 sample trees on each plot. While the results demonstrated substantially smaller accuracies with only two sample trees, the differences in accuracies between 10 and 14 were generally modest for most attributes and sample tree selection methods; in most cases within a few percentage points of RMSE. The magnitude of the RMSE in relation to the number of sample trees will be influenced by the correlation and variation in functional form between dbh and tree height on both plot level, and among plots within the inventory area. A stable HD-relationship among plots will allow selecting fewer sample trees on each plot, and rather construct models based on pooled sample tree data across plots. However, further research is needed to assess the balance between the costs of different numbers of sample trees and the resulting accuracies.
We compared four sample tree selection methods and found that the method had a statistically significant effect on the obtained accuracies of plot values, and that overall, selection with a probability proportional to basal area gave the greatest accuracies. This result aligns with the earlier work of Storås (2022), who found that sample tree selection using a relascope gave the greatest accuracy. However, it must be noted that the four tested selection methods represent only some apparent and known alternatives, and other methods could be tested. For example, sample trees could be selected in proportion to the approximate species composition on the plot (Curtis 2000). While alternative methods could be explored, the selection method that yielded the greatest accuracy, i.e., selection with a probability proportional to basal area, is the standard method in Norway, both in the NFI and in FMIs, justifying its continued use.
A main finding was that it was beneficial to retain field-measured heights of sample trees in the calculations for all three plot attributes. This is the standard procedure in the Norwegian NFI and the Forest Resource Map SR16 (Breidenbach et al. 2020). Taking advantage of these measurements when available led to a reduction in both RMSE% and MD%, an effect that would likely be even more pronounced in cases where the HD models were less accurate. In this study, missing heights were predicted using a modified version of the Näslund model (Eq. 1), which has been shown to adequately describe HD relationships across various forest types in Norway and without significant bias (Sharma et al. 2015). Alternatively, published allometric models can be used to predict heights of non-sample trees, or an imputation like the procedure we used to obtain reference heights for non-sample trees. Because this study focused on comparing numbers of sample trees, sample tree selection methods, and plot data calculation methods, we did not investigate such alternative approaches for predicting heights of non-sample trees. However, more research is needed to specifically address the impact of different methods for obtaining heights of non-sample trees in the context of area-based forest inventories.
For volume calculation, we obtained greatest accuracies by predicting volumes for all trees using published allometric volume models, retaining reference heights of sample trees and only using heights predicted with HD models for non-sample trees (method II). The standard practice for calculating plot values of volume in the Norwegian FMIs, namely, ratio estimation without retaining measured tree heights (method IV), resulted in greater errors; with a mean RMSE% that was 1.3 points greater (Table 3). We assumed the published allometric volume models used in both these methods to be free of error, leaving two sources of uncertainty for ratio estimation: the standardized height models used to predict heights using the dbh as the only predictor, and the estimated ratios between reference volumes and tariff volumes. In contrast, tree volumes predicted using published allometric models with measured dbh and predicted tree heights only had the HD model error as a source of uncertainty. This resulted in more accurate volume predictions for individual trees in methods I and II than those estimated using methods III and IV.
While our ranking of methods for calculating all target forest attributes was relatively consistent, as indicated by the median and mean RMSE%, it is important to note that extreme forest conditions in our dataset may not yield the same rankings. This is illustrated in Fig. 3, which shows significant overlap in the RMSE% distributions. Additionally, the ANOVA analysis revealed that the number of sample trees, sample tree selection method, calculation method, and forest type significantly influenced the accuracy of the forest attribute predictions. Consequently, it is crucial to make informed choices rather than simply selecting the top-performing methods from our study.
The NFI comprises a representative sample of plots that covers the variability in forest characteristics in South Norway. Likewise, the plot data obtained from the 45 FMIs spanned a wide range of forest types over large parts of the country. However, only about 10 sample trees were selected on each plot in both datasets. Because our analysis required reference heights for all trees, we imputed heights of non-sample trees using field-measured heights of similar trees in terms of species, forest type, dbh, and geographical location. We further repeated all calculations 100 times, each time using a newly sampled set of imputed heights for trees whose heights had not been measured. While the imputation limited the variability in imputed tree heights to the range of field-measured heights of sample trees, we considered the resulting semi-synthetic dataset to accurately reflect Norwegian forest conditions, given the substantial number of trees with measured heights (117 872 out of 374 462).
It should be noted that height imputation for approximately two-thirds of the trees in the dataset may have influenced the accuracies obtained for the different methods, and reduced the variance explained by the random effect in the HD models. Under realistic conditions, where only measured heights are used for fitting HD models, the plot effect would account for more of the variance in tree height, resulting in more accurate predictions and better performance of calculation methods relying on HD models. Additional analyses confirmed these findings: models fitted using field-measured heights for sample trees and imputed heights for tally trees showed greater plot-effect variance and poorer fit compared to models fitted using only field-measured heights. Furthermore, the analysis was limited to a single HD model form and a fixed set of sample tree selection and plot calculation methods. Testing other modeling techniques and sampling methods could give further insights and could be considered in future research.
We treated the measured and imputed heights, as well as predicted tree volumes, as error-free. However, measurement errors of tree height can be expected to be approximately 3% of the tree height (Bollandsås et al. 2023), and imputation of missing heights introduced further uncertainty (RMSE% of 17.1–22.7, Table 2). Moreover, additional uncertainty arose from predicting tree volumes, which could be expected to be RMSE% of 12.7–19.7 (Hansen et al. 2023). Nonetheless, such errors can be expected to be consistent across the various numbers of sample trees, sample tree selection methods and calculation methods. Therefore, the errors will only have affected the magnitude of the obtained accuracies, and not the relative performance of the tested numbers of sample trees, sample tree selection methods and calculation methods.
5 Conclusions
Five main conclusions can be drawn from this study:
1. Accuracies of field plot values were significantly affected by the number of sample trees, sample tree selection method and calculation method.
2. Using field-measured heights of sample trees in the calculations resulted in greater accuracies compared to using heights predicted using HD models, highlighting the benefit of using field measurements in the calculations when available.
3. Overall, we obtained greatest accuracies by selecting sample trees with a probability proportional to basal area.
4. We obtained greatest accuracies for plot values of volume by using published species-specific allometric volume models, based on the measured dbh, field-measured heights of sample trees, and predicted heights of non-sample trees.
5. We obtained greatest accuracies in calculating Lorey’s mean height and dominant height by retaining field-measured heights for sample trees and predicting heights for non-sample trees using a HD model.
Funding
This research is part of the Centre for Research-based Innovation SmartForest: Bringing Industry 4.0 to the Norwegian forest sector (NFR SFI project no. 309671, smartforest.no).
Acknowledgements
We thank Allskog SA, AT Skog SA, Glommen Mjøsen Skog SA and Viken Skog SA for generously sharing their data, as well as all those involved in collecting and processing the sample plot data.
Declaration of openness of research materials, data, and code
The research data used in this study are proprietary and subject to confidentiality agreements and cannot be openly shared. Detailed metadata describing the data collection methods, variables, and structure have been made openly available to ensure transparency. The statistical code used in the analyses is available upon request. The raw data supporting this study are not publicly available due to ownership and confidentiality constraints. This study and the analysis plan were not preregistered.
Authors’ contributions
Conceptualization: LN, TG, JB, RE, EN, HOØ, OMB; Data curation: LN, TG, RE, OMB; Formal analysis: LN; Writing – original draft: LN; Writing – review & editing: LN, TG, JB, RE, EN, HOØ, OMB.
Declaration of the use of generative artificial intelligence and AI-assisted technologies in the writing process
The authors used OpenAI’s ChatGPT to assist with editing and enhancing the clarity of the text. All AI-generated outputs were carefully reviewed and revised to ensure accuracy and coherence.
References
Anon (1987) Handbok for planlegging i skogbruket. [Handbook for forest planning]. Landbruksforlaget Oslo, Norway.
Berger A, Gschwantner T, McRoberts RE, Schadauer K (2014) Effects of measurement errors on individual tree stem volume estimates for the Austrian National Forest Inventory. For Sci 60: 14–24. https://doi.org/10.5849/forsci.12-164.
Bitterlich W (1984) The relascope idea. Relative measurements in forestry. Commonwealth Agricultural Bureaux.
Bollandsås OM, Eid TH, Hansen EAA (2023) Systematic and random errors of height measurements of individual trees using Vertex hypsometer. MINA fagrapport 87. Norwegian University of Life Sciences, Ås.
Breidenbach J, Antón-Fernández C, Petersson H, McRoberts RE, Astrup R (2014) Quantifying the model-related variability of biomass stock and change estimates in the Norwegian National Forest Inventory. For Sci 60: 25–33. https://doi.org/10.5849/forsci.12-137.
Breidenbach J, Granhus A, Hylen G, Eriksen R, Astrup R (2020) A century of National Forest Inventory in Norway – informing past, present, and future decisions. For Ecosyst 7, article id 46. https://doi.org/10.1186/s40663-020-00261-0.
Carron L (1971) Volume tariff systems. Forestry 44: 145–145. https://doi.org/10.1093/forestry/44.2.145.
Curtis RO (2000) True fir-hemlock spacing trials: design and first results. PNW-GTR-492. US Department of Agriculture, Forest Service, Pacific Northwest Research Station. https://doi.org/10.2737/.
de Lera Garrido A, Gobakken T, Hauglin M, Næsset E, Bollandsås OM (2023) Accuracy assessment of the nationwide forest attribute map of Norway constructed by using airborne laser scanning data and field data from the national forest inventory. Scand J For Res 38: 9–22. https://doi.org/10.1080/02827581.2023.2184488.
Eerikäinen K (2009) A multivariate linear mixed-effects model for the generalization of sample tree heights and crown ratios in the Finnish National Forest Inventory. For Sci 55: 480–493. https://doi.org/10.1093/forestscience/55.6.480.
Eid T, Fitje A (1993) Variations within stands for volume, basal area, number of trees, mean diameter and mean height. Communications of Skogforsk 46.
Fassnacht FE, White JC, Wulder MA, Næsset E (2024) Remote sensing in forestry: current challenges, considerations and directions. Forestry 97: 11–37. https://doi.org/10.1093/forestry/cpad024.
Fitje A (1989) Tremåling. [Tree Mensuration]. Landbruksforl, Oslo. ISBN 9788252910971.
Fitje A, Vestjordet E (1977) Stand height curves and new tariff tables for Norway spruce. Meddelelser Fra Norsk Institutt for Skogforskning 34: 23–68.
Goodbody TR, Coops NC, Irwin LA, Armour CC, Saunders SC, Dykstra P, Butson C, Perkins GC (2024) Integration of airborne laser scanning data into forest ecosystem management in Canada: current status and future directions. For Chron 100: 238–258. https://doi.org/10.5558/tfc2024-014.
Hansen E, Rahlf J, Astrup R, Gobakken T (2023) Taper and volume models for spruce, pine and birch in Norway. Scand J For Res 38: 413–428. https://doi.org/10.1080/02827581.2023.2243821.
Hansen EH, Ene LT, Gobakken T, Ørka HO, Bollandsås OM, Næsset E (2017) Countering negative effects of terrain slope on airborne laser scanner data using procrustean transformation and histogram matching. Forests 8, article id 401. https://doi.org/10.3390/f8100401.
Hawryło P, Tompalski P, Wężyk P (2017) Area-based estimation of growing stock volume in Scots pine stands using ALS and airborne image-based point clouds. Forestry 90: 686–696. https://doi.org/10.1093/forestry/cpx026.
Husch B, Beers TW, Kershaw Jr JA (2002) Forest mensuration. John Wiley & Sons.
Haara A (2005) The uncertainty of forest management planning data in Finnish non-industrial private forestry. DissFor 8. https://doi.org/10.14214/df.8.
Kangas A (2010) Value of forest information. Eur J For Res 129: 863–874. https://doi.org/10.1007/s10342-009-0281-7.
Kangas A, Gobakken T, Puliti S, Hauglin M, Næsset E (2018) Value of airborne laser scanning and digital aerial photogrammetry data in forest decision making. Silva Fenn 52, article id 19. https://doi.org/10.14214/sf.9923.
Lappi J, Mehtätalo L, Korhonen KT (2006) Generalizing sample tree information. In: Kangas A, Maltamo M (eds) Forest inventory. Managing Forest Ecosystems 10. Springer, Dordrecht, pp 85–106. https://doi.org/10.1007/1-4020-4381-3_6.
Lorey T (1878) Die mittlere bestandeshöhe. Allgemeine Forst-und jagdzeitung 54: 149–155.
Magnussen S, Næsset E, Gobakken T, Frazer G (2012) A fine-scale model for area-based predictions of tree-size-related attributes derived from LiDAR canopy heights. Scand J For Res 27: 312–322. https://doi.org/10.1080/02827581.2011.624116.
Magnussen S, Kleinn C, Fehrmann L (2020) Wood volume errors from measured and predicted heights. Eur J For Res 139: 169–178. https://doi.org/10.1007/s10342-020-01257-9.
McRoberts RE, Næsset E, Hou Z, Ståhl G, Saarela S, Esteban J, Travaglini D, Mohammadi J, Chirici G (2023) How many bootstrap replications are necessary for estimating remote sensing-assisted, model-based standard errors? Remote Sens Environ 288, article id 113455. https://doi.org/10.1016/j.rse.2023.113455.
Mehtätalo L, de-Miguel S, Gregoire TG (2015) Modeling height-diameter curves for prediction. Can J For Res 45: 826–837. https://doi.org/10.1139/cjfr-2015-0054.
Moundounga Mavouroulou Q, Ngomanda A, Engone Obiang NL, Lebamba J, Gomat H, Mankou GS, Loumeto J, Midoko Iponga D, Kossi Ditsouga F, Zinga Koumba R (2014) How to improve allometric equations to estimate forest biomass stocks? Some hints from a central African forest. Can J For Res 44: 685–691. https://doi.org/10.1139/cjfr-2013-0520.
Näslund M (1936) Thinning experiments in pine forest conducted by the forest experiment station. Meddelanden fran Statens Skogsforsöksanstalt 29: 1–169.
Næsset E (1997) Determination of mean tree height of forest stands using airborne laser scanner data. ISPRS J Photogramm Remote Sens 52: 49–56. https://doi.org/10.1016/S0924-2716(97)83000-6.
Næsset E (2002) Predicting forest stand characteristics with airborne scanning laser using a practical two-stage procedure and field data. Remote Sens Environ 80: 88–99. https://doi.org/10.1016/S0034-4257(01)00290-5.
Næsset E (2004) Practical large-scale forest stand inventory using a small-footprint airborne scanning laser. Scand J For Res 19: 164–179. https://doi.org/10.1080/02827580310019257.
Ochal W, Socha J, Pierzchalski M (2017) The effect of the calculation method, plot size, and stand density on the accuracy of top height estimation in Norway spruce stands. iForest 10, article id 498. https://doi.org/10.3832/ifor2108-010.
Ørka HO, Bollandsås OM, Hansen EH, Næsset E, Gobakken T (2018) Effects of terrain slope and aspect on the error of ALS-based predictions of forest attributes. Forestry 91: 225–237. https://doi.org/10.1093/forestry/cpx058.
Persson HJ, Ekström M, Ståhl G (2022) Quantify and account for field reference errors in forest remote sensing studies. Remote Sens Environ 283, article id 113302. https://doi.org/10.1016/j.rse.2022.113302.
Pinheiro J, Bates D, DebRoy S, Sarkar D, Heisterkamp S, Van Willigen B, Maintainer R (2017) Package ‘nlme’. In Linear and nonlinear mixed effects models, version 3.1-162.
Rennolls K (1978) “Top Height”; Its definition and estimation. Commonw For Rev 57: 215–219. http://www.jstor.org/stable/42607466.
Ruotsalainen R (2021) Economic losses in forest management due to errors in inventory data. Diss For 318. https://doi.org/10.14214/df.318.
Saarela S, Holm S, Grafström A, Schnell S, Næsset E, Gregoire TG, Nelson RF, Ståhl G (2016) Hierarchical model-based inference for forest inventory utilizing three sources of information. Ann For Sci 73: 895–910. https://doi.org/10.1007/s13595-016-0590-1.
Schreuder HT, Gregoire TG, Wood GB (1993) Sampling methods for multiresource forest inventory. John Wiley & Sons.
Sharma RP, Breidenbach J (2015) Modeling height-diameter relationships for Norway spruce, Scots pine, and downy birch using Norwegian national forest inventory data. For Sci Technol 11: 44–53. https://doi.org/10.1080/21580103.2014.957354.
Sharma RP, Brunner A, Eid T, Øyen BH (2011) Modelling dominant height growth from national forest inventory individual tree data with short time series and large age errors. For Ecol Manage 262: 2162–2175. https://doi.org/10.1016/j.foreco.2011.07.037.
Storås JS (2022) The effect of sample tree selection and calculation methods on the accuracy and precision of volume, mean height, and dominant height at plot-level. Norwegian University of Life Sciences, Ås. https://nmbu.brage.unit.no/nmbu-xmlui/handle/11250/3023837.
Tarmu T, Laarmann D, Kiviste A (2020) Mean height or dominant height – what to prefer for modelling the site index of Estonian forests? For Stud 72: 121–138. https://doi.org/10.2478/fsmu-2020-0010.
Tveite B (1977) Site-index curves for Norway spruce (Picea abies (L.) Karst). Reports of the Norwegian Forest Research Institute 33.1.
Vestjordet E (1968) Merchantable volume of Norway spruce and Scots pine based on relative height and diameter at breast height or 2.5 m above stump level. Meddelelser fra Det Norske Skogforsøksvesen 25: 411–459.
White JC, Wulder MA, Varhola A, Vastaranta M, Coops NC, Cook BD, Pitt D, Woods M (2013) A best practices guide for generating forest inventory attributes from airborne laser scanning data using an area-based approach. For Chron 89: 722–723. https://doi.org/10.5558/tfc2013-132.
Total of 48 references.
Send to email
