Jānis Liepiņš  ,
Jānis Ivanovs,
Andis Lazdiņš,
Jurģis Jansons,
Kaspars Liepiņš
,
Jānis Ivanovs,
Andis Lazdiņš,
Jurģis Jansons,
Kaspars Liepiņš
Mapping of basic density within European aspen stems in Latvia
Liepiņš J., Ivanovs J., Lazdiņš A., Jansons J., Liepiņš K. (2017). Mapping of basic density within European aspen stems in Latvia. Silva Fennica vol. 51 no. 5 article id 7798. https://doi.org/10.14214/sf.7798
Highlights
- Stem bark is significantly denser than wood and does not follow the same variation patterns along the stem
- The main trend in radial variation of wood density was the increase from pith to bark
- There is a weak relationship between mean basic density and commonly measured stand and tree parameters.
Abstract
The objective of this study was to investigate basic density and its within-stem variation by studying 84 European aspen stems from 28 forest stands in Latvia. The studied forest stands covered all age classes from young stands to matured forests in representative growth conditions of European aspen. The densities of 2722 wood and 1022 bark specimens were measured from the sampled trees. Only the knot-free wood specimens without obvious wood defects were chosen for analyses. A map of basic density summarizing its radial and axial variations was constructed to show species-specific, within-stem variability and the relationships between density and tree and stand variables were examined. Stem wood and bark of the European aspen show different patterns of basic density variation along the tree stem. Wood density increases from pith to bark up to certain dimensions and shows a slight decrease afterwards. The weighted basic density of bark (446 ± 39.6 kg m–3) was higher than stem wood density (393 ± 30.4 kg m–3). Our results suggest that wood and bark density measurements obtained at breast height can be used for reliable estimation of the densities of whole-tree stem components, while tree parameters such as diameter at breast height (DBH), tree height and social status or stand parameters, including number of trees, basal area and age, are weak predictors in this context.
Keywords
Populus tremula;
wood quality;
wood density;
bark density;
density variations
-
Liepiņš,
Latvian State Forest Research Institute “Silava”, 111 Rigas Str., LV 2169, Salaspils, Latvia
E-mail
janis.liepins@silava.lv
- Ivanovs, Latvian State Forest Research Institute “Silava”, 111 Rigas Str., LV 2169, Salaspils, Latvia E-mail janis.ivanovs@silava.lv
- Lazdiņš, Latvian State Forest Research Institute “Silava”, 111 Rigas Str., LV 2169, Salaspils, Latvia E-mail andis.lazdins@silava.lv
- Jansons, Latvian State Forest Research Institute “Silava”, 111 Rigas Str., LV 2169, Salaspils, Latvia E-mail jurgis.jansons@silava.lv
- Liepiņš, Latvian State Forest Research Institute “Silava”, 111 Rigas Str., LV 2169, Salaspils, Latvia E-mail kaspars.liepins@silava.lv
Received 1 September 2017 Accepted 7 November 2017 Published 14 November 2017
Views 78570
Available at https://doi.org/10.14214/sf.7798 | Download PDF

Supplementary Files
1 Introduction
European aspen (Populus tremula L.) is one of the world’s most widely distributed tree species (Worrell 1995a). In Fennoscandia, aspen most often occurs as an admixture species in coniferous or birch-dominated stands (Heräjärvi 2009b; Rytter et al. 2016), which makes it difficult to supply to the forest products industries. Territorially scattered timber resources is one of the reasons why, despite the well-known qualities of aspen wood (white-colored, lightweight, homogenous, and easy to machine), its main uses are pulping and energy (Heräjärvi 2009a). Although European aspen is capable of regenerating by root suckers, and natural stands are highly productive (Tsarev 2013), indicating the potential of this native tree species for coppice, the hybrid aspen (Populus tremuloides × P. tremula) is outcompeting the native species in the production of woody biomass in short rotation forestry (Tullus et al. 2012; Smilga et al. 2015). These are the main reasons why European aspen plays only a minor role in forestry in many European countries, as previously ascertained by Rock (2007) and Worrell (1995b).
Unlike in other European countries, European aspen in Latvia is a widespread tree species. According to national forest inventory data, the timber resources total of European aspen in Latvia is 63.4 million m3 (CSB 2015) out of 180 million m3 in the whole Nordic–Baltic region (Rytter et al. 2016). Local industry has found a use for aspen timber in the production of niche products, such as the wooden handles of gardening tools and the interiors of saunas, which makes high-quality aspen logs a desirable raw material in the timber market.
The exploration of wood density variations within stems is important for evaluating wood quality to determine the wood’s optimal use for specific products. Data on basic density in tree stems are also needed for biomass estimation as determined by multiplying the stem volume with the average stem wood density, the determination of the energy potential of wood and the appraisal of carbon stored in the tree stems. For such calculations, not only the wood density but also the density of the bark has to be considered.
The first attempt to study wood density variation in Latvia was made in the 1960s, when variation in aspen wood density among different morphotypes was reported (Smilga 1967). Basic wood density and its variations within the stems of European aspen have been investigated in a few studies in Finland (Kärkkäinen and Salmi 1978; Kärki 2001; Heräjärvi and Junkkonen 2006), while those of trembling aspen (Populus tremuloides Michx.) were studied in North America (Yanchuk et al. 2007). Common features of these studies are that the authors have focused on the technical quality of aspen wood, have mostly dealt with matured trees and have avoided investigations of bark density.
Our purposes are to extend the knowledge of variations in basic density within the stems of European aspen at various tree dimensions and to report the density of aspen bark based on material obtained in Latvia.
2 Materials and methods
The study materials comprised a total of 84 European aspen trees located in 28 forest stands representing a wide range of populations of this species in Latvia. The selected forest stands cover all age classes from young stands to matured forests in conditions suitable for the growth of productive aspen forests – well-drained mineral soils. Temporary, circular plots with an area of 500 m2 were laid out to characterize each stand, and three stems representing the range of social statuses of trees – dominant, codominant and subdominant (FAO 2014) – were sampled for density measurements (Table 1).
| Table 1. Characteristics of the sample trees and stands. | |||||||||
| Tree (N=84) | Stand (N=28) | ||||||||
| DBH, cm | H, m | SWD, kg m-3 | SBD, kg m-3 | SD, kg m-3 | Age, years | G, m2 ha-1 | Number of stems per hectare | ||
| Mean | 13.8 | 16.6 | 393 | 446 | 399 | 23 | 16.1 | 1685 | |
| Min | 2.7 | 3.7 | 337 | 373 | 346 | 5 | 0.5 | 420 | |
| Max | 34 | 29.9 | 472 | 570 | 481 | 76 | 45.2 | 3400 | |
| Std | 8.3 | 8.5 | 30.4 | 39.6 | 29.6 | 18.2 | 11.5 | 782 | |
| DBH – diameter at breast height, H – tree height, SWD – stem wood density, SBD – stem bark density, SD – mean stem density, G – stand basal area, Std – standard deviation. | |||||||||
The tree stems were cross-cut towards the top into 1- or 2-m sections depending on the stem length (1-m sections for stems with a length below 20 m or 2-m sections for stems with a length over 20 m). To determine the weighted wood density of the entire stem and explore its within-stem variation, sample discs were collected at the base of each stem section as well as at a height of 1.3 m and at the midpoint of the first section. The locations of the discs along the stem were expressed as a relative height and ranged from 0(butt) to 100 (top). The sample discs were transported to the laboratory for measurements of basic density, which was defined as the ratio of oven-dry mass to green volume.
The specimens for the knot-free density measurements were prepared from the discs using the scheme presented in the study of Liepiņš et al. (2017). The wood and bark specimens were measured separately, and density was determined using Precisa XB 220A scales equipped with a Precisa density determination set (Part no: 350-8556). Before the density measurements were conducted, all specimens were saturated with water by immersion for 24 hours (Ilic et al. 2000). For the calculation of basic density, all specimens were dried at 105 °C until a constant weight was achieved.
The weighted average formula was used to calculate the mean density of each sample disc from the specimens and their corresponding areas. The weighted density data from sample discs were used to represent axial variation in density in stems. The volume of each stem section (between two sample discs) was estimated using Smalian’s approach (Liepiņš et al. 2017). The density of each stem section was averaged from the values obtained from sample discs at both ends of the section, except for top sections in which the density of base sample discs was used. The weighted average formula was used to calculate mean stem density with bark (SD) from the sections’ densities and corresponding volumes. The same approach was used to calculate mean stem wood density (SWD) and mean stem bark density (SBD).
The relationships between SD, SWD and SBD and tree and stand characteristics were determined using Spearman’s correlation. The effect of tree social status (dominant, codominant and subdominant) on basic density was determined using one-way ANOVA. Data normality assumptions were tested using the Shapiro-Wilk test and Levene’s test was used to test for equality of variances between groups. Trees were sampled in 28 stands; between- and within-stand variations were analyzed using a linear mixed model analysis, in which the predictor variables in the models were treated as fixed effects and stand was treated as a random effect. Calculations were performed using the “lme4” package (Bates et al. 2015) in R software. Basic density variations within stems were modeled using ordinary kriging interpolation techniques in ArcMap 10.5 software.
3 Results
The weighted stem wood density of European aspen was 399 kg m–3, and according to the Wilcoxon test, the difference between SWD and SBD was significant (p < 0.001). Although SBD is greater than SWD by an average of 53 kg m–3 (Table 1), significant differences were found only in the lowest part of the stem – below 60% of relative tree height (Fig. 1).
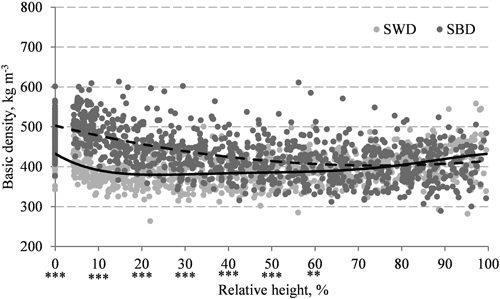
Fig. 1. Mean stem wood density (SWD, solid line) and stem bark density (SBD, dashed line) and their axial variation in European aspen stems. The difference between SWD and SBD was significant at the ***0.001 and **0.01 levels.
The variation in SBD in the axial direction was more pronounced than for SWD, which also indicates the difference in variation patterns along the stem. The correlation analysis revealed a significant, negative correlation between SBD and relative tree height (Table 2), while SWD decreased sharply up to 20% of relative height and increased slightly afterwards. The range of axial density variation along the stem was 96 kg m–3 for SBD and 48 kg m–3 for SWD.
| Table 2. Spearman’s correlation coefficients for basic stem density (SD), stem wood density (SWD), stem bark density (SBD) and tree or stand characteristics. Correlations were significant at the ***0.001, **0.01 and *0.05 levels. | |||||||
| Diameter at breast height | Tree height | Number of stems per hectare | Stand basal area | Stand age | Tree relative height | Distance from pith | |
| SD | 0.12 | 0.12 | –0.29** | 0.1 | 0.12 | –0.06 | |
| SWD | 0.12 | 0.12 | –0.28** | 0.1 | 0.12 | 0.05 | 0.15*** |
| SBD | 0.23* | 0.19 | –0.24* | 0.15 | 0.09 | –0.55*** | |
Except for the negative correlation between SBD and relative tree height, the correlation coefficients indicated only weak relationships between density and tree or stand characteristics; however, some of the relationships were significant. SBD was negatively correlated with the number of stems per hectare (p = 0.031) but positively correlated with DBH (p = 0.033). SWD was positively correlated with the distance from the pith (p < 0.001) but negatively correlated with the number of stems per hectare (p = 0.01), while SD was negatively correlated with the number of stems per hectare (p = 0.006).
The p-value corresponding to the F-statistic of one-way ANOVA is higher than 0.05 testing the effect of tree social status on SD, SWD and SBD, suggesting that the differences are not statistically significant.
The main trend in radial variation in SWD was that density increased from the pith to the bark, while the range of density distributions was reduced towards the top of the stem (Fig. 2). The lowest SWD in aspen stems was at 20–30% of relative tree height near the pith. The largest SWD radial variation was below 30% of relative height, where the mean range of density distributions was 42 kg m–3. The smallest radial variations were found at up to 80% of relative height, where density variation was just 5 kg m–3.
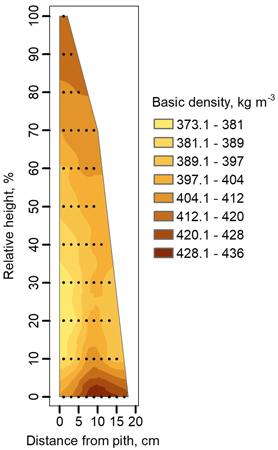
Fig. 2. Basic density variation in stems of European aspen derived from density measurements in wood specimens. A relative height of 0% was defined as 1% of the measured tree height before felling.
Because of the weak relationships between the density and tree characteristics, the mean density data at breast height were used to predict the mean values of SD, SWD and SBD:
![]()
![]()
![]()
where SWD1.3, SBD1.3 and SD1.3 are the mean densities (kg m–3) at breast height for corresponding stem components; u is a random effect for stand k, modeling random intercepts; and ε represents a random effect for tree i in stand k. It is assumed that uk and εki are uncorrelated and normally distributed with means of 0.
Thus, using density at breast height as a predictor, 67%, 72% and 45% of the variations without random effects can be explained for SD, SWD and SBD, respectively (Supplementary file S1). The magnitude of the average prediction error, calculated as the difference between the measured and estimated density values and expressed as the percent error, was smallest for SWD (3.2%) compared to SD (3.3%) and SBD (5.1%). In general, when applying the equations (Eq. 1, Eq. 2, and Eq. 3), the between-stand variance was larger than the within-stand variance, indicating less reliable predictions and larger density variation between stands. Incorporating the additional tree or stand variables (Table 2) into the equations resulted in unacceptably large percent relative standard errors (PRSE > 25%) of the parameter estimates (Sileshi 2014).
4 Discussion
The mean SWD values reported in the literature for European aspen range from 376 kg m–3 to 403 kg m–3 (Smilga 1988; Kärki 2001; Heräjärvi and Junkkonen 2006; Rytter et al. 2016). The mean value of SWD obtained in our study (393 kg m–3) is in line with previously reported values.
In numerous studies, stem biomass has been estimated by multiplying stem volume by wood density (e.g., Cienciala et al. 2006; Repola 2008, 2009). The average proportion of bark in European aspen stems varies from 7% to 23.6%, depending on tree age and size (Liepiņš and Liepiņš 2015); therefore, applying SWD data instead of SD data is causing a underestimation of stem biomass (according to our data up to 4%), as SBD is greater than SWD by an average of 53 kg m–3. The mean SD values derived in our study have not been reported before and can be advised for use if whole-stem biomass needs to be estimated from stem volume with bark. However, if density information at DBH for individual trees is available, the more precise density values can be calculated using equations (1), (2) and (3).
The average density values of European aspen have large variations that cannot be explained by individual tree and stand parameters but is determined by the complex influence of multiple factors. In contrast to SBD, we did not find significant correlations between the tree variables (DBH and tree height) and SD or the tree variables and SWD (Table 2). Variation in SBD between and within stems is affected by the formation of dead rough bark, which is denser than smooth bark and more common in the lower part of stems of matured trees.
At the stand level, the densities of all stem components were significantly correlated with the number of stems per hectare; trees growing in stands with higher stocking tended to have lower wood and bark densities. Notably, this correlation can be explained by the presence of young stands in our data set, as their stand densities are higher, and there is a tendency for younger trees to be associated with lower wood density resulting from rapid growth (Saranpää 2003). Heräjärvi and Junkkonen (2006) reported that the ring width of European aspen decreases considerably after the trees reach an age of 15 years. In general, growth rate has little influence on wood density in Populus spp. (Zhang 1995; Zobel and Jett 1995), which explains why the observed correlations are relatively weak.
We found that axial variation in the SBD of European aspen does not follow the same pattern as does that in SWD; likewise, the range of density variation in stem bark is considerably wider than in wood, as is known for other hardwood and softwood tree species (Hakkila 1989). Erickson (1972) studied SBD in various tree species in North America and noted that for aspen the mean SBD in the merchantable portion of the stem is 505 kg m–3, with slightly lower SBD in the top part of the stem (501 kg m–3). In our study, the mean density of bark was 499 kg m–3 at stump height and 403 kg m–3 in the top part of stems where bark is thinner, revealing larger density variations along the stem than reported in the aforementioned study.
Our observations of within-stem density variations of European aspen wood (Fig. 2) are consistent with findings reported in earlier studies (Kärki 2001; Heräjärvi and Junkkonen 2006). Compared to other common tree species in boreal and hemiboreal forest regions, axial variation in the SWD of aspen is more irregular than that of Scots pine and silver birch, but it is similar to the pattern observed in Norway spruce stems (Repola 2006), since density decreases from the stump towards the top at the lower part of the stem before tending to increase later on (Fig. 1). This variation pattern exists irrespective to the distance from the pith (Suppl. file 2).
The visual assessment of the variation in basic density of young aspen trees (Suppl. file 2: Fig. A3, A5) is suggesting that the map of basic density (Fig. 2) summarizing the radial and axial variations and showing species-specific variability is also valid for the trees with smaller diameters not only for matured trees. In the lower part of the stem (below 50% of relative height), the peak in SWD is reached at a distance of approximately 8–10 cm from the pith. This is an important finding that can help locate the timber of maximum density if the best mechanical properties are desirable for creating specific products from aspen wood.
References
Bates D., Maechler M., Bolker B., Walker S. (2015.) Fitting linear mixed-effects models using lme4. Journal of Statistical Software 67(1): 1–48. https://doi.org/10.18637/jss.v067.i01.
Cienciala E., Černý M., Tatarinov F., Apltauer J., Exnerová Z. (2006). Biomass functions applicable to Scots pine. Trees – Structure and Function 20(4): 483–495. https://doi.org/10.1007/s00468-006-0064-4.
CSB (2015). Tree species in forests of Latvia. http://www.csb.gov.lv/en/statistikas-temas/px_tabulas/tree-species-forests-latvia-43422.html. [Cited 14 Aug 2017].
Erickson J.R. (1972). The moisture content and specific gravity of the bark and wood of northern pulpwood species. Research Note NC-141. U.S. Department of Agriculture, Forest Service, North Central Forest Experiment Station, St. Paul, MN. 3 p.
FAO (2014). Manual for visual assessment of forest crown condition. http://www.fao.org/3/a-i4214e.pdf. [Cited 14 Aug 2017].
Hakkila P. (1989). Utilization of residual forest biomass. Springer-Verlag Berlin Heidelberg. 568 p.
Heräjärvi H. (2009a). Effect of drying technology on aspen wood properties. Silva Fennica 43(3): 433–445. https://doi.org/10.14214/sf.198.
Heräjärvi H. (2009b). Wood product manufacture potential of European and hybrid aspen in Finland. In: Bergstedt A.C.E. (ed.). Proceedings of the 5th meeting of the Nordic-Baltic Network in Wood Material Science and Engineering (WSE) October 1–2, 2009, Copenhagen, Denmark. p. 121–126.
Heräjärvi H., Junkkonen R. (2006). Wood density and growth rate of European and hybrid aspen in southern Finland. Baltic Forestry 12(1): 2–8.
Ilic J., Boland D., McDonald M., Downes G., Blakemore P. (2000). Woody density: phase 1 - state of knowledge. NCAS technical report no. 18. 218 p.
Kärki T. (2001). Variation of wood density and shrinkage in European aspen (Populus tremula). Holz als Roh-und Werkstoff 59(1–2): 79–84. https://doi.org/10.1007/s001070050479.
Kärkkäinen M., Salmi J. (1978). Studies on the measurement and technical properties of aspen logs. Folia Forestalia 455. 45 p. [In Finnish with English summary].
Liepiņš J., Liepiņš K. (2015). Evaluation of bark volume of four tree species in Latvia. Research for Rural Development 2: 22–28.
Liepiņš J., Lazdiņš A., Liepiņš K. (2017). Equations for estimating above- and belowground biomass of Norway spruce, Scots pine, birch spp. and European aspen in Latvia. Scandinavian Journal of Forest Research. 13 p. https://doi.org/10.1080/02827581.2017.1337923.
Repola J. (2006). Models for vertical wood density of Scots pine, Norway spruce and birch stems, and their application to determine average wood density. Silva Fennica 40(4): 673–685. https://doi.org/10.14214/sf.322.
Repola J. (2008). Biomass equations for birch in Finland. Silva Fennica 42(4): 605–624. https://doi.org/10.14214/sf.236.
Repola J. (2009). Biomass equations for Scots pine and Norway spruce in Finland. Silva Fennica 43(4): 625–647. https://doi.org/10.14214/sf.184.
Rock J. (2007). Suitability of published biomass equations for aspen in Central Europe – results from a case study. Biomass and Bioenergy 31(5): 299–307. https://doi.org/10.1016/j.biombioe.2007.01.003.
Rytter L., Ingerslev M., Kilpeläinen A., Torssonen P., Lazdina D., Löf M., Madsen P., Muiste P., Stener L.-G. (2016). Increased forest biomass production in the Nordic and Baltic countries – a review on current and future opportunities. Silva Fennica 50(5) article 1660. https://doi.org/10.14214/sf.1660.
Saranpää P. (2003). Wood density and growth. In: Barnett J.R., Jeronimidis G. (eds.). Wood quality and its biological basis. Blackwell Publishing Ltd, Oxford, UK. p. 87–118.
Sileshi G.W. (2014). A critical review of forest biomass estimation models, common mistakes and corrective measures. Forest Ecology and Management 329: 237–254. https://doi.org/10.1016/j.foreco.2014.06.026.
Smilga J. (1967). Parastās apses koksnes tilpumsvars Latvijas PSR. [Wood density of common aspen in the Latvian SSR]. Jaunākais Mežsaimniecībā 7: 97–99. [In Latvian].
Smilga J. (1988). Apses koksnes blīvums. [Wood density of aspen]. Jaunākais Mežsaimniecībā 30: 54–60. [In Latvian with English summary].
Smilga J., Zeps M., Sisenis L., Kalnins J., Adamovics A., Donis J. (2015). Profitability of hybrid aspen breeding in Latvia. Agronomy Research 13: 430–435.
Tsarev A.P. (2013). Growth and breeding of aspen in Russia. Silvae genetica 62(1–6): 153–160. https://doi.org/10.1515/sg-2013-0020.
Tullus A., Rytter L., Tullus T., Weih M., Tullus H. (2012). Short-rotation forestry with hybrid aspen (Populus tremula L. × P. tremuloides Michx.) in Northern Europe. Scandinavian Journal of Forest Research 27(1): 10–29. https://doi.org/10.1080/02827581.2011.628949.
Worrell R. (1995a). European aspen (Populus tremula L.): a review with particular reference to Scotland I. Distribution, ecology and genetic variation. Forestry: An International Journal of Forest Research 68(2): 93–105. https://doi.org/10.1093/forestry/68.2.93.
Worrell R. (1995b). European aspen (Populus tremula L.): a review with particular reference to Scotland II. Values, silviculture and utilization. Forestry: An International Journal of Forest Research 68(3): 231–244. https://doi.org/10.1093/forestry/68.3.231.
Yanchuk A.D., Dancik B.P., Micko M.M. (2007). Intraclonal variation in wood density of trembling aspen in Alberta. Wood and Fiber Science 15: 387–394.
Zhang S.Y. (1995). Effect of growth rate on wood specific gravity and selected mechanical properties in individual species from distinct wood categories. Wood Science and Technology 29(6): 451–465. https://doi.org/10.1007/BF00194204.
Zobel B.J., Jett J.B. (1995). Genetics of wood production. Springer-Verlag. 337 p. https://doi.org/10.1007/978-3-642-79514-5.
Total of 31 references.
