Anssi Krooks,
Sanna Kaasalainen  ,
Ville Kankare,
Marianna Joensuu,
Pasi Raumonen,
Mikko Kaasalainen
,
Ville Kankare,
Marianna Joensuu,
Pasi Raumonen,
Mikko Kaasalainen
Predicting tree structure from tree height using terrestrial laser scanning and quantitative structure models
Krooks A., Kaasalainen S., Kankare V., Joensuu M., Raumonen P., Kaasalainen M. (2014). Predicting tree structure from tree height using terrestrial laser scanning and quantitative structure models. Silva Fennica vol. 48 no. 2 article id 1125. https://doi.org/10.14214/sf.1125
Highlights
- The analysis of tree structure suggests that trees of different height growing in similar conditions have similar branch size distributions
- There is potential for using the tree height information in large-scale estimations of forest canopy structure.
Abstract
We apply quantitative structure modelling to produce detailed information on branch-level metrics in trees. Particularly we are interested in the branch size distribution, by which we mean the total volume of branch parts distributed over the diameter classes of the parts. We investigate the possibility of predicting tree branch size distributions for trees in similar growing conditions. The quantitative structure model enables for the first time the comparisons of structure between a large number of trees. We found that the branch size distribution is similar for trees of different height in similar growing conditions. The results suggest that tree height could be used to estimate branch size distribution in areas with similar growing conditions and topography.
Keywords
remote sensing;
terrestrial lidar;
tree modelling;
branch size distribution
- Krooks, Finnish Geodetic Institute, Geodeetinrinne 2, FI–02431 Masala, Finland E-mail Anssi.Krooks@fgi.fi
-
Kaasalainen,
Finnish Geodetic Institute, Geodeetinrinne 2, FI–02431 Masala, Finland
E-mail
Sanna.Kaasalainen@fgi.fi
- Kankare, Department of Forest Sciences, University of Helsinki, P.O. Box 27, FI-00014 Helsinki, Finland E-mail ville.kankare@helsinki.fi
- Joensuu, Department of Forest Sciences, University of Helsinki, P.O. Box 27, FI-00014 Helsinki, Finland E-mail marianna.joensuu@alumni.helsinki.fi
- Raumonen, Tampere University of Technology, Department of Mathematics, P.O. Box 553, Tampere, FI-33101, Finland E-mail Pasi.Raumonen@tut.fi
- Kaasalainen, Tampere University of Technology, Department of Mathematics, P.O. Box 553, Tampere, FI-33101, Finland E-mail Mikko.Kaasalainen@tut.fi
Received 25 February 2014 Accepted 23 May 2014 Published 4 June 2014
Views 160075
Available at https://doi.org/10.14214/sf.1125 | Download PDF

1 Introduction
Monitoring the impact of climate change on the environment creates a constantly growing need for accurate 3D information of the biosphere (Dassot et al. 2012; Vonderach et al. 2012). 3D models of forests are used in climate modelling, forest albedo research, forest fire risk estimation, and forest damage mapping (Morsdorf et al. 2004; Sexton et al. 2009; Hyyppä et al. 2012). The branch size distribution of trees also plays an important role in, e.g., the study of forest carbon budget, tree growth, and littering. Assessing the carbon footprint of forests requires information of the size distribution of the above ground biomass, e.g., when logging waste is used as bioenergy (Liski et al. 2014). Accurate information for the use of the current forest and soil carbon models has thus far been limited, because no efficient measurement methods have been available to produce data from trees without labour-intensive, destructive sampling.
Terrestrial and airborne laser scanning (TLS and ALS) are promising methods to produce dense 3D data from forests and single trees but automation of the data processing is a challenge (cf. Eysn et al. 2013). TLS has proved an effective means of producing highly detailed 3D tree information (Aschoff et al. 2004; Vonderach et al. 2012; Eysn et al. 2013; Liang et al. 2014). Decreasing prices and improving performance have increased the use of TLS in forest applications (Dassot et al. 2011). Manual tree reconstruction from TLS data is time consuming and challenging, and the accuracy and completeness of the models depend on, e.g., the design of the models and choice of initial parameters. Automatic 3D tree models have been produced from laser scanner point clouds with algorithms based on reproducing the target structure with voxels or fitting 3D primitives on the tree parts (Côté et al. 2009; Bucksch and Fleck 2011; Dassot et al. 2012; Eysn et al. 2013).
Tree height estimation accuracy has been previously investigated using both aerial (e.g., Wang and Glenn 2008; Vauhkonen 2010) and terrestrial (e.g., Hopkinson et al. 2004; Chasmer et al. 2006; Maas et al. 2008; Kankare et al. 2013; Liang and Hyyppä 2013; Liang et al. 2014) laser scanning data. In ALS based applications the laser pulse penetration into the canopy causes an underestimation of 0.5–2 m, depending on the tree species, canopy shape, and structure, while TLS based methods lead to an underestimation of 1–3 m caused by the measurement geometry, which causes occlusions in the highest parts of the canopy. One way to estimate tree parameters, such as biomass, is to use statistical models developed from manual measurements, especially tree height and diameter at breast height (DBH). The simplified statistical models are limited in accuracy, and cannot give accurate quantitative and geometric information on a single tree, especially in the branch level (Schumacher and Hall 1933; Baskerville 1972; Zianis et al. 2005).
In this paper, a method based on TLS data and accurate quantitative structure models (QSM) (Raumonen et al. 2013) of tree branch structure is applied to produce detailed information on the branch-level metrics. From the QSM, tree characteristics such as branch size distribution or the above ground biomass of a tree can be calculated. We can define the branch size distribution from the QSM as follows: We classify all the cylinders according to their diameter and then sum the volumes of the cylinder in each class. Many of these characteristics have been difficult or even impossible to measure operationally: the measurement requires cutting (which then limits the study to a single measurement instead of time series or group of trees) and laborious field measurements, which are usually hard to perform efficiently or accurately. Our aim is to investigate whether tree height and other ALS derivable tree metrics can be used in large-scale estimations of forest canopy structure and volume when growing conditions are similar.
2 Methods
2.1 Test area
The test area is Located in Evo, southern Finland (61.19°N, 25.11°E). The mean altitude of the area is 135 m (ASL) and the elevation deviations inside the study area are less than 3 m. The area is part of the southern boreal forest zone and consists of broad mixture of varying forest stands, from natural to intensively managed. The test area represents a typical managed forest type in Southern Finland and belongs to Myrtillus type forests (medium-rich mineral soil forest). The study site is a forest stand of about 2 hectares with main tree species of Scots pine (Pinus sylvestris L.). It is a typical representative of a mature Finnish forest ready for harvesting, both in terms of tree age and metrics (DBH and height). The stem density for pines was about 600–800 stems/ha. The mean age and the mean height of the pine trees in the study area were approximately 75 years and 24.8 m, respectively.
2.2 Data collection and processing
The TLS data used in this article was collected with a Leica HDS6100 terrestrial laser scanner (see Table 1 for the scanner specifications). The HDS6100 is a continuous wave phase-based TLS and relies on frequency modulation in distance measurements.
| Table 1. Specifications of Leica HDS6100 terrestrial laser scanner (Leica Geosystems AG). | |
| Wavelength | 650–690 nm |
| Field-of-view | 360° × 310° |
| Max. point spacing | 1.6×1.6 mm at 10 m, 4.0×4.0 mm at 25 m |
| Point spacing in this experiment | 6.3×6.3 mm at 10 m, 15.9×15.9 mm at 25 m |
| Max. acquisition rate | 508 000 points / second |
| Laser beam diameter at exit | 3 mm |
| Laser beam divergence | 0.22 mrad |
| Laser spot size at 25 m | 8 mm |
| Method of distance measurement | Continuous wave, Frequency modulation |
| Precision of distance measurement | 0–25 m: < 3 mm, 25–50 m: < 5 mm |
| Precision of angular measurement | H: 7.9 mgon, V: 7.9 mgon |
200 trees representing the main tree species (scots pine) were selected from the test area, based on their location to minimize the number of TLS scans. The study area was covered with 4 sub-scan networks with 5–15 scans in each network. 45 scans were made to cover the whole study area. As all selected trees were visible from multiple scan directions, each tree was covered by several scans. Georeferencing to the Finnish national grid (EUREF-FIN) and co-registration of the scans was performed using eight spherical targets, whose coordinates in the EUREF-FIN were measured using a Leica SR530 RTK GPS system with 2.3 km baseline. The estimated 3D uncertainty for the spheres was less than 20 cm, the greatest error source being the GPS error, which was estimated to be 10–30 cm (3D). The GPS measurement was not optimal as the dense forest blocked the satellites. The spherical targets where moved from back to forward when they were blocked from the scanner viewpoint. The GPS error did not affect the internal accuracy of the registered scans as the whole sub-scan network was first co-registered and after that the whole network was transformed to the national coordinate system.
The registration and pre-processing of the TLS data were carried out with Z+F LaserControl 8.2 software (Zöller + Fröhlich GmbH). False data points were removed from the clouds with standard filtering tools offered by the Z+F program. These tools include intensity based (intensities < 0.6% and > 100%, corresponding to the noise in the sky and ambiguity noise points, were filtered out) and mixed pixel filtering. The scans with the greatest wind effects (visible as blur in the intensity images) were left out of this study. All in all, the data pre-processing steps were: 1. Scan merging & georeferencing, 2. Noise filtering, 3. Tree isolation (carried out manually).
2.3 Reference measurements
Field measurements of tree height and DBH were carried out for 200 randomly selected trees in the study area. The trees were marked and numbered for tree detection from TLS data. The tree heights were measured with Haglöf Vertex laser rangefinder (Haglöf Sweden AB, Långsele, Sweden). The Vertex uses ultrasound to measure distances. Tree heights were then calculated trigonometrically, using variables from the measurements of inclination and distance (Haglöf Sweden AB, Långsele, Sweden, vertex IV information leaflets).
2.4 Quantitative structure models
The QSM-reconstruction algorithm for retrieving the branch size distributions was developed by Raumonen et al. (2011, 2013). It is a computational method to produce automatically comprehensive and quantitative models of trees from TLS derived point clouds. In the method the TLS point cloud is covered with small sets corresponding to connected surface patches in the tree surface. These sets are the smallest units or building bricks used to segment the point cloud into stem and individual branches. After the segmentation the stem and branches are modelled as collections of cylinders that are fitted into the measurements in the least squares sense. The resulting QSM contains the radii, lengths, orientations, and locations of the cylinders describing the local geometric details of the tree. Also the 3D topological branching structure is contained in the model. From the model we can calculate e.g. the over-the-ground volume, branch size distribution, profiles of single branches and branching angles. The method has been validated against known volume and biomass references in Disney et al. (2012), Raumonen at al. (2013), Calders et al. (2013), and Burt et al. (2013) and the validation has shown that the total volume or biomass can be generally retrieved with errors less than 10%.
3 Results
3.1 Tree height estimation accuracy
Comparison between the reference measurements and the TLS estimated tree heights is presented in Fig. 1. The mean difference between the TLS estimation and the reference was –2.2 m with standard error of 0.25 m. The result was expected, as TLS has a tendency to underestimate the tree height (e.g. Kankare et al. 2013; Liang and Hyyppä 2013; Maas et al. 2008). Large deviations from the Vertex height estimate were observed for some trees (Fig. 1). They were caused by shadowing in the dense canopy, when the scanner was close to the tree.
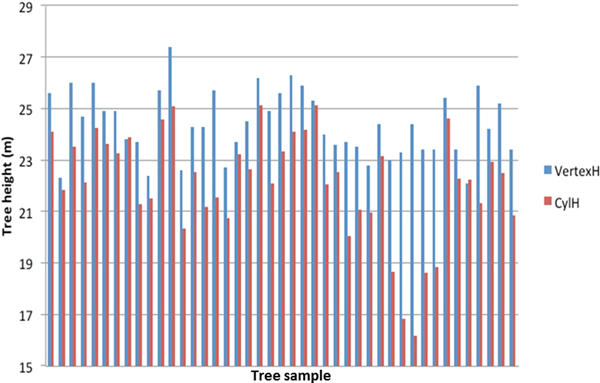
Fig. 1. Tree height estimation with field measurements (VertexH) and TLS derived data (CylH).
3.2 Branch size distribution and tree height
To investigate the connection between tree height (from the Vertex rangefinder) and branch size distribution (from TLS and QSM), the trees were classified into four height classes according to their height: < 20 m, 20–22 m, 22–24 m, and > 24m. As an example of results within a height class, the size distributions of cylinder sections for all trees of 22–24 m height are presented in Fig. 2.
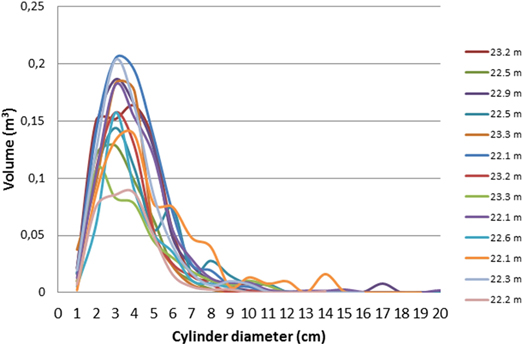
Fig. 2. Cylinder volume distributions (describing the branch volume) for all trees in the tree height class of 22–24 m. The total volume in y-axis refers to the sum volume of all cylinders of the diameter shown in the X-axis.
Fig. 3 presents the average tree height distributions for each class. More details are presented in Table 2. For all tree height classes, branch sections of approximately 3 cm diameter represent the largest volume in the tree canopies. This is in line with previous studies of canopy size distributions (Groot and Schneider 2011). When the volume distributions are normalized with that of the 3 cm diameter cylinder sections (Fig. 3.), we can see that the shape of the distributions is similar, even though there were slight variation between trees in the same class (cf. Fig. 2).
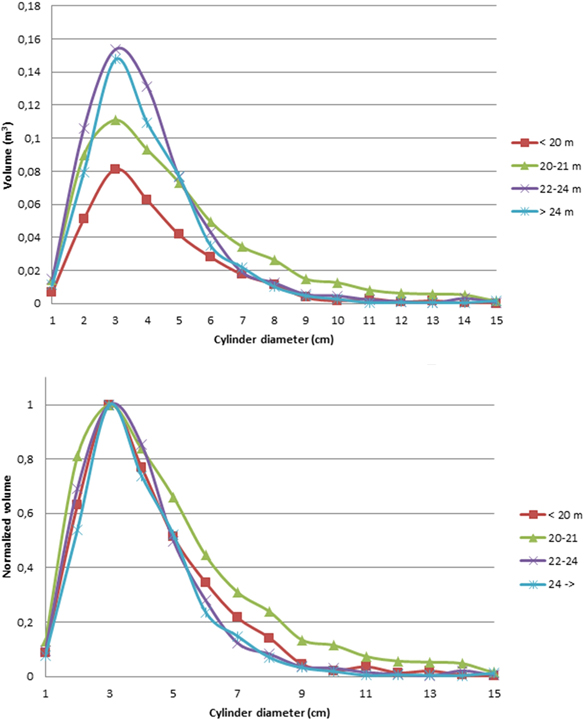
Fig. 3. Top: average cylinder volume distribution functions for all tree height classes. Lower: the cylinder volume distributions for all tree height classes, normalized to 1 at the largest cylinder diameter (3 cm). The normalization enabled us to compare the shapes of the volume distributions.
| Table 2. Detailed statistics of all 4 tree height classes. | ||||
| Tree height (VertexH) | < 20 m | 20–22 m | 22–24 m | > 24 m |
| Number of trees | 5 | 12 | 14 | 10 |
| Mean total branch volume | 0.31 m3 | 0.561 m3 | 0.591 m3 | 0.514 m3 |
| Standard deviation | 0.070 m3 | 0.104 m3 | 0.046 m3 | 0.044 m3 |
| Skew | 1.661 | 1.931 | 2.39 | 1.88 |
| Tree height (TLS) | 16.1–18.9 m | 20.3–21.8 m | 22.1–23.3 m | –25.1 m |
3.3 Accuracy estimation
The accuracy estimation of the method is difficult with full-grown trees, because getting accurate reference data would require destructive sampling (Velázquez-Martí et al. 2012). The largest error sources are:
- Occlusions in the data caused by shadowing (Fig. 4)
- Movement of the trees during the scanning
- Measurement noise and error (cf. Fig. 4)
- Regions with too low point density
- Non-circular branches and stems
- Non-wooden material (i.e. needles, leaves, flowers) causing inaccuracy in the branch size measurement (usually making the cylinders too large)
- Registration errors (i.e., the error in locating the centre points of the spherical reference targets, which was about 1 cm in this study)
- Errors in the modelling process
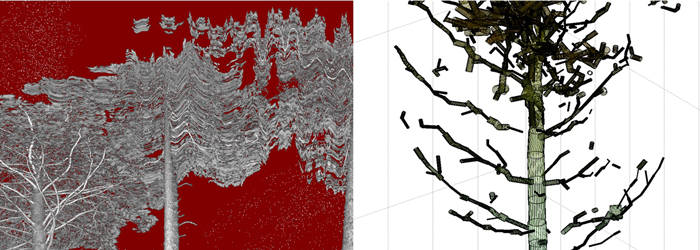
Fig. 4. Left: intensity image shows moving branches during the scan. Right: close-up of a worst-case QSM model reveals gaps and false cylinders in the canopy.
The modelling error of the QSM method has been investigated by Disney et al. (2012) with simulated point clouds. The results point out that volume estimation of the method has a minimum error of 2% all else being equal and that the error depends on the selected cover set size – the smaller cover sets maintain fine details but are also more vulnerable to errors due noise data points. Adding the needles increased the volumes and errors. The combined TLS and QSM method was validated in our previous study with laboratory reference measurements of branch volume and length (Kaasalainen et al. 2014). Overall, we found the method capable of reproducing the results obtained from laboratory reference measurements with about 10% accuracy.
Errors in field measurements contain effects of the instrument and measurement geometry. The phase-based distance measurement causes so-called mixed pixel noise when the laser beam hits multiple targets simultaneously. This is likely in dense tree canopy. Needles in coniferous trees can influence the estimated cylinder diameter. Measurements done in field conditions often suffer from target movement (Fig. 4) during and between the scans. Scanning a single tree from three separate scanning directions (as in this study) can lead to modelling the same branch section up to three times if the canopy has moved even a few cm between the scans.
Some worst-case effects of the different error sources are visible in Fig. 4, where gaps, false cylinders and overestimation of cylinder diameter for the tips of the branches in the final structure model are visible. Minimizing the errors requires careful planning of the measurement geometry (i.e., the scanner position) and an even distribution of target spheres in the study area. Data with clear movement of the tree and branches should be excluded (so the effect of wind is essential). The use of a time-of-flight scanner would mitigate the mixed pixel noise in the canopy and would make the results less dependent on the noise reduction in the pre-processing step.
4 Discussion
The main result of our study is that trees growing in similar conditions (a forest stand in medium-rich mineral soil forest) have similar branch size distributions. This agrees with the assumption common in vegetation models, and the QSM model has enabled it to be tested to a large number of trees. In most pines in our sample plot, the branch diameters have been distributed similarly. The result could be expected, since the growing conditions are known to affect the branching. The results also suggest that the volume and distribution of branch sizes can be predicted for trees of different height in similar growing conditions and used in tree growth models (e.g., Sievänen et al. 2000), but this must be further studied with extensive measurement from different sample plots. To include taller trees (> 30 m) in the further study, a crane or unoccupied aerial vehicle (UAV) -based laser scanning approach would be crucial for successful modelling. The TLS-QSM approach has been validated in other test sites and found to be able to reproduce accurately the total volume and biomass (Burt et al. 2013; Calders et al. 2013).
The test area represents a typical managed forest type in Southern Finland (Finnish Forest Research Institute 2010, p. 73): the sample stand is a typical representative of a mature Finnish forest ready for harvesting. As managed forests are a considerable source of harvest residue used in bioenergy production, it is important to be able to estimate the carbon dioxide (CO2) output from using the residue as biofuel to that produced in the decaying process. This requires an accurate estimation branch (or root) size distribution (Liski et al. 2014).
The data collection methods can be further improved. Needles can be detected and classified using laser scanner intensity or spectral information from active hyperspectral lidar, to separate branches and needles by their spectral indices (cf. Hakala et al. 2012; Vauhkonen et al. 2013). Data acquisition could be sped up by use of mobile laser scanning or an UAV based approach.
Our results are the first ones to study the extension of an accurate tree model to plot level based on the measurements entirely, since thus far the modeling has mostly been based on extrapolating the smallest branches from larger ones (see, e.g., Côté et al. 2012). The results also suggest that tree height could be used to estimate the branch size distribution in larger areas with similar growing conditions and topography. This would enable more efficient remote detection of tree structure in large areas, which would then improve the study of the forest ecosystem and functions and the estimations the carbon content. More measurements and modelling are needed to improve the statistics and extend the results into larger areas, different tree types, growth conditions, etc.
Acknowledgements
The authors want to thank Risto Viitala at HAMK for providing the test site. This study was financially supported by the Academy of Finland projects: ‘Modelling and applications of stochastic and regular surfaces in inverse problems’ and ‘New techniques in active remote sensing: hyperspectral laser in environmental change detection’, ‘Finnish Centre of Excellence in Inverse Problems Research’, ‘Centre of Excellence in Laser Scanning Research’ (CoE-LaSR) and ‘Science and Technology Towards Precision Forestry’ (PreciseFor).
References
Aschoff T., Thies M., Spiecker H. (2004). Describing forest stands using terrestrial laser-scanning. The International Archives of the Photogrammetry, Remote Sensing and Spatial Information Sciences 35: 237–241.
Baskerville G.L. (1972). Use of logarithmic regression in the estimation of plant biomass. Canadian Journal of Forest Research 2: 49–53. http://dx.doi.org/10.1139/x72-009.
Bucksch A., Fleck S. (2011). Automated detection of branch dimensions in woody skeletons of fruit tree canopies. Photogrammetric Engineering and Remote Sensing 77: 229–240.
Burt A., Disney M., Raumonen P., Armston J., Calders K., Lewis P. (2013). Rapid characterisation of forest structure from TLS and 3D modelling. Proc. of IGARSS 2013, Melbourne, Australia, 21–26 Jul. 2013. 4 p.
Calders K., Newnham G., Herold M., Murphy S., Culvenor D., Raumonen P., Burt A., Armston J., Avitabile V., Disney M. (2013). Estimating above ground biomass from terrestrial laser scanning in Australian Eucalypt Open Forest. Proc. of Silvilaser 2013, Beijing, China, 9–11 Oct. 2013. 7 p.
Chasmer L., Hopkinson C., Treitz P. (2006). Investigating laser pulse penetration through a conifer canopy by integrating airborne and terrestrial lidar. Canadian Journal of Remote Sensing 32: 116–125. http://dx.doi.org/10.5589/m06-011.
Côté J.-F., Widlowski J.-L., Fournier R.A., Verstraete M.M. (2009). The structural and radiative consistency of three-dimensional tree reconstructions from terrestrial lidar. Remote Sensing of Environment 113: 1067–1081. http://dx.doi.org/10.1016/j.rse.2009.01.017.
Disney M., Lewis P., Raumonen P. (2012). Testing a new vegetation structure retrieval algorithm from terrestrial lidar scanner data using 3D models. Silvilaser 2012, Sept 16–19 2012. Vancouver, Canada.
Eysn L., Pfeifer N., Ressl C., Hollaus M., Grafl A., Morsdorf F. (2013). Practical approach for extracting tree models in forest environments based on equirectangular projections of terrestrial laser scans. Remote Sensing 5: 5424–5448. http://dx.doi.org/10.3390/rs5115424.
Dassot M., Constant T., Fournier M. (2011). The use of terrestrial LiDAR technology in forest science: application fields, benefits and challenges, Annals of Forest Science 68: 959–974. http://dx.doi.org/10.1007/s13595-011-0102-2.
Dassot M., Colin A., Santenoise P., Fournier M., Constant T. (2012). Terrestrial laser scanning for measuring the solid wood volume, including branches, of adult standing trees in the forest environment. Computers and Electronics in Agriculture 89: 86–93. http://dx.doi.org/10.1016/j.compag.2012.08.005.
Finnish Forest Research Institute. (2010). Finnish Statistical Yearbook of Forestry 2010. http://www.metla.fi/metinfo/tilasto/julkaisut/vsk/2010/vsk10_01.pdf.
Groot A., Schneider R. (2011). Predicting maximum branch diameter from crown dimensions, stand characteristics and tree species. The Forestry Chronicle 87: 542–551. http://dx.doi.org/10.5558/tfc2011-053.
Haglöf Sweden. Vertex IV information leaflets. Haglöf Sweden AB, Långsele, Sweden. http://www.haglofcg.com/index.php?option=com_content&view=article&id=101&Itemid=122.
Hakala T., Suomalainen J., Kaasalainen S., Chen Y. (2012). Full waveform hyperspectral LiDAR for terrestrial laser scanning. Optics Express 20: 7119–7127. http://dx.doi.org/10.1364/OE.20.007119.
Hopkinson C., Chasmer L., Young-Pow C., Treitz P. (2004). Assessing forest metrics with a ground-based scanning lidar. Canadian Journal of Forest Research 34: 573–583. http://dx.doi.org/10.1139/x03-225.
Hyyppä J., Yu X., Hyyppä H., Vastaranta M., Holopainen M., Kukko A., Kaartinen H., Jaakkola A., Vaaja M., Koskinen J., Alho P. (2012). Advances in forest inventory using airborne laser scanning. Remote Sensing 4: 1190–1207. http://dx.doi.org/10.3390/rs4051190.
Kaasalainen S., Krooks A., Liski J., Raumonen P., Kaartinen H., Kaasalainen M., Puttonen E., Anttila K., Mäkipää R. (2014). Change detection of tree biomass with terrestrial laser scanning and quantitative structure modelling. Remote Sensing 6: 3906–3922. http://dx.doi.org/10.3390/rs6053906.
Kankare V., Holopainen M., Vastaranta M., Puttonen E., Yu X., Hyyppä J., Vaaja M., Hyyppä H., Alho P. 2013. Individual tree biomass estimation using terrestrial laser scanning. ISPRS Journal of Photogrammetry and Remote Sensing 75: 64–75. http://dx.doi.org/10.1016/j.isprsjprs.2012.10.003.
Liang X., Hyyppä J. (2013). Automatic stem mapping by merging several terrestrial laser scans at the feature and decision levels. Sensors 13: 1614–1634. http://dx.doi.org/10.3390/s130201614.
Liang X., Kankare V., Yu X., Hyyppä J., Holopainen M. (2014). Automated stem curve measurement using terrestrial laser scanning. IEEE Transactions on Geoscience and Remote Sensing 52: 1739–1748. http://dx.doi.org/10.1109/TGRS.2013.2253783.
Liski J., Kaasalainen S., Raumonen P., Akujärvi A., Krooks A., Repo A., Kaasalainen M. (2014). Indirect emissions of forest bioenergy: detailed modeling of stump-root systems. Global Change Biology Bioenergy. [In press]. http://dx.doi.org/10.1111/gcbb.12091.
Maas H.G., Bienert A., Scheller S., Keane E. (2008). Automatic forest inventory parameter determination from terrestrial laser scanner data. International Journal of Remote Sensing 29: 1579–93.
Morsdorf F., Meier E., Kötz B., Itten K.I., Dobbertin M., Allgöwer B. (2004). LIDAR-based geometric reconstruction of boreal type forest stands at single tree level for forest and wildland fire management. Remote Sensing of Environment 92: 353–362. http://dx.doi.org/10.1016/j.rse.2004.05.013.
Raumonen P., Kaasalainen S., Kaasalainen M., Kaartinen H. (2011). Approximation of volume and branch size distribution of trees from laser scanner data. International Archives of Photogrammetry, Remote Sensing and Spatial Information Sciences 38: 79–84.
Raumonen P., Kaasalainen M., Åkerblom M., Kaasalainen S., Kaartinen H., Vastaranta M., Holopainen M., Disney M., Lewis P. (2013). Fast automatic precision tree models from terrestrial laser scanner data. Remote Sensing 5: 491–520. http://dx.doi.org/10.3390/rs5020491.
Schumacher F.X., Hall F. (1933). Logarithmic expression of timber-tree volume. Journal of Agricultural Research 47: 719–734.
Sexton J.O., Bax T., Siqueira P., Swenson J., Hensley S. (2009). A comparison of lidar, radar, and field measurements of canopy height in pine and hardwood forests of southeastern North America. Forest Ecology and Management 257: 1136–1147. http://dx.doi.org/10.1016/j.foreco.2008.11.022.
Sievänen R. Nikinmaa E., Nygren P., Ozier-Lafontainec H., Perttunen J., Hakula H. (2000). Components of functional-structural tree models. Annals of Forest Science 57: 399–412. http://dx.doi.org/10.1051/forest:2000131.
Vauhkonen J. (2010). Estimating single-tree attributes by airborne laser scanning: methods based on computational geometry of the 3-D point data. Dissertationes Forestales 104. 44 p. http://www.metla.fi/dissertationes/df104.htm.
Vauhkonen J., Hakala T., Suomalainen J., Kaasalainen S., Nevalainen O., Vastaranta M., Holopainen M., Hyyppä J. (2013). Classification of spruce and pine trees using active hyperspectral LiDAR. IEEE Geoscience and Remote Sensing Letters 10: 1138–1141. http://dx.doi.org/10.1109/LGRS.2012.2232278.
Velázquez-Martí B., Estornell J., López-Cortés I., Martí-Gavilá J. (2012). Calculation of biomass volume of citrus trees from an adapted dendrometry. Biosystems Engineering 112: 285–292. http://dx.doi.org/10.1016/j.biosystemseng.2012.04.011.
Vonderach C., Voegtle T., Adler P. (2012). Voxel-based approach for estimating urban tree volume from terrestrial laser scanning data. International Archives of Photogrammetry, Remote Sensing and Spatial Information Sciences 39: 451–456.
Wang C., Glenn N. (2008). A linear regression method for tree canopy height estimation using airborne lidar data. Canadian Journal of Remote Sensing 34: S217–S227. http://dx.doi.org/10.5589/m08-043.
Zianis D., Muukkonen P., Mäkipää R., Mencuccini M. (2005). Biomass and stem volume equations for tree species in Europe. Silva Fennica Monographs 4. 63 p.
Total of 35 references
