Jaakko Repola  ,
Kristina Ahnlund Ulvcrona
,
Kristina Ahnlund Ulvcrona
Modelling biomass of young and dense Scots pine (Pinus sylvestris L.) dominated mixed forests in northern Sweden
Repola J., Ahnlund Ulvcrona K. (2014). Modelling biomass of young and dense Scots pine (Pinus sylvestris L.) dominated mixed forests in northern Sweden. Silva Fennica vol. 48 no. 5 article id 1190. https://doi.org/10.14214/sf.1190
Highlights
- The biomass allocation to tree components is different in unmanaged and managed young stands
- Higher foliage biomass and lower stem and branch biomass were detected in the unmanaged stands
- Models for trees from young and dense stands provide better estimates of biomass in such stands than those based on data from managed stands.
Abstract
Biomass models for the biomass of above-ground tree components of Scots pine (Pinus sylvestris L.), Norway spruce (Picea abies [L.] Karst.) and birch (Betula pendula Roth and Betula pubescens Ehrh.) in young dense Scots pine dominated forest stands in northern Sweden were constructed. Destructive above-ground biomass sampling was conducted in naturally generated young, dense, Scots pine dominated mixed stands. Three sampling campaigns were undertaken, the first in 1997 and 1998. The second was six years later (2003), and the last 13 years after the first (2010). In total, 280 trees (126 Scots pine, 68 Norway spruce and 86 birches) were sampled from six different stands in northern Sweden. The sampled trees’ diameter at breast height (dbh) was in the range 1–22 cm (Scots pine), 1–21 cm (Norway spruce) and 1–11 cm (birch). Biomass predictions were tested using our models and the widely used biomass models originally constructed for managed stands. The results showed that the biomass allocation to tree components is different in unmanaged and managed young stands; higher foliage biomass and lower stem and branch biomass were detected in the unmanaged stands. The overall conclusion is that the biomass models for managed stands did not produce satisfactory biomass estimates in unthinned, dense, young stands.
Keywords
boreal forests;
pine;
tree biomass;
biomass models;
unmanaged stands
-
Repola,
Finnish Forest Research Institute, Rovaniemi Research Unit, P.O. Box 16, FI-96301 Rovaniemi, Finland
E-mail
jaakko.repola@metla.fi
- Ahnlund Ulvcrona, SLU, Forest Biomaterials and Technology, Skogsmarksgränd, SE-901 83 Umeå, Sweden E-mail kristina.ulvcrona@slu.se
Received 12 May 2014 Accepted 29 October 2014 Published 12 December 2014
Views 147061
Available at https://doi.org/10.14214/sf.1190 | Download PDF

1 Introduction
Forest bio-fuels are a renewable energy source that should be able to meet the future demand for the change of energy sources (Hoogwijk et al. 2003; Jylhä and Laitila 2007; Polagye et al. 2007). Increased interest in bioenergy has, in turn, increased the demand for biofuels sourced from forests (Polagye et al. 2007), not least from young and dense forests (Polagye et al. 2007; Stupak et al. 2008; Bergström 2009). With energy wood becoming a third marketable forest product alongside timber and pulpwood, there has arisen a need for estimating tree and stand biomasses. Biomass estimates are also needed for many other purposes e.g., when calculating carbon budgets and ecosystem productivities for forest stands (Monserud et al. 2006; Litton et al. 2007; Case and Hall 2008).
There is considerable focus on using small stems, especially from late pre-commercial or early thinnings, as well as branches and tops, for the production of bioenergy (Stupak et al. 2008; Bergström 2009; Bergström et al. 2010). The harvesting of small diameter trees from young and dense stands has increased in recent years, and they have played an increasingly important role in forest chips production in Sweden (Statistical Yearbook of Forestry 2014). However, if biofuels are to be used to meet some of the expected energy demands of the future, it will be necessary to develop new silvicultural regimes and techniques to ensure the efficient production and harvesting of suitable biomass (Guo 2010). In general, high stand densities result in high biomass production (Satoo and Madgwick 1982; Pettersson 1993), making young dense stands a rich source of materials for the production of forest biofuels (Eriksson and Nordén 1999; Claesson et al. 2001). The amounts of foliage in these young and dense stands are about 15 % (Ulvcrona 2011). Nitrogen is in general the growth limiting nutrient in the boreal and northern temperate forests (Tamm 1991), and therefore the question about growth reduction after whole tree harvest (WTH) should be considered. There are studies with no significant growth reduction after WTH (Mård 1998; Kukkola and Mälkönen 1994; Tveite and Hanssen 2013). But there are also other studies in thinning experiments with less productivity in WTH plots compared to control plots (Egnell and Leijon 1997).
Good decisions regarding the potential profitability of harvesting fuels for the production of bioenergy from the young dense stands can only be made on the basis of reliable information about the stand total biomass and biomass by tree components rather than from the standing stem volume alone. For assessing, for example, the energy-wood availability from a young stand or the most efficient harvesting chain, biomass estimates of the individual tree components – such as the whole stem, the unmerchantable part of a stem, branches and foliage – are needed. This requires the information about the tree allometry; the allocation of growth and biomass in young forests with high stand densities. Many studies have shown that high stand density has an effect on the tree dimensions (stem and crown) and growth (Hynynen 1995a, 1995b, Hökkä 1997). But, only few studies of that effect on biomass allocation to the tree components were published (Naidu et al. 1998; Claesson et al. 2001).
Tree biomass is generally expressed as dry mass (DW), which is the most appropriate measure for the determination of forest carbon sinks and energy content because around fifty percent of the dry mass is made up of carbon, and because there is a rather strong correlation between dry mass and energy content. Because direct measurement of tree biomass is laborious, estimates of the tree components (stem, stem bark, branches, foliage, stump and roots) are commonly obtained using allometric regression models. Such biomass models predict biomass as a function of easily measurable tree dimensions such as diameter and height.
There have been published many biomass equations for various tree species, as well as biomass equations for both whole trees and for different tree components, including above- and below-ground tree components (Marklund 1987; 1988; Claesson et al. 2001; Lambert et al. 2005; Muukkonen and Mäkipää 2006; Repola 2008; 2009). In Sweden, the equations that are most widely used for stands managed according to standard silvicultural practices are the biomass functions developed by Marklund (1987; 1988). In Finland, Repola’s (2008, 2009) biomass models have been widely applied for estimating tree and stand biomasses. Both Marklund’s (1988) and Repola’s (2008, 2009) models were based on a large amount of material and they can be applied over a wide range of stand and site conditions, from young to mature stands. Despite this, these biomass models are primarily applicable to trees growing in stands managed using standard approaches. Thus, the validity of these models for the trees growing in dense stands is uncertain, and this can restrict their application both in the scientific and practical purposes.
It has been shown that intensive between-tree competition has an impact on biomass allocation to tree components (Van Lear et al. 1984; Naidu et al. 1998; Nilsson and Albrektson 1994). Although biomass allocation would be different in managed and unmanaged stands, it doesn’t automatically mean that biomass models for managed stands are not applicable to unmanaged stands. The applicability of these models depends on how efficiently between-tree competition has been depicted in a model. The commonly used biomass models are mostly based on tree diameter and height, and variables, which relate directly to between-tree competition, have commonly not used as independent variables. However, stem dimensions illustrate also between-tree competition. Diameter-height ratio (stem form) captures effectively the competition status of the tree, which in turn has a strong effect on tree biomasses, especially on biomass of crown components (Repola 2013). If this effect on tree biomasses is similar in managed and unmanaged stands, biomass models for managed stands based on tree diameter and height are obviously suitable also for unmanaged stands with more intensive between-tree competition. Due to the different range of height-diameter ratio in managed and unmanaged stand, the application of the models for managed stands may be extrapolation, which produces unreliable predictions in the unmanaged stands.
Claesson et al. (2001) developed biomass equations for young trees with a diameter at breast height (dbh) of 5–10 cm in Scots pine dominated mixed stands with high stand densities (>6500 stems ha–1). They showed that equations based on biomass material from forests with lower stand densities (Marklund 1988), e.g. stands that had previously been subjected to pre-commercial thinning, overestimated the biomass of stem wood for Scots pine (Pinus sylvestris L.) and Norway spruce (Picea abies (L. Karst.) growing in dense stands. Marklund’s (1988) models tended also to produce overestimates of branch biomass and underestimates of foliage biomass for Scots pine, Norway spruce, downy birch (Betula pubescens Ehrh.), and silver birch (Betula pendula Roth). In Finland, no biomass models for the dense young stands have been developed, and the validity of Repola’s (2008, 2009) models for trees growing in dense stands has not been tested, thus biomass estimates for unthinned stands may be unreliable. Marklund’s (1988) and Repola’s (2009, 2008) models are reliable for stands of the type for which they were developed, so there is a need to test these biomass models. They may need to be modified by means of a correction factor, or complementary biomass equations may be required to estimate the biomass of dense stands that have not been managed using standard silvicultural practices that include pre-commercial thinning.
The aim of this study was: i) to develop individual-tree biomass models for above-ground tree components of Scots pine, Norway spruce, and birch growing in dense stands (>11 000 stems ha–1); and ii) to test the applicability of Marklund’s (1988) and Repola’s (2008, 2009) models to young dense stands by comparing these models with the models developed in this study. In our study, the sample trees were obtained from six dense young stands in northern Sweden on three different occasions to provide a dataset spanning a wide range of tree diameters.
2 Material and methods
2.1 Site and stand descriptions
Biomass sampling was conducted in six stands at different sites in northern Sweden (Fig. 1). The latitudes ranged from 63.26 °N to 65.69 °N, altitudes ranged from 20 to 220 m a.s.l., and the site indices for Scots pine as defined by Hägglund and Lundmark (1977), i.e. the dominant height at 100 years of age, ranged from 18 to 24 m. The mean annual precipitation at the sites ranged from 600 to 800 mm (Annual precipitation 2014), compared to 700–800 mm for the climatic reference period (1961–1990) for the actual sites (SMHI 2014). The sum of the sites’ daily mean temperatures during the growing season ranged from 900 to 1100 °C at all sites (Temperature sum 2014), and the length of the growing seasons ranged from 120 to 180 days (Growing season length 2014). All of the stands were part of young naturally-regenerated forests growing on mineral soils (Table 1). On the basis of the basal area the stands were dominated by Scots pine (59–99%) with varying mixtures of deciduous species (1–39%) and Norway spruce (2–13%). Birch was the most common deciduous species in the stands, but willow (Salix spp.), alder (Alnus incana), aspen (Populus tremula) and mountain ash (Sorbus aucuparia) were also present.
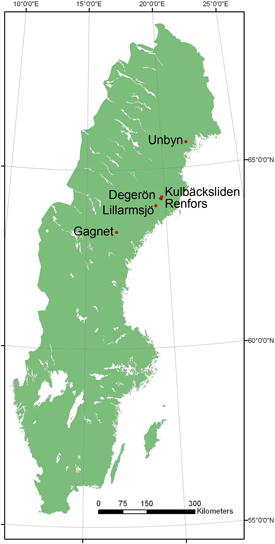
Fig. 1. Map of all sites where biomass sampling was undertaken.
| Table 1. Characteristics of the studied stands. | ||||||
| Variable | Renfors | Degerön | Kulbäcksliden | Gagnet | Lillarmsjö | Unbyn |
| Altitude (m a.s.l.) | 190 | 175 | 170 | 125 | 220 | 20 |
| H100 (m) a) | 18 | 20 | 20 | 24 | 21 | 19 |
| Latitude (ºN) b) | 64.21 | 6415 | 64.17 | 63.26 | 63.97 | 65.69 |
| Longitude (ºE) b) | 19.70 | 19.67 | 19.62 | 16.79 | 19.30 | 21.58 |
| Soil c) | Loamy sand | Sandy loam | Loamy sand | Sandy loam | Sandy loam | Silt loam |
| Mean annual precipitation (mm) d) | 700–800 | 700–800 | 700–800 | 700–800 | 700–800 | 600–700 |
| Growing season length (days) e) | 120–150 | 120–150 | 120–150 | 150–180 | 150–180 | 150–180 |
| a) H100 site index (dominant height at 100 yrs of age) for Pinus sylvestris L. according to definitions by Hägglund and Lundmark (1977). b) Latitude and Longitude are given in degrees and decimals of degrees (WGS84). c) Soil textural classes are specified according to the definitions of Hägglund and Lundmark (1987). d) Annual precipitation mean values from the meteorological period 1961–1990 (2014). e) Defined as the number of days for which the daily mean temperature was > 5 °C mean values from the meteorological period 1961–1990. (Growing season length 2014). | ||||||
2.2 Experimental design for the field experiment
The study material consisted of two data sub-sets from temporary sample plots (Lillarmsjö, Unbyn) and factorial field experiments. Four of the sites (Renfors, Degerön, Kulbäcksliden and Gagnet) (Fig. 1) were part of a factorial field experiment that had been established in 1997 (Renfors, Degerön, Kulbäcksliden) and 1998 (Gagnet) after the first biomass sampling campaign. Each site was considered to represent a block and the factorial experiments consisted of five different combinations of pre-commercial thinning (thinning to 3000 stems ha–1 and a control with no thinning) and fertilization treatments. Only unthinned and unfertilized, control plots (C) were used in the current study.
Net plots with areas of 900 m2 and dimensions of 45 m × 20 m or 30 m × 30 m, depending on stand characteristics, were established at each site. A 5 m buffer zone was established around each plot, in which the trees were subjected to the same treatment (stand density and fertilization treatment according to the descriptions above) as those within the net plot. At the Degerön and Kulbäcksliden sites, a fence was set up to protect against moose, which were more numerous at these sites than at Renfors and Gagnet.
2.3 Stand measurement
The stands were measured in 1997 and 1998 when the field experiment was established, and again in 2002 and 2010 (Table 2). For sites not included in the field experiment (Lillarmsjö and Unbyn), and for the sampling campaign conducted in spring 2010 (Kulbäcksliden and Degerön), all trees (h > 1.3 m) within a number of circular plots (100 m2) were measured. At Renfors, Degerön, Kulbäcksliden and Gagnet, measurements were conducted on all trees (h > 1.3 m) within each plot. The heights of a number of trees in every plot (40–80 from the experimental plots, 10–20 from the circular plots) were measured in order to include all diameter classes (2 cm interval classes) from each species (Scots pine, Norway spruce and birch). For those trees whose height was not measured, height was predicted using Näslund (1936) height curves:

where h is height (m), x is dbh (cm) and k is a constant that takes a value of 2 for Scots pine (Näslund 1936) and birch (Fries 1964), and 3 for Norway spruce (Petterson 1955). The parameters “a” and “b” were estimated by linear regression for each plot.
| Table 2. Arithmetic mean diameter at breast height (dbh), dominant height (defined as the mean height of the 100 largest trees per hectare), basal area, and number of stems for the different sites considered in this work, for trees > 1.3 m in height. | |||||||
| Variable | Year | Renfors | Degerön | Kulbäcksliden | Gagnet | Lillarmsjö | Unbyn |
| dbh (mm) | 1997–1998 | 24 | 16 | 26 | 38 | 38 | 33 |
| 2002 | 29 | 20 | 27 | ||||
| 2010 | 42 | 61 | |||||
| Dominant height (m) | 1997–1998 | 5.2 | 4.2 | 5.1 | 6.0 | 7.1 | 7.2 |
| 2002 | 9.7 | 6.0 | 9.3 | ||||
| 2010 | 10.0 | 12.7 | |||||
| Basal area m2 ha–1 | 1997–1998 | 10.0 | 7.0 | 11.4 | 21.1 | 21.2 | 23.9 |
| 2002 | 20.3 | 18.0 | 20.3 | ||||
| 2010 | 32.0 | 26.7 | |||||
| No. of stems ha–1 | 1997–1998 | 13 500 | 24 900 | 13 800 | 18 330 | 12 140 | 20 375 |
| 2002 | 17 400 | 34 000 | 18 300 | ||||
| 2010 | 14 460 | 4060 | |||||
2.4 Sampling procedure
The trees selected for biomass sampling were chosen with the aim of including trees of all sizes, but damaged trees were excluded. In total, 280 trees were included in this destructive aboveground biomass study, of which 126 were pine, 68 spruce and 86 birch. The sample tree material was biased towards the smaller diameter classes, trees with dbh < 10 cm (Table 3). The number of sample trees from each site is given in Table 4. The range of dbh was 1–22 cm, 1–21 cm and 1–11 cm for pine, spruce and birch, respectively (Table 3). The range of heights was 1.7–11.7 m, 1.6–13.3 m and 1.8–8.6 m for pine, spruce and birch, respectively (Table 3).
| Table 3. Number of sample trees per dbh a) class and height class for each species. | ||||||||||||
| Height (m) | dbh (cm) | N Total | ||||||||||
| 0–2 | 2–4 | 4–6 | 6–8 | 8–10 | 10–12 | 12–14 | 14–16 | 16–18 | 18–20 | 20–22 | ||
| Scots pine | ||||||||||||
| 1.3–3 | 11 | 18 | 29 | |||||||||
| 3–5 | 15 | 20 | 2 | 37 | ||||||||
| 5–7 | 3 | 9 | 13 | 7 | 32 | |||||||
| 7–9 | 2 | 11 | 3 | 2 | 18 | |||||||
| 9–11 | 2 | 2 | 2 | 8 | ||||||||
| 11–13 | 1 | 1 | 1 | 1 | 2 | |||||||
| Total | 11 | 36 | 29 | 17 | 18 | 5 | 4 | 3 | 1 | 1 | 1 | 126 |
| Norway spruce | ||||||||||||
| 1.3–3 | 7 | 8 | 15 | |||||||||
| 3–5 | 8 | 12 | 1 | 21 | ||||||||
| 5–7 | 7 | 11 | 2 | 20 | ||||||||
| 7–9 | 5 | 1 | 6 | |||||||||
| 9–11 | 2 | 1 | 3 | |||||||||
| 11–13 | 1 | 1 | 2 | |||||||||
| 13–15 | 1 | 1 | ||||||||||
| Total | 7 | 16 | 19 | 12 | 7 | 3 | 1 | 1 | 1 | 0 | 1 | 68 |
| Birch | ||||||||||||
| 1.3–3 | 11 | 2 | 13 | |||||||||
| 3–5 | 2 | 24 | 2 | 28 | ||||||||
| 5–7 | 1 | 4 | 12 | 6 | 23 | |||||||
| 7–9 | 4 | 9 | 7 | 20 | ||||||||
| 9–11 | 1 | 1 | 2 | |||||||||
| 11–13 | ||||||||||||
| 13–15 | ||||||||||||
| Total | 14 | 30 | 18 | 15 | 8 | 1 | 86 | |||||
| a) dbh, diameter at breast height | ||||||||||||
| Table 4. Number of sampled trees for each site per year and species. | ||||
| Site | Year | Scots pine | Norway spruce | Birch |
| Degerön | 1997 | 20 | 6 | 15 |
| Renfors | 1997 | 18 | 6 | 12 |
| Kulbäcksliden | 1997 | 18 | 12 | |
| Lillarmsjö | 1998 | 13 | 11 | 13 |
| Gagnet | 1998 | 8 | 8 | 8 |
| Unbyn | 1998 | 8 | 10 | 6 |
| Degerön | 2003 | 9 | 6 | 6 |
| Renfors | 2003 | 10 | 6 | 8 |
| Kulbäcksliden | 2003 | 11 | 6 | 6 |
| Degerön | 2010 | 5 | 3 | |
| Kulbäcksliden | 2010 | 6 | 6 | |
| Total | 126 | 68 | 86 | |
Sampling was conducted on three occasions: in 1997/1998, 2003 and 2010. The sampling campaigns in 2003 and 2010 used mainly the same protocols as in 1997/1998 (Claesson et al. 2001). The first samples were collected in June 1997 (Renfors, Degerön, Kulbäcksliden), and in August 1998 (Gagnet, Lillarmsjö, Unbyn), and consisted of a total of 192 trees of pine, spruce, birch with dbh < 10 cm, (Tables 3–4) (Claesson et al. 2001). Since some of the samples were collected before the birch leaves had developed, the foliage fraction from birches sampled in Renfors, Degerön and Kulbäcksliden (1997) was excluded from the dataset. The second sampling campaign was conducted in 2003 from three of the six stands (Degerön, Renfors and Kulbäcksliden), before (in May/June) or after (in August/September) the growing season. In 2003, birches were sampled only in August and September after the leaves had developed but had not yet begun to fall. The second samples consisted of a total of 68 trees with dbh in the range 1.6–13.6 cm, 1.1–12.1 cm, and 0.9–11.3 cm for the pine, spruce and birch, respectively (Tables 3–4). The third sampling campaign was conducted in 2010 in Degerön and Kulbäcksliden before the start of the growing period (in May). The sample consisted of 20 trees with dbh in the range 6.7–21.8 cm and 4.8–21.0 cm for Scots pine and Norway spruce (Tables 3–4). Birches were not sampled because the leaves had not developed at that point. When the trees were sampled in 2010, the sampling was conducted outside the actual experimental plot, but in the same stands as had previously been sampled because the trees in the experimental plot had been subjected to early thinning in a field experiment in 2009. The sampled stand was considered to be similar to the previously unthinned experimental stand. These circular plots were outside the fence surrounding the experimental plot and thus contained a few sprouts of birch, mountain ash, aspen and willow due to moose browsing. Because of this, the total number of stems within these plots was lower than those for the same sites in previous sampling campaigns. Some of the largest trees sampled were outside the measured circular plots, but still in the same stand. As a result, the arithmetic mean diameters measured for the circular plots in 2010 were relatively low (Table 2).
2.5 Sample tree measurements
Before felling, the stem diameter at a height of 130 cm (dbh) was marked and measured over bark by cross callipering (1 mm accuracy). The position of the dbh measurement was marked on the north side of the tree to ensure that all trees were measured in the same direction. Each sample tree was cut down as close to the ground as possible, at a stump height of approximately <4 cm. After felling, a measuring tape was attached to the end of the stem and the tree height was measured (1 cm accuracy).
The biomass sampling of the different tree components in the latter two campaigns (2003, 2010) was based mainly on the same protocols that were used in 1997/1998 (Claesson et al. 2001), except that the tree crown was divided into three sections in 1997/1998 and four sections thereafter (Fig. 2). One branch was selected from each section of the crown for dry mass determination; in each case, the sampled branch was subjectively judged to be representative of all branches from that section of the crown. Moreover, in 2003 and 2010 the stem circle was also divided into four (imaginary) quadrants, with the northern face of the trunk lying in the uppermost part of the circle. One branch was then collected from each quadrant of the crown: the first was taken from the first quadrant of the lowest section, the second from the second quadrant of the second section, and so on. Each sampled branch, and all branches from the living crown, was weighed to determine its fresh mass (1 g accuracy). In addition, a representative dead branch was selected from below the living crown to determine the biomass i.e., dry mass, of dead branches. All branches were cut using pruning shears; living and dead branches were weighed separately.
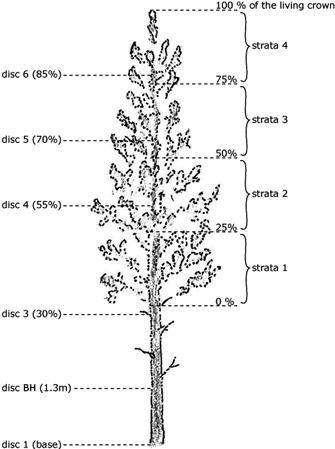
Fig. 2. Biomass sampling tree showing the positions of discs and strata.
Discs were taken from the butt end of the stem, at a height of 130 cm (breast height, BH) and at four other heights. Specifically, discs were taken from positions at 30%, 55%, 70% and 85% of the stem height (Fig. 2) in order to estimate the stem biomass (DW). The diameter of the disc was cross-callipered over the bark using a calliper and all discs were cut to a thickness of 5 cm. For the smallest trees, the BH disc overlapped with the 30% disc so, only five discs were cut from these trees.
The discs and the sample branches (alive and dead) were weighed in the field on a laboratory balance (6 kg maximum ± 0.0005 kg). The stem sections and all other branches were weighed on a scale (30 kg maximum ± 0.002 kg). The four branches, a sample of dead branches from below the living crown, and the six discs were put in separate airtight bags and placed in a freezer (–20 °C) within 8 hours until the time of dry mass determination. The bark was separated from the disc and weighed before drying and all samples were dried in a ventilated oven (85 °C for 48 hours). The discs were then dried and weighed on a laboratory balance (6 kg maximum ± 0.0005 kg) until no further change in mass was recorded. Foliage was separated from the branches after 24 hours, and then dried for another 24 hours before being weighed on a laboratory balance (6 kg maximum ± 0.0005 kg).
The biomass of the sample trees was estimated by individual tree components; stem (including bark), foliage, living and dead branches. The biomass estimates were based on the ratio estimator (r) i.e., the ratio of the dry mass (dw) and fresh mass (fw) of the samples of tree components. This ratio (dw/fw) was used to convert fresh mass of the entire tree component (FW) to biomass (DW). Stem biomass was estimated as follows;
![]()
where DWs is stem biomass, FWs is the fresh mass of the stem, ![]() is the mean ratio estimator of a stem. The mean ratio estimator
is the mean ratio estimator of a stem. The mean ratio estimator ![]() was obtained as a weighted mean of r. Dry mass (dw) of the disc was used as a weight.
was obtained as a weighted mean of r. Dry mass (dw) of the disc was used as a weight.
Ratio estimates for foliage and living branches were first calculated by the crown sections. The total living branch biomass was the sum of the individual crown sections as follows:

where DWi is biomass of a crown component i, DWih is biomass of a crown section h, m is the number of crown sections, h is the index of the crown section, i is the index of the crown component (living branches, foliage), FWih is the fresh mass of crown section h, rih is the ratio estimator of crown section h, dwih is a sample branch biomass (dry mass) of crown section h, fwih is the fresh mass of a sample branch of crown section h.
Biomass of dead branches (DWd) was obtained as follows:
DWd = FWd rd
where FWd is the fresh mass of dead branches, rd is the ratio estimator of a sample branch.
2.6 Model approaches
Biomass models for pine, spruce and birch growing in dense stands were constructed to test whether their biomasses and biomass allocations differ from the biomasses of trees growing in the managed stands. The compiled models (NEW) were compared with the Marklund’s (1988) and Repola’s (2008; 2009) biomass models, which are the ones most commonly applied in Sweden and Finland.
In the model specification it is important to address the correlation structure of the data correctly in order to obtain efficient parameter estimates (Parresol 1999). In our biomass data there were both spatial (e.g. hierarchical data) and temporal correlations. The study material was hierarchically structured, with 2-level (temporary plots) and 3-level (factorial experiments) aspects. To define the model, we treated the study site as a 2-level unit (between sites) and the tree (within site) as a 1-level unit. In order to simplify the structure of the data, the plot level was ignored in the factorial experiments. In the factorial experiments, sample tree selection was performed on two or three different occasions. This temporal correlation was assumed to be constant over time, so no separate term for covariance structure was added into the models. The models were developed for the total above-ground biomass and for the biomasses of the individual tree components: stem (including bark), foliage, living and dead branches. These models were developed independently i.e. the across-equation correlation (contemporaneous correlation) was not taken into account in the model estimation. All the simplification was aimed at avoiding a model specification that was too complicated and which could have created problems with deriving the models. These simplifications may reduce the reliability of the parameter test but parameter estimates are still unbiased. In the model specification, a linear mixed model was used as follows:
![]()
where
ln(yki) = logarithm of the biomass of tree i in stand k, kg
xki = vector of the independent variables for tree i in stand k
b = vector of fixed effects
uk = random effect of stand k
eki = residual error for tree i in stand k
The dependent variable (tree biomass or biomass of a tree component) was logarithmically transformed in order to ensure variance homogeneity. The random effect (uk) and residuals errors (eki) were assumed to be uncorrelated, and also assumed to be identically distributed Gaussian random variables with an expected value of 0. When applying the models, a variance correction term, ((var(uk) + var(eki))/2) should be added to the intercept to correct for bias due to the logarithmic transformation. The MIXED procedures in SAS (SAS Institute Inc. 1999) were used to estimate the linear mixed models.
Variables that were incorporated into the model were all significant at the p = 0.05 level. Regressions with significant variables (p = 0.05) were evaluated further using the following tests:
- Plots of the residuals against the independent variables were drawn to check for linearity.
- Plots of the residuals against the predicted values were drawn to check the assumption of constant variance.
- A normal plot of the residuals was drawn to check the normality assumption; Anderson-Darling’s test for normality was performed (Tamhane and Dunlop 2000).
2.7 Comparison with other biomass models
The predictions derived using the models (NEW) compiled in this study were compared with those using Marklund’s (1988) and Repola’s (2008; 2009) models. The reference models were based on tree diameter and height. For the stem biomass, we used Marklund’s (1988) models, which included both stem wood and bark. Marklund did not provide models for birch foliage and total above-ground biomass. Therefore, total tree biomass was obtained by summing the predicted biomass of tree components. The biomass predictions obtained using Repola’s models (2008; 2009) were based on the models for the tree components and for total above-ground biomass. Thus, the stem biomass was the sum of stem wood and bark biomasses.
The predictions were made according to tree species and the tree components: stem (stem wood and bark), living branches and foliage plus total above-ground biomass. Sample trees from our data set were used as the test material. The comparisons were made by calculating the ratio between biomass predictions of the NEW and Marklund’s (1988) models (RATIOM) and between the NEW and Repola’s (2008, 2009) models (RATIOR).
3 Results
3.1 Biomass models
The biomass models were developed for each tree species (pine, spruce and birch) for the total above-ground biomass and for the individual tree components: stem (including bark), foliage, living and dead branches (Table 5). The models were based on diameter at breast height (dbh) and tree height (h), which are both also used commonly as independent variables in biomass models such as those of Marklund (1988) and Repola (2009). The models for pine and birch were based mainly on both dbh and h. But due to low dbh-h variation only dbh was used as an independent variable in the spruce models for stem, foliage and total above-ground biomass.
| Table 5. The parameter estimates of the compiled biomass models for pine, spruce and birch (ln(kg)). dbh is diameter at breast height (cm) and h is tree height (m). The standard error is given in parentheses. View in new window/tab. |
Tree diameter at breast height (dbh) was the most significant independent variable in all models (Table 5). In model formulation, dbh was expressed as a transformation of dbh / (dbh + m), where m is a constant determined by the grid search method (See Marklund 1988; Repola 2008; 2009). A similar transformation, in addition to ln(h), also proved to be a usable expression for tree height. Both dbh and h showed positive correlations with stem biomass. In contrast, branch and foliage biomasses were correlated positively with d and negatively with h. The negative correlation with h indicated that, at a given d, taller trees tended to have lower branch biomass (Fig. 3). This effect seemed to be stronger especially for pine in the NEW models compared with Marklund’s (1988) and Repola’s (2008; 2009) models (Fig. 3). A similar trend was also detected for the foliage biomass of pine (results not shown).
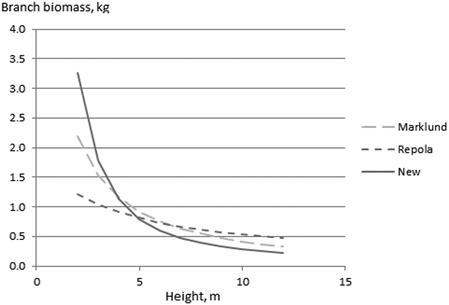
Fig. 3. The effect of tree height on pine branch biomass at a given diameter (6 cm) using the NEW, Marklund (1988) and Repola (2009) biomass models.
3.2 Comparison with the other models
3.2.1 Grand Mean
The biomass models were compared by calculating the ratio between biomass predictions using the NEW and Marklund’s (1988) models (RATIOM) and between the NEW and Repola’s (2008, 2009) models (RATIOR) (Table 6).
| Table 6. The ratio between biomass estimates obtained using the NEW and Marklund’s models (RATIOM) and the NEW and Repola’s models (RATIOR). | ||||||
| Pine | Spruce | Birch | ||||
| RATIOM | RATIOR | RATIOM | RATIOR | RATIOM | RATIOR | |
| Stem | 0.99 | 0.90 | 0.85 | 0.84 | 1.13 | 1.13 |
| Branches | 0.80 | 0.97 | 0.61 | 1.00 | 0.69 | 0.93 |
| Foliage | 1.07 | 1.77 | 1.10 | 1.66 | 17.63 | |
| Total abv. | 0.92 | 0.94 | 0.83 | 0.87 | 0.93 | 1.08 |
Marklund’s 1988) and Repola’s (2008, 2009) models exhibited differences in predicted biomass of the tree components compared with the NEW models. Marklund’s and Repola’s models estimated, on average, higher stem biomass values for pine and spruce, but lower biomass values for birch (Table 6). In terms of RATIOM (0.85) and RATIOR (0.84) the higher estimates for spruce amounted to an average of 15%. For pine, the estimates were still high, but not as high: RATIOM and RATIOR values were, on average, 0.99 and 0.90. The NEW models resulted in higher biomass predictions for birch stems, with an average RATIOM and RATIOR of 1.13 (Table 6).
Marklund’s (1988) models resulted in higher biomass predictions for living branches compared to the NEW models for all tree species, with average RATIOM values of 0.80, 0.61 and 0.69 for pine, spruce and birch respectively Repola’s (2008, 2009) models also generated higher estimates than the NEW model, but the difference was not so great, with average RATIOR values of 0.97 and 0.93 for pine and birch. In contrast, for spruce the RATIOR averaged 1.0, indicating, overall, the same predictions as when using the NEW model (Table 6).
Both Marklund’s (1988) and Repola’s (2009, 2008) models produced lower estimates of the foliage biomass of pine and spruce than the NEW models. RATIOM was, on average, 1.07 and 1.10 for pine and spruce. RATIOR was noticeably higher: 1.77 and 1.66 for pine and spruce (Table 6). For birch foliage, the Repola (2008) model generated wildly different predictions than the NEW model, with a RATIOR of 17.63. RATIOM could not be calculated, because Marklund (1988) did not provide models for birch foliage (Table 6).
For the total above-ground biomass of pine and spruce both Marklund’s (1988) and Repola’s (2008) models predicted, on average, higher biomass values than the NEW models. RATIOM and RATIOR were, on average, 0.92 and 0.94 for pine and 0.83 and 0.87 for spruce. In contrast, for birch RATIOR was 1.08, indicating lower estimates by Repola’s (2008) models (Table 6).
3.2.2 Comparison by diameter classes
In general, RATIOM and RATIOR values for the different tree components were not constant but they were dependent on tree size. Mostly, the higher estimates by Marklund’s (1988) and Repola’s (2008, 2009) models were greatest for the smallest trees. Marklund’s (1988) and Repola’s (2009) models yielded clearly higher stem biomasses for both pine and for spruce than those obtained using the NEW models (Fig. 4). RATIOM and RATIOR values for spruce stems exhibited a similar, increasing trend from 0.7 to 1.0 through the diameter range. For pine stems, the RATIOM and RATIOR values were mainly between 0.9 and 1.0, but for the trees < 4 cm dbh, low values (0.66–0.81) of RATIOR indicated estimates 19–34% higher when using Repola’s (2008) models compared to the NEW models. In turn, this trend tended to be almost the opposite for birch i.e., the smaller the tree diameter, the higher values of RATIOM and RATIOR (Fig. 7). And for small birch with dbh < 6 cm we obtained estimates of 8–31% lower using Marklund’s (1988) and Repola’s (2008) models than when using the NEW models.
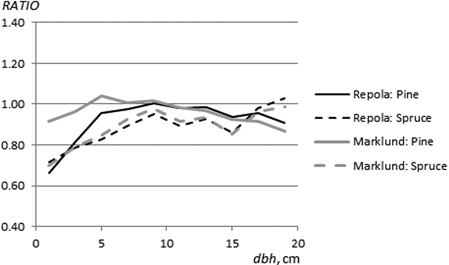
Fig. 4. The ratio between stem biomass estimates (pine and spruce) obtained from the NEW and Marklund’s (1988) models (RATIOM) and the NEW and Repola’s (2008, 2009) models (RATIOR).
Marklund’s (1988) models produced systematically higher estimates of living branch biomass throughout the diameter range than the NEW models. The differences were highest for the smallest trees (diameter < 2 cm) and, varied from 9% to 40% and from 28% to 63% for pine and spruce (Fig. 5). Repola’s (2009) models did not produce systematically higher estimates than the NEW models: the value of RATIOR for pine varied between 0.9 and 1.04 (Fig. 5). The range of RATIOR values for spruce was larger, from 0.68 to 1.11, and systematically higher estimates than the NEW model were detected for trees in the smallest diameter classes (diameter < 5 cm). For birch branches, Marklund’s (1988) model gave systematically higher predictions than NEW, with RATIOM values in the range 0.49–0.78 (Fig. 7). RATIOR values for birch branches varied between 0.53 and 1.16, indicating clearly higher estimates by Repola’s (2008) models for trees with diameter < 4 cm (Fig. 7) than when using the NEW models.
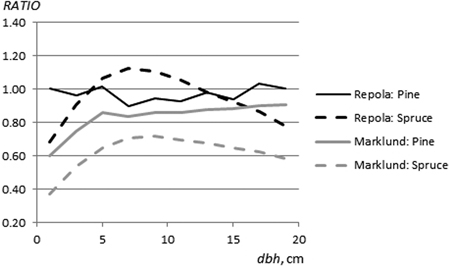
Fig. 5. The ratio between branch biomass estimates (pine and spruce) obtained from the NEW and Marklund’s (1988) models (RATIOM) and the NEW and Repola’s (2008, 2009) models (RATIOR).
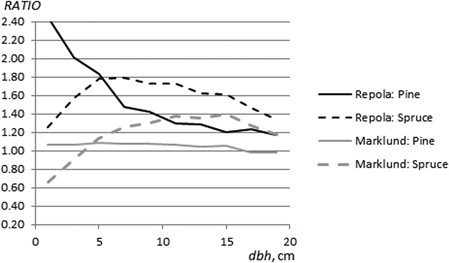
Fig. 6. The ratio between foliage biomass estimates (pine and spruce) obtained using the NEW and Marklund’s (1988) models (RATIOM) and the NEW and Repola’s (2008, 2009) models (RATIOR).
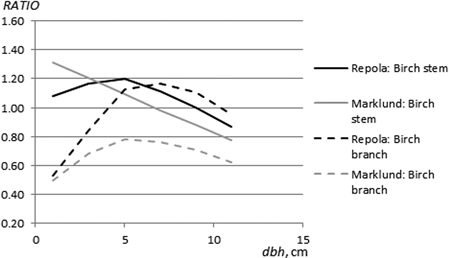
Fig. 7. The ratio between stem and branch biomass estimates (birch) obtained using the NEW and Marklund’s (1988) models (RATIOM) and the NEW and Repola’s (2008, 2009) models (RATIOR).
Marklund’s (1988) models produced very similar foliage estimates to those obtained using the NEW models; the RATIOM value varied between 0.98 and 1.08 over the diameter range (Fig. 6). In contrast, the RATIOM values for spruce varied from 0.66 to 1.40 with higher estimates for trees with diameter < 5 cm and lower estimates for trees with diameter > 5 cm compared to the NEW models (Fig. 6). Repola’s (2009) models clearly estimated both pine and spruce foliage biomass higher than did the NEW models for all diameter classes (Fig. 6). The values of RATIOR for pine showed a decreasing trend with increasing diameter from 2.46 to 1.17. The range of RATIOR values for spruce was narrower, from 1.26 to 1.76.
4 Discussion
In this study, biomass models for the above-ground tree components of Scots pine, Norway spruce and birch were developed. The biomass models were based on a total of 126 pine, 68 spruce and 86 birch trees collected in six stands located on mineral soil, and representing young, dense pine dominated mixed stands in northern Sweden. The models derived were based on the same study stands and partly on the same sample tree material which were used in the study described by Claesson et al. (2001). In both studies, the sample trees harvested when the experiments were established (1997/1998) were used, but in this study we also used sample tree material gathered on two subsequent sampling occasions (2003, 2010).
Based on the study material validity of the compiled models need to be restricted. The NEW models are primarily applicable to unthinned, dense young Scots pine dominated stands with a varied mixture of Norway spruce and birch. Thus, the data relates to stands in which spruce and birch are not the main tree species, and this must be remembered when applying the models to these species. Because the samples were biased towards trees with dbh < 10 cm and only a few sample trees had a dbh > 15 cm, the validity of the NEW models must be restricted to trees with dbh < 15 cm for pine and spruce and < 10 cm for birch.
The compiled biomass models were based on the moderate material. However, the number of the study stands was low, which decreased the applicability of the estimate of the random stand effect. Instead the number of the sample tree was quite large, which enabled reliable predictions for the biomass of the tree components and also a reliable description of the relationships between tree components in dense young stands.. A prerequisite for this is that the models for individual tree components are based on the same sample trees, which fulfilled in our data (Kärkkäinen 2005). In addition, our sample trees were gathered from the same stand at three different times (1998, 2003 and 2010), allowing the more reliable description of the dynamics of biomass allocation in a stand than that can be produced by using cross-sectional data i.e., temporary sample plots (inventory data).
The aim of this study was also to test the applicability of Marklund’s (1988) and Repola’s (2009, 2008) models to young dense stands by comparing these models with the models developed during this study. Our results suggest that Marklund’s 1988) and Repola’s (2008, 2009) models do not work satisfactorily in young dense stands: large differences in predicted biomass values were detected compared with the NEW models. Marklund’s (1988) and Repola’s (2008, 2009) models produced higher estimates than the NEW models for stem (not birch) and living branch biomasses, and lower estimates for foliage biomass. These high estimates also led to high estimates for total above-ground biomass. In general, the differences in the estimates were not constant; there were increasing discrepancies with decreasing tree size i.e., the differences between the old and NEW models were greatest for the smallest trees. The smaller differences for larger trees may be because these were the dominant individuals (highest crown layer), which are under less competitive stress than the smaller trees.
This influence of tree size suggests that the independent variables (dbh and h) have a different relationship to tree biomass in managed and unmanaged dense stands. For example, the negative correlation with h for the branch and foliage biomass models indicates that, at a given diameter, taller trees tended to have lower crown biomass i.e., the height:diameter ratio has a clear impact on crown biomass; an increasing height:diameter ratio is associated with lower crown biomass (Holdaway 1986; Marklund 1988; Hakkila 1991; Mäkelä and Vanninen 1998; Repola 2013). This study showed that the effect of the height:diameter ratio on branch biomass was different in dense stands than in managed stands. Stem biomass has been shown to be correlated positively with the tree dimensions, dbh and height (Marklund 1988; Repola 2013). This was also detected in the dense stands, but stem biomass tended to be lower in the unthinned stands i.e., at a given diameter and height the trees growing in dense stands had lower stem biomass. This can be caused by variations in stem form (tapering) or wood density. Generally, trees growing in managed stands have higher stem taper and consequently also have a lower stem volume than slender trees growing in a dense stands. In the dense stands, a slow diameter growth rate indicates generally higher stem wood density than that in the managed stands (Repola 2013). However, the data from the current study do not support these arguments.
When comparing Repola’s (2008, 2009) and Marklund’s (1988) models, we found that Marklund’s (1988) models resulted in predictions closer to those obtained using the NEW model: slightly for stem biomass (not birch) and clearly for foliage biomass. However, the predictions were clearly unreliable for living branch biomass. One reason for the more reliable estimates of living branch biomass obtained using Repola’s (2008, 2009) models may be that the modelling data consisted of sample trees from the control, unthinned plots in the thinning experiments representing not young but middle-aged stands. In contrast, Marklund’s (1988) models were based only on sample trees gathered from managed stands. Despite this, the results relating to foliage biomass was contrary which is not consistent with the previous conclusion.
Previous studies have shown that trees growing in high density stands, with high levels of competition allocated proportionally more biomass to stems and less to foliage and branches (Van Lear et al. 1984; Naidu et al. 1998; Nilsson and Albrektson 1994). The results of our study did not entirely follow the pattern of biomass allocation presented in the previous studies. The results showed that the biomass allocation to tree components is different in unmanaged and managed young stands. The share of foliage biomass is higher in unmanaged stands and the share of branch and stem biomass correspondingly tended to be higher in managed stands. This difference in biomass allocation seemed to be also size-dependent i.e., the differences tended to increase with decreasing tree diameter. Similar findings have previously been reported by Claesson et al. (2001). This is not surprising because our models were based partly on the same material as used by Claesson et al (2001). The models of Claesson (2001) were developed for trees with a dbh of <10 cm, whereas the sample trees in our data had a dbh up to 21 cm.
The application of biomass models for managed stands (Marklund 1988; Repola 2008, 2009) seems to distort the proportion of biomass allocated to different tree components in young dense stands, and this bias increased with decreasing tree size. This complicates the use of these models in practice. For example, the assessment of harvesting removals from young dense stands, where thinning were done from below, lead biased estimates, which can consequently lead unsatisfactory decision of a stand management.
Finally, the challenge for further biomass modeling is to expand the applicability of the commonly applied models to more diverse growing conditions, such as unthinned stands which will play an important role in energy wood production in the Nordic countries. This study showed that Marklund’s (1988) and Repola’s (2008, 2009) models cannot effectively estimate the biomass of trees growing in young dense stands. These results are not surprising since the Marklund (1988) and Repola (2008. 2009) models were primarily developed for trees from stands managed using standard silvicultural techniques. This conclusion echoes that of Claesson et al. (2001). Although the biomass models constructed (NEW models) in this study cannot be considered to represent widely applicable (general) individual-tree biomass models like Marklund’s (1988) and Repola’s (2008, 2009) models, NEW models can be applied to a large area in northern Sweden and also in similar climate and growing conditions in northern Finland too. The new models are particularly applicable to estimate tree and stand biomass of typical energy tree stand, pine dominated young dense mixed stands.
5 Conclusion
The NEW biomass models developed in this work are based on two variables (dbh and tree height) that are easily measured in forest stands, thus facilitating their practical use in estimating biomass. The NEW models are valid for estimating the biomass of the individual tree components of young Scots pine and Norway spruce trees with dbh < 15 cm in dense stands, and for birch trees with dbh < 10 cm in northern Sweden. As expected, comparisons with previously developed biomass models highlighted the importance of using models designed for the stand densities being considered.
Acknowledgements
The authors thank Svante Claesson for his work on the experiment. Thanks also go to Ida Manfredsson, Ulla Nylander, Emma Sundling, Andréas Säterlönn, Stina Berntsson, Stina Algotsson and Samuel Roturier of the Vindeln Experimental Field Station for their skillful technical help in the field and the lab. We are grateful to SEES Editing Ltd for linguistic revision. This study was funded by the Swedish National Energy administration, Stiftelsen Skogssällskapet.
References
Annual precipitation. (2014). SLU – Swedish University of Agricultural Sciences. http://www-markinfo.slu.se/sve/klimat/ned.html. [Cited 20 Mar 2014].
Bergström D. (2009). Techniques and systems for boom-corridor thinning in young dense forests. Doctoral thesis. Acta Universitatis Agriculturae Sueciae 2009(87). 53 p. ISBN 9789157674340.
Bergström. D., Nordfjell T., Bergsten U. (2010). Compression processing and load compression of young Scots pine and birch trees in thinnings for bioenergy. International Journal of Forest Engineering 21(1): 31–39. http://dx.doi.org/10.1080/14942119.2010.10702588.
Case B.S., Hall R.J. (2008). Assessing prediction errors of generalized tree biomass and volume equations for the boreal forest region of west-central Canada. Canadian Journal of Forest Research 38: 878–889. http://dx.doi.org/10.1139/x07.212.
Claesson S., Sahlén K., Lundmark T. (2001). Functions for biomass estimation of young Pinus sylvestris, Picea abies and Betula sp. from stands in northern Sweden with high stand densities. Scandinavian Journal Forest Research 16(2): 138–146. http://dx.doi.org/10.1080/028275801300088206.
Egnell G., Leijon B. 1997. Effects of different levels of biomass removal in thinning on short-term production of Pinus sylvestris and Picea abies. Scandinavian Journal of Forest Research 12: 17–26. http://dx.doi.org/10.1080/02827589709355379.
Eriksson P., Nordén B. (1999). Bioenergy fuel extraction from stands with cleaning backlog. Skogforsk, Forest Research Institute of Sweden, Report 7. Uppsala, Sweden.
Fries J. (1964). Vårtbjörkens produktion i Svealand och södra Norrland. Studia Forestalia Suecia 14. 303 p. [In Swedish].
Guo Z. (2010). Evaluation of Loblolly pine management regimes in Mississippi for biomass supplies: a simulation approach. Southern Journal of Applied Forestry 34(2): 65–71.
Growing season length. (2014). SLU – Swedish University of Agricultural Sciences. http://www-markinfo.slu.se/sve/klimat/vegper.html. [Cited 20 Mar 2014].
Hägglund B., Lundmark J.-E. (1977). Site index estimation by means of site properties: Scots pine and Norway spruce in Sweden. Studia Forestalia Suecia 138. 38 p.
Hägglund B., Lundmark J.-E. (1987). Bonitering del 1: definitioner och anvisningar. 3 ed. Skogsstyrelsen, Jönköping. ISBN 91-85748-64-1. [In Swedish].
Hakkila. P. (1991). Crown mass of trees at the harvesting phase. Folia Forestalia 773. 24 p.
Hökkä H. (1997). Individual-tree basal area growth models for Scots pine, pubescent birch and Norway spruce on drained peatlands in Finland. Silva Fennica 31(2): 161–178. http://dx.doi.org/10.14214/sf.a8517.
Holdaway M.R. (1986). Modeling tree crown ratio. The Forestry Chronicle 62: 451–455.
Hoogwijk M., Faaij A., Broek R. v. d., Berndes G., Gielen D., Turkenburg W. (2003). Exploration of the ranges of the global potential of biomass for energy. Biomass and Bioenergy 25(2): 119–133. http://dx.doi.org/10.1016/S0961-9534(02)00191-5.
Hynynen J. (1995a). Predicting tree crown ratio for unthinned and thinned Scots pine stands. Canadian Journal of Forest Research 25: 57–62.
Hynynen J. (1995b). Predicting the growth response to thinning for Scots pine stands using individual-tree growth models. Silva Fennica 29(3): 225–246. http://dx.doi.org/10.14214/sf.a9210.
Johansson T. (1999). Biomass equations for determining fractions of European aspen growing on abandoned farmland and some practical implications. Biomass & Bioenergy 17(6): 471–480. http://dx.doi.org/10.1016/S0961-9534(99)00073-2.
Jylhä P., Laitila J. (2007). Energy wood and pulpwood harvesting from young stands using a prototype whole-tree bundler. Silva Fennica 41(4): 763–779. http://dx.doi.org/10.14214/sf.470.
Kärkkäinen L. (2005). Evaluation of performance of tree-level biomass models for forestry modelling and analyses. Finnish Forest Research Institute, Research Papers 940. 123 p.
Kukkola M., Mälkönen E. 1994. The role of logging residues in site productivity after first thinning of Scots pine and Norway spruce stands. In: Boreal forests and global change, September 25–28, 1994, Saskatchewan, Canada. Conference papers, advance abstracts. International Boreal Forest Research Association, IBFRA. p. 45.
Lambert M.-C., Ung C.-H., Raulier F. (2005). Canadian national tree aboveground biomass equations. Canadian Journal of Forest Research 35(8): 1996–2018. http://dx.doi.org/10.1139/x05-112.
Litton C.M., Raich J.W., Ryan M.G. (2007). Carbon allocation in forest ecosystems. Global Change Biology 13(10): 2089–2109. http://dx.doi.org/10.1111/j.1365-2486.2007.01420.x.
Mäkelä A., Vanninen P. (1998). Impacts of size and competition on tree form and distribution of aboveground biomass in Scots pine. Canadian Journal of Forest Research 28: 216–227.
Mård H. 1998. Short-term growth effects of whole-tree harvest in early thinnings of birch (Betula spp.) and Picea abies. Scandinavian Journal of Forest Research 13: 317–323. http://dx.doi.org/10.1080/02827589809382990.
Marklund L.G. (1987). Biomass functions for Norway spruce (Picea abies (L.) Karst.) in Sweden. Institutionen för Skogstaxering, Sveriges Lantbruksuniversitet, Report 43. [In Swedish].
Marklund L.G. (1988). Biomass functions for pine, spruce and birch in Sweden. Institutionen för Skogstaxering, Sveriges Lantbruksuniversitet, Report 45. [In Swedish].
Monserud R.A., Huang S.M., Yang Y.Q. (2006). Biomass and biomass change in lodgepole pine stands in Alberta. Tree Physiology 26(6): 819–831. http://dx.doi.org/10.1093/treephys/26.6.819.
Muukkonen P., Mäkipää R. (2006). Biomass equations for European trees: addendum. Silva Fennica 40(4): 763–773. http://dx.doi.org/10.14214/sf.475.
Naidu S.L., Delucia E.H., Thomas R.B. (1998). Contrasting patterns of biomass allocation in dominant and suppressed loblolly pine. Canadian Journal of Forest Research 28: 1116–1124.
Näslund M. (1936). Skogsförsöksanstaltens gallringsförsök i tallskog. Primärbearbetning. Meddelanden från Statens Skogsförsöksanstalt 29(1). [In Swedish].
Nilsson U., Albrektson A. (1994). Growth and self-thinning in two young Scots pine stands planted at different initial densities. Forest Ecology and Management 68: 209–215.
Parresol B.R. (1999). Assessing tree and stand biomass: a review with examples and critical comparisons. Forest Science 45(4): 573–593.
Parresol B.R. (2001). Additivity of nonlinear biomass equations. Canadian Journal of Forest Research 31: 865–878.
Pettersson H. (1955). Barrskogens volymproduktion. Meddelanden från Statens skogsforskningsinstitut 45. 391 p. [In Swedish].
Pettersson N. (1993). The effect of density after precommercial thinning on volume and structure in Pinus sylvestris and Picea abies. Scandinavian Journal of Forest Research 8(4): 528–539. http://dx.doi.org/10.1080/02827589309382799.
Polagye B.L., Hodgson K.T., Malte P.C. (2007). An economic analysis of bio-energy options using thinnings from overstocked forests. Biomass and Bioenergy 31(2–3): 105–125. http://dx.doi.org/10.1016/j.biombioe.2006.02.005.
Repola J. (2008). Biomass equations for birch in Finland. Silva Fennica 42(4): 605–624. http://dx.doi.org/10.14214/sf.236.
Repola J. (2009). Biomass equations for Scots pine and Norway spruce in Finland. Silva Fennica 43(4): 625–647. http://dx.doi.org/10.14214/sf.184.
Repola J. (2013). Modelling tree biomasses in Finland. Dissertationes Forestales 158. 113 p. http://dx.doi.org/10.14214/df.158.
SAS Institute Inc. (1999). SAS OnlineDoc version 9.3. SAS Institute Inc., Cary, North Carolina.
Satoo T., Madgwick H.A.I. (1982). Forest biomass (Forestry Sciences ed.). Martinus Nijhoff/Dr W. Junk Publishers, The Hague, Boston, London. 152 p. ISBN 90-247-2710-3.
SMHI. (2014). Swedish Meteorological and Hydrological Institute. http://www.smhi.se/klimatdata/meteorologi/nederbord/1.6934. [Cited 20 Mar 2014].
Statistical yearbook of forestry. Official statistics of Sweden. (2014). Skogsstyrelsen, Jönköping. ISBN 978-91-87535-01-7. http://www.skogsstyrelsen.se/Myndigheten/Statistik/Skogsstatistik-Arsbok/.
Stupak I., Nordfjell T., Gundersen P. (2008). Comparing biomass and nutrient removals of stems and fresh and predried whole trees in thinnings in two Norway spruce experiments. Canadian Journal of Forest Research 38(10): 2660–2673. http://dx.doi.org/10.1139/x08-1008.
Tamhane A.C., Dunlop D.D. (2000). Statistics and data analysis. Prentice-Hall, Inc. 722 p. ISBN 0-13-744426-5.
Tamm C.O. 1991. Nitrogen in terrestrial ecosystems – questions of productivity, vegetational changes, and ecosystem stability. In: Billings W.D., Golley F., Lange O.L., Olson J.S., Remmert H. (eds.). Ecological studies. Springer Verlag, Berlin, Heidelberg. 116 p. ISBN 0-387-51807-x.
Temperature sum. (2014). SLU – Swedish University of Agricultural Sciences. http://www-markinfo.slu.se/sve/klimat/tempsum.html. [Cited 20 Mar 2014].
Tveite B., Hanssen K.H., 2013. Whole-tree thinnings in stands of Scots pine (Pinus sylvestris) and Norway spruce (Picea abies): short- and long-term growth results. Forest Ecology and Management 298: 52–61. http://dx.doi.org/10.1016/j.foreco.2013.02.029.
Ulvcrona K.A. (2011). Effects of silvicultural treatments in young Scots pine dominated stands on the potential for early biofuel harvest. Doctoral thesis. Acta Universitatis Agriculturae Sueciae 2011(79). 64 p. ISBN 978-91-576-7623-8.
Van Lear D.H., Waide J.B., and Teuke M.J. (1984). Biomass and nutrient content of a 41-year-old loblolly pine (Pinus taeda L.) plantation on a poor site in South Carolina. Forest Science 30: 395–404.
Zianis D., Muukkonen P., Mäkipää R., Mencuccini M. (2005). Biomass and stem volume equations for tree species in Europe. Silva Fennica Monographs 4. 63 p.
Total of 53 references
