Olli Muhonen  ,
Heli Peltola,
Annamari Laurén,
Veli-Pekka Ikonen,
Juha Nevalainen,
Laura Pikkarainen,
Antti Kilpeläinen,
Samuli Launiainen,
Marjo Palviainen
,
Heli Peltola,
Annamari Laurén,
Veli-Pekka Ikonen,
Juha Nevalainen,
Laura Pikkarainen,
Antti Kilpeläinen,
Samuli Launiainen,
Marjo Palviainen
Spatial evenness of fertilization and short-term volume growth responses of Scots pine and Norway spruce to fertilization intensity
Muhonen O., Peltola H., Laurén A., Ikonen V.-P., Nevalainen J., Pikkarainen L., Kilpeläinen A., Launiainen S., Palviainen M. (2025). Spatial evenness of fertilization and short-term volume growth responses of Scots pine and Norway spruce to fertilization intensity. Silva Fennica vol. 59 no. 1 article id 24026. https://doi.org/10.14214/sf.24026
Highlights
- Differences between the target and the measured fertilizer doses were in a range of 3–22% for fertilization treatments in Scots pine and Norway spruce study sites
- The volume growth response was affected by the initial basal area and fertilization dose
- The fertilization dose correlated with nitrogen concentrations in needles and soil organic (humus) layer and volume growth.
Abstract
We studied the spatial evenness of nitrogen (N) fertilizer and the effects of fertilization intensity on the short-term volume growth responses in two ground-fertilized Scots pine and two airborne-fertilized Norway spruce study sites on mesic (Myrtillus-type) upland forests in Eastern Finland. We also studied the relationships between measured fertilizer dose, N concentrations in the needles and soil organic (humus) layer, and volume growth of the trees. In each study site, we established three replicate 1 ha blocks for each fertilization treatment (0, 150 and 200 kg N ha–1). Each block contained three 200 m2 circular plots. The spatial evenness of the fertilizer was measured using textile funnels. The height, breast height diameter and vitality of the trees were measured annually. The nutrient concentrations in the needles and humus layer were measured once. Differences between the target and measured fertilizer doses were 3–10% for Scots pine and 11–22% for Norway spruce. At the Scots pine and Norway spruce sites, the volume growth was 0.4–2.1 and 1.8–2.6 m3 ha–1 a–1 higher with fertilization, respectively. The fertilizer dose correlated with the N concentrations in the needles and humus layer, and volume growth. Significant volume growth responses to the fertilization (p < 0.05) were found only in the Scots pine at Ilomantsi, possibly due to variations in the initial volume and the fertilizer dose realized between and within treatments. We expect that the differences in volume growth responses between fertilization treatments will increase over time.
Keywords
Pinus sylvestris;
boreal forest;
Picea abies;
stand growth;
forest fertilization;
upland forests;
nitrogen fertilizer dose
-
Muhonen,
University of Eastern Finland, School of Forest Sciences, Yliopistokatu 7, FI-80101 Joensuu, Finland
 https://orcid.org/0009-0007-4051-8567
E-mail
ollmu@uef.fi
https://orcid.org/0009-0007-4051-8567
E-mail
ollmu@uef.fi
-
Peltola,
University of Eastern Finland, School of Forest Sciences, Yliopistokatu 7, FI-80101 Joensuu, Finland
https://orcid.org/0000-0003-1384-9153
E-mail
heli.peltola@uef.fi
-
Laurén,
University of Eastern Finland, School of Forest Sciences, Yliopistokatu 7, FI-80101 Joensuu, Finland; University of Helsinki, Department of Forest Sciences, Latokartanonkaari 7, FI-00014 Helsinki, Finland
https://orcid.org/0000-0002-6835-9568
E-mail
annamari.lauren@helsinki.fi
-
Ikonen,
University of Eastern Finland, School of Forest Sciences, Yliopistokatu 7, FI-80101 Joensuu, Finland
https://orcid.org/0000-0003-1732-2922
E-mail
veli-pekka.ikonen@uef.fi
-
Nevalainen,
University of Eastern Finland, School of Forest Sciences, Yliopistokatu 7, FI-80101 Joensuu, Finland
https://orcid.org/0009-0000-2972-4385
E-mail
juha.hs.nevalainen@gmail.com
-
Pikkarainen,
University of Eastern Finland, School of Forest Sciences, Yliopistokatu 7, FI-80101 Joensuu, Finland
https://orcid.org/0000-0001-5301-3639
E-mail
laura.pikkarainen@uef.fi
-
Kilpeläinen,
University of Eastern Finland, School of Forest Sciences, Yliopistokatu 7, FI-80101 Joensuu, Finland
https://orcid.org/0000-0003-4299-0578
E-mail
antti.kilpelainen@uef.fi
-
Launiainen,
Natural Resources Institute Finland, Bioeconomy and Environment, Latokartanonkaari 9, FI-00790 Helsinki, Finland
https://orcid.org/0000-0001-6611-6573
E-mail
samuli.launiainen@luke.fi
-
Palviainen,
University of Helsinki, Department of Forest Sciences, Latokartanonkaari 7, FI-00014 Helsinki, Finland
https://orcid.org/0000-0001-9963-4748
E-mail
marjo.palviainen@helsinki.fi
Received 26 April 2024 Accepted 22 April 2025 Published 15 May 2025
Views 43631
Available at https://doi.org/10.14214/sf.24026 | Download PDF

Supplementary Files
1 Introduction
Nitrogen (N) fertilization is a rapid and resource-efficient method of increasing forest growth and mitigating climate change through enhanced carbon (C) sequestration and wood production in upland boreal forests (Saarsalmi and Mälkönen 2001; Pettersson and Högbom 2004; Hyvönen et al. 2008; Jörgensen et al. 2021). This is because N is the main growth-limiting nutrient in most upland boreal forests (Saarsalmi and Mälkönen 2001). Fertilization affects C and nutrient cycling directly through improved nutrient availability, and indirectly through changes in soil chemical properties, understory vegetation, litter inputs and the decomposition rate of soil organic matter (Olsson et al. 2005; Coucheney et al. 2013; Maljanen et al. 2014; Bonner et al. 2019). Fertilization increases the C stocks in the tree biomass, understory vegetation and soil (Mäkipää 1995; Hyvönen et al. 2008). The increase in soil C stocks is due to the increased litter production and decreased decomposition rate of soil organic matter (Högberg 2007; Janssen et al. 2010; Marshall et al. 2021).
Forest growth responses to fertilization have been extensively studied in various fertilization experiments in Finland (Kukkola and Saramäki 1983; Saarsalmi and Mälkönen 2001) and in other Nordic countries (Nilsen et al. 2001; Bergh et al. 2014; Hanssen et al. 2020). Based on earlier studies, the growth responses may differ, largely depending on fertilizer dose and type, site fertility, climatic conditions and stand structure. In practical forestry, the fertilizer dose has typically been about 150 kg N ha–1 for Scots pine (Pinus sylvestris L.) and Norway spruce (Picea abies (L.) Karst.) stands on upland sites in the Nordic countries (Hedwall et al. 2014; Äijälä et al. 2019). This has resulted in an additional volume growth of 6–20 m3 ha–1 over the following 6–8 years in Scots pine stands on sub-xeric sites and 8–10 years in Norway spruce stands on mesic sites, respectively (Kukkola and Saramäki 1983; Nilsen 2001; Nohrsted 2001; Saarsalmi and Mälkönen 2001; Bergh et al. 2014). The volume growth increase has been determined to be the largest 3–5 years after fertilization (Kukkola and Saramäki 1983; Ilvesniemi et al. 2023). It has also been found to be larger in middle-aged stands and to decrease slowly with stand age (Gustavsen and Lipas 1975; Ilvesniemi et al. 2023). Fertilizer doses exceeding 150 kg N ha–1 may further increase the volume growth, but the additional growth per added amount of N is lower (Ilvesniemi et al. 2023).
Too intensive fertilization may increase greenhouse gas emissions and nutrient export to water courses (Saarsalmi and Mälkönen 2001; Hedwall et al. 2014; Håkansson et al. 2021). It may also have adverse effects on the species composition of the ground vegetation (Strengbom and Nordin 2008; Hedwall et al. 2014) and the quality of the wood (Jaakkola et al. 2006; Mäkinen and Hynynen 2014). These concerns, together with decreased state financial subvention, have restricted the extensive use of fertilization in Finland over the last few decades. For example, in 2018, about 60 000 ha were fertilized, which is only around 25% of the area fertilized in the 1970s in Finland. However, in the Nordic countries, there is growing interest in using forest fertilization as a rapid tool to enhance forest C sequestration and stocks for climate change mitigation, and to improve wood production per unit area to enhance the multiple use of forests. The adverse environmental effects may also be kept at a bearable level by using tailored fertilization schemes. But this requires scaling the amount and type of fertilizer to the actual nutrient demand and supply of the site. The lack of financial incentives for N fertilization on upland sites may also restrict the interest of forest owners in fertilization.
In previous fertilization studies, the fertilizers have been spread manually throughout the study sites (plots) to ensure the spatially even distribution of the fertilizer. In practical forestry, the ground spreading of fertilizers using a forwarder is typical in Scots pine stands. In Norway spruce stands, but also in Scots pine stands, if the site is not accessible by forest machines using harvesting trails, a helicopter with a centrifugal spreader is commonly used. In practical forestry, the spreading of fertilizers is likely to be spatially more uneven compared to spreading fertilizers manually on site. The spatial evenness of the fertilization is affected by the prevailing wind conditions, area geometry, stand structure and the spreading type/unit, as well as the type of fertilizer (Virtanen 1975; Tiitinen 2014). An uneven distribution of the fertilizer is likely to result in spatial heterogeneity in the N cycling and ground vegetation as well (Jetsonen et al. 2024). This can affect tree growth responses (Paavilainen and Virtanen 1977). Previous studies on the spatial evenness of airplane fertilization are from the 1970s and non-centrifugal distributors used that time are no longer in use (Ballard 1970; Armson 1972; Gustavsson 1972). Thus, there is an urgent need to study the spatial evenness of fertilization and the resulting growth responses of trees when fertilization is performed using modern airborne and ground spreading methods.
The aim of this study was to investigate the spatial evenness of fertilization and the effects of fertilization intensity on the short-term (3–4 post-fertilization years) volume growth responses in two ground-fertilized Scots pine and two airborne-fertilized Norway spruce study sites on mesic (Myrtillus-type, MT) upland forests in Eastern Finland. We also studied the relationships between measured fertilizer dose, N concentrations in the needles and the soil organic layer, and volume growth. In each study area, we established three replicate blocks, each with an area of 1 ha, for each fertilization treatment (targets of 0, 150 and 200 kg N ha–1). Each block contained three circular study plots, each with an area of 200 m². The spatial evenness of the fertilization was measured using textile funnels. The height, diameter at breast height (Dbh, at 1.3 m high) and vitality of the trees were measured annually for all trees with Dbh > 8 cm. The nutrient concentrations in the needles and soil organic layer were measured once during the 3–4 (full) post-treatment growing seasons.
2 Materials and methods
2.1 Experimental layout
The fertilization experiments were established in two Scots pine- and two Norway spruce-dominated study sites, which were thinned 4–8 years before the fertilization. The study sites (each 10 ha) were all located on mesic (Myrtillus-type, MT, based on the site type classification of Cajander 1949) upland forests in Eastern Finland (Table 1 and Fig. 1). Each fertilization treatment (target fertilizer doses of 0, 150 and 200 kg N ha–1) had three replicate blocks, each of 1 ha (Fig. 1). Before the fertilization, we established three circular plots, each with a 7.98 m radius (area of 200 m²) in each replicate block. In each plot, we measured the tree and soil attributes and the spatial evenness of the fertilization.
| Table 1. Description of fertilization experiments at the different study sites with climate and initial stand attributes. The mean annual air temperature and annual precipitation were 30-year averages from 1990 to 2020 (Finnish Meteorological Institute 2023). During the study period, the mean annual air temperature was 0.8 °C higher, and the annual precipitation slightly lower (592–667 mm) than the 30-year average (Finnish Meteorological Institute 2023). The stand characteristics were calculated as the averages of the 27 circular plots (trees with Dbh > 8 cm) for each study site. | ||||
| Study site | Liperi | Ilomantsi | Juuka | Savonranta |
| Location | 62.55846 N, 29.06265 E | 62.85543 N, 30.67705 E | 63.066199 N, 28.874640 E | 62.139028 N, 29.149086 E |
| Altitude (m above sea level) | 160 | 180 | 170–200 | 120–140 |
| Main tree species | Pinus sylvestris | Pinus sylvestris | Picea abies | Picea abies |
| Pinus sylvestris, Picea abies, Betula spp. volume (%) | 78.0, 19.3 and 2.7 | 86.0, 12.5 and 1.5 | 8.8, 86.6 and 4.6 | 11.6, 86.4 and 2.0 |
| Mean annual air temperature (°C) | 3.5 | 3.0 | 2.8 | 3.4 |
| Effective temperature sum (d.d.) | 1200–1300 | 1100–1200 | 1100–1200 | 1200–1300 |
| Annual precipitation (mm) | 640 | 644 | 661 | 670 |
| Initial stand attribute measurements | 24 May–7 Jun 2018 | 8–21 Jun 2018 | 13–22 May 2019 | 23–31 May 2019 |
| Fertilization | 27 Jun 2018 | 20 Jul 2018 | 25–27 Jul 2019 | 10 Aug 2019 |
| Stand density (stems ha–1) | 513 | 687 | 619 | 455 |
| Mean basal area (m² ha–¹) | 19 | 20 | 20 | 17 |
| Mean stand diameter (cm) | 23 | 18 | 21 | 21 |
| Initial stand volume (m3 ha–1) | 167 | 170 | 187 | 159 |
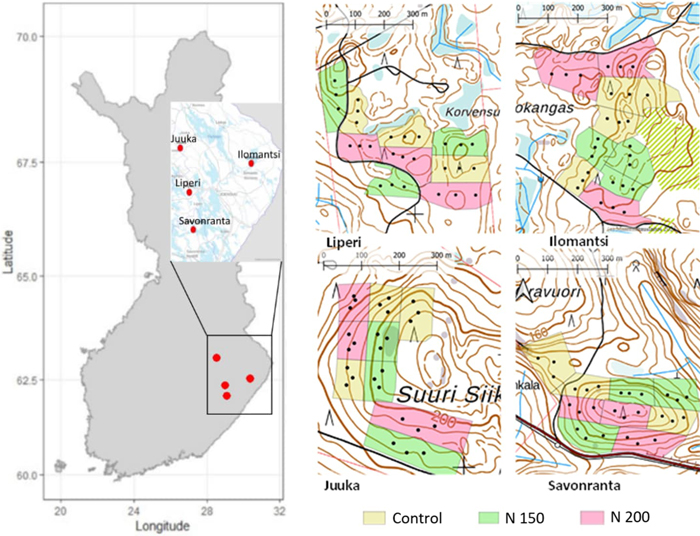
Fig. 1. Layout of the fertilization experiments using ground spreading in the Scots pine study sites at Liperi and Ilomantsi and helicopter spreading in the Norway spruce study sites at Juuka and Savonranta. Each of the three fertilization treatments (target doses of 0, 150 and 200 kg N ha–1) were applied to three replicate 1-ha blocks, each containing three circular plots (radius 7.98 m, area 200 m2).
For the Scots pine study sites in Liperi and Ilomantsi, the fertilization was performed using ground spreading. There, a centrifugal spreader was used on a forwarder (see Supplementary file S1 for details). For the Norway spruce study sites in Juuka and Savonranta, the fertilizer was applied using helicopter spreading (see Suppl. file S1 for details). During the fertilization, the weather was fair and wind was mild. The commercial fertilizer YaraBela Metsäsalpietari was used for the Scots pine study sites and YaraMila Metsän NP for the Norway spruce study sites. YaraBela Metsäsalpietari contains 26.8% N (as 12.2% nitrate N, 14.6% ammonium N), 1% potassium (K), 1% magnesium (Mg), 4% sulphur (S) and 0.15% boron (B). Fertilization with 150 and 200 kg N ha–1 corresponded to 550 and 750 kg of fertilizer dose per hectare, respectively. YaraMila Metsän NP contains 25% N (as 12% nitrate N, 13% ammonium N), 2% phosphorus (P), 1% Mg, 0.3% B and 0.1% zinc (Zn). Fertilization with 150 and 200 kg N ha–1 corresponded to a 600 and 800 kg fertilizer dose ha–1, respectively. For Metsäsalpietari and Metsän NP, the granule size was 2–4 mm and the cubic weight was, respectively, 1.0 and 1.1.
2.2 Measurements of spatial evenness of fertilization
The spatial evenness of the fertilization was measured in each circular plot using textile funnels. Three textile funnels, each with a diameter of 50 cm (area 19.6 dm2), were placed 3 m from the plot centre at all the study sites except for Ilomantsi. There, there were six funnels, one placed in the centre of the plot, four in the form of a cross, each 4 m from the centre, and one 4 m from the centre in the direction of the trail. The closest control plots were equipped with funnels to ensure zero fertilizer.
Immediately after fertilization, the fertilizer particles were collected from the funnels and placed in plastic bags before drying and weighing them in the laboratory. The dry weight of the fertilizer in the funnels was first averaged for each circular plot, and then further averaged for each block and treatment. The measured weight of the fertilizer particles was converted into kilograms of N per hectare for further analysis. Based on the Global Positioning System (GPS) (see Suppl. file S1), we were able to confirm that the fertilizer was applied as planned over the entire fertilization area.
2.3 Measurements of tree characteristics and N concentration in needles and soil
The tree height and Dbh (at 1.3 m) for the different tree species and their status (living/dead) were determined for all the trees with Dbh > 8 cm. Measurements were taken before fertilization, in 2018 at the Scots pine study sites and in 2019 at the Norway spruce study sites, and thereafter at the end of each growing season until autumn 2022. In the Scots pine study site at Ilomantsi, all the sample plots were accidentally thinned in mid-summer 2022, before the sample tree measurements were taken. Therefore, we estimated the growth in Dbh in 2022 for the trees that were removed in the thinning based on their diameter at the stump height, but keeping their height the same as in the previous year. This was done because there was quite a large variation in the measured height and diameter growth of trees with similar tree heights or diameters, meaning it was not possible to predict the height (or Dbh) growth in 2022 based on the relationship between their height (or diameter) from the previous year and the height (or diameter) growth in 2022 from other trees in the plot. Thus, the volume growth of the trees harvested in 2022 was slightly underestimated at this site. The volume of the sample trees was calculated annually based on their height and Dbh using the volume functions in Laasasenaho (1982).
In late April 2021, from all 108 circular plots, we extracted needle samples from two dominant trees, from the newest shoots of the upper part of the living crown and merged them. These merged needle samples were first oven-dried and ground, and then sent for nutrient (N, P, K, B) content analysis at the Yara Laboratory in the United Kingdom. The N concentrations were compared to diagnostic levels (Reinikainen et al. 1998). For Scots pine, the optimal N level is 1.5–2.1% of dry mass, and for Norway spruce, 1.3–1.5%. In September 2022, we also collected soil samples from the soil organic layer and mineral soil to a soil depth of 0–20 cm from each circular plot using a cylindrical soil corer with a diameter of 2.5 cm (for more details, see Jetsonen et al. 2024). The soil samples were first oven-dried at 40 °C for 48 h and then weighed. The <2-mm fraction was then used for further analysis of the soil N content using a varioMAXcube analyser.
2.4 Data analyses
The spatial evenness of the fertilization for the treatments of 150 and 200 kg N ha–1 was tested separately for each Scots pine and Norway spruce study site based on block-level averages using a one-sample t test. The spatial evenness between the treatments was tested using an independent sample t test. In the statistical data analyses, the fertilization treatments of 150 and 200 kg N ha–1 were considered as grouping variables.
In the Scots pine study site at Liperi, 22, 22 and 6 trees died in the plots representing the control, normal and higher fertilization intensities, respectively, during the study period. The corresponding numbers in the Scots pine study site at Ilomantsi were 6, 11 and 11, respectively. In the Norway spruce study site at Savonranta, 22, 17 and 22 trees died, and in Juuka, 67, 78 and 78 trees died, respectively, because of snow damage.
Due to tree mortality, we tested the differences in the cumulative volume growth of the trees living at each study site in 2018–2022 for the Scots pine study sites and 2019–2022 for the Norway spruce study sites between all fertilization treatments (targets of 0, 150 and 200 kg N ha–1), and between the fertilized (targets of 150 and 200 kg N ha–1) and control (target of 0kg N ha–1) treatments. Statistically significant differences between the treatments were tested using a univariate analysis of variance (UNIANOVA). Differences between the N concentration treatments and the contents in the needles and soil organic (humus) layer were also tested through UNIANOVA.
In the statistical data analyses, the fertilization treatments of 0, 150 and 200 kg N ha–1 were considered as fixed effects, while the block was used as a random effect. Because the initial basal area in square metres per hectare was different in the fertilized treatments compared to the control, it was used as a covariate in the volume growth analysis (same effect as using the initial volume). The data was tested for normality and homogeneity of variance using the Levene’s test. If these assumptions were not met, a natural logarithm transformation was used. We used IBM SPSS Statistics v.29.0 for all the statistical analyses. We also analysed the relationships between the fertilizer dose, N concentrations in the needles and soil organic (humus) layer, and volume growth in the Scots pine and Norway spruce study sites based on block-level averages for the three circular plots per treatment, using linear regression analysis.
3 Results
3.1 Spatial evenness of fertilization
In the Scots pine study site at Liperi, the measured N fertilizer dose was, on average, 155 ± 27 kg N ha–1 over the three blocks (each including the three circular plots) for the 150 kg N ha–1 fertilization treatment, this being 3% higher than the target of 150 kg N ha–1 (Fig. 2). For the 200 kg N ha–1 fertilization treatment, the measured dose was, on average, 218 ± 32 kg N ha–1, this being 9% higher than the target. At the Ilomantsi study site, for the 150 kg N ha–1 fertilization treatment, the measured fertilizer dose was, on average, 135 ± 41 kg N ha–1, this being 10% lower than the target (Fig. 2). For the 200 kg N ha–1 of fertilization treatment, the measured dose was, on average, 278 ± 52 kg N ha–1, this being 39% higher than the target. Both at the Liperi and Ilomantsi study sites, the measured average fertilizer doses for the fertilized treatments with targets of 150 and 200 kg N ha–1 differed significantly from each other (p < 0.05).
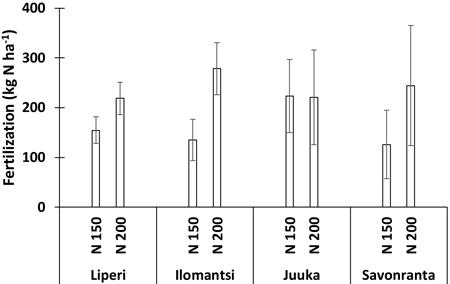
Fig. 2. Average ± standard deviation for measured fertilizer dose (kg N ha–1) over three blocks (each containing three circular plots) for each fertilization treatment delivered via ground spreading in the Scots pine study sites at Liperi and Ilomantsi and via aerial spreading in the Norway spruce study sites at Juuka and Savonranta in comparison to the fertilizer targets of 150 and 200 kg N ha–1.
In the Norway spruce study site at Savonranta, the measured N fertilizer dose was, on average, 126 ± 69 kg N ha–1 over the three blocks for the 150 kg N ha–1 fertilization treatment, this being 16% lower than the target (Fig. 2). For the 200 kg N ha–1 fertilization treatment, the measured dose was, on average, 244 ± 120 kg N ha–1, this being 22% higher than the target. At the Juuka study site, the measured fertilizer dose was, on average, 223 ± 73 kg N ha–1 for the 150 kg N ha–1 fertilization treatment, this being 49% higher than the target (Fig. 2). For the 200 kg N ha–1 fertilization treatment, the measured dose was, on average, 221 ± 95 kg N ha–1, this being 11% higher than the target. Thus, the measured averages for the fertilizer doses were equal for both fertilization treatments at the Juuka study site. At the Savonranta study site, the measured average fertilization doses for the fertilized treatments 150 and 200 kg N ha–1 differed statistically significantly from each other (p < 0.05).
3.2 Volume growth responses
In the Scots pine study sites at Liperi and Ilomantsi, the initial volumes prior to the fertilization treatments 0, 150 and 200 kg N ha–1 were in the range of 161–173 and 167–172 m3 ha–1, respectively. At the Liperi study site, the initial volume was, on average, the smallest for the 150 kg N ha–1 fertilization treatment and the largest for the control treatment (Fig. 3). At the Ilomantsi study site, it was, on average, the smallest for the control and 150 kg N ha–1 fertilization treatments and the largest for the 200 kg N ha–1 fertilization treatment (Fig. 3). At the Liperi study site, the total volume growth over five growing seasons was in the range of 41.5–45.7 m3 ha–1, corresponding 8.3, 9.1 and 8.7 m3 ha–1 a–1 for the control, 150 and 200 kg N ha–1 fertilization treatments. At the Ilomantsi study site, the total volume growth was in the range of 36.3–47.0 m3 ha–1, corresponding 7.3, 8.8 and 9.4 m3 ha–1 a–1 for the control, 150 and 200 kg N ha–1 fertilization treatments. At the Liperi and Ilomantsi study sites, the volume growth was for the fertilized treatments 0.4–0.8 and 1.5–2.1 m3 ha–1 a–1 higher, respectively, than for the control treatment.
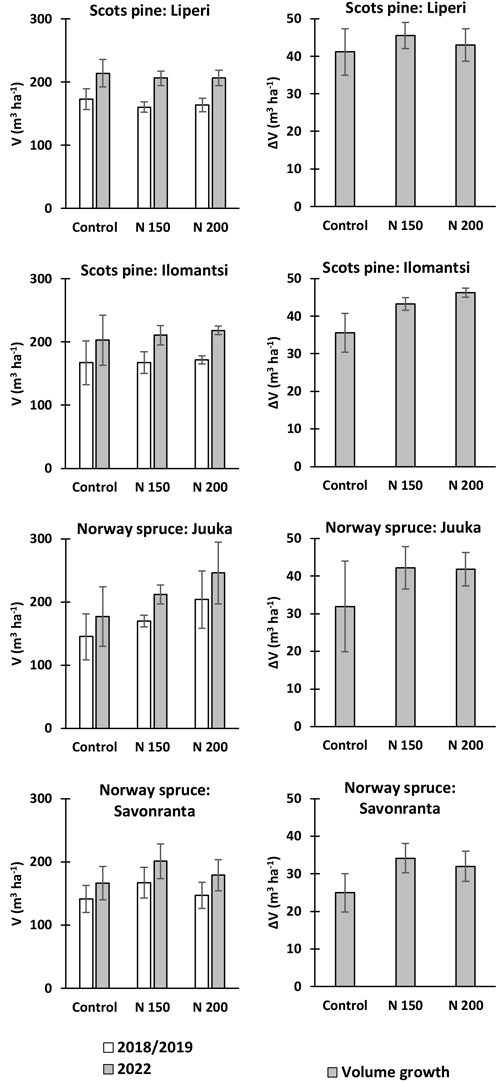
Fig. 3. Initial and final volume (V) of living trees at the end of the study period (left) and the corresponding volume growth (ΔV) of the trees (right) over three blocks (each containing three circular plots) for each fertilization treatment in the Scots pine study sites at Liperi and Ilomantsi and in the Norway spruce study sites at Juuka and Savonranta for fertilizer targets of 0, 150 and 200 kg N ha–1.
In the Norway spruce study sites at Savonranta and Juuka, the initial volume prior to fertilization treatments 0, 150 and 200 kg N ha–1 were in the range of 141–167 and 145–204 m3 ha–1, respectively. At the Savonranta study site, the initial volume was, on average, the smallest for the control and largest for the 150 kg N ha–1 fertilization treatment (Fig. 3). At the Juuka study site, the volume was smallest for the control and largest for the 150 and 200 kg N ha–1 fertilization treatments (Fig. 3). At the Savonranta study site, the total volume growth was in the range of 25.0–34.2 m3 ha–1, corresponding 6.3, 8.6 and 8.1 m3 ha–1 a–1 for the control, 150 and 200 kg N ha–1 fertilization treatments, respectively. At the Juuka study site, the total volume growth was in the range of 32.2–42.3 m3 ha–1, corresponding 8.0, 10.6 and 10.5 m3 ha–1 a–1 for the control, 150 and 200 kg N ha–1 fertilization treatments, respectively. At the Savonranta and Juuka study sites, the volume growth was for the fertilized treatments 1.8–2.3 and 2.5–2.6 m3 ha–1 a–1 higher than for the control treatments.
The initial basal area of the trees affected the volume growth over the study period significantly (p < 0.05) at all the study sites. The volume growth was lowest for the control treatments at all the study sites. However, significant differences in volume growth were not found in the study sites either between the control and fertilized treatments or between the three fertilization treatments, except for the Scots pine study site at Ilomantsi. There, significant differences in volume growth were found between the control and fertilized treatments (p < 0.05). These results may be due to quite large between- and within-treatment variations (between the blocks and sample plots) of the initial basal area and volume (Fig. 3) and further annual volume growth (Suppl. file S2), but also due to the large variation in realized fertilizer dose in the fertilized plots (Fig. 2).
3.3 The relationships between the fertilizer dose, N concentration in the needles and humus layer, and volume growth
In the Scots pine study sites at Liperi and Ilomantsi, the average N concentrations in the needles were in the range of 1.23–1.47 and 1.21–1.42% over all fertilization treatments, respectively (Fig. 4). At the Ilomantsi study site, the N concentration in the needles was significantly higher in the fertilized treatments than in the control treatment. It was there also statistically significantly (p < 0.05) higher for the 200 kg N ha–1 fertilization treatment compared to the other treatments. In the Norway spruce study sites at Savonranta and Juuka, the N concentration in the needles were in the range of 0.81–1.14 and 0.91–1.23%, respectively (Fig. 4). There, they were higher for both fertilization treatments than for the control treatment. However, statistically significant (p < 0.05) differences in the N concentrations in the needles were found between the control and fertilization treatments only at the Juuka study site.
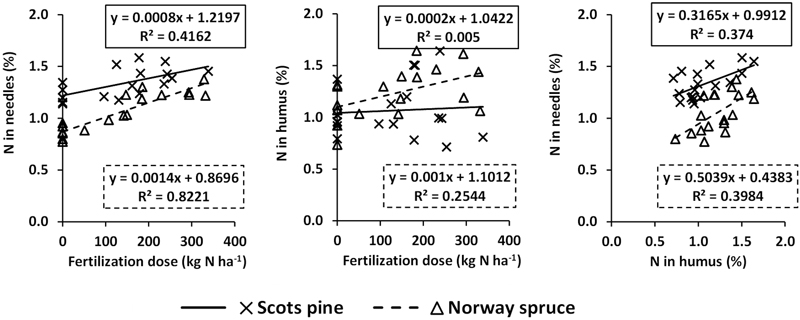
Fig. 4. Relationships between realised fertilizer dose based on block-level averages from the circular plots and measured concentrations of N in the needles (left) and the humus layer (middle) in the Scots pine and Norway spruce study sites, and the relationship between the humus and needle N concentrations (right). The optimal diagnostic level of needle N concentration is >1.5%.
In the soil organic (humus) layer, the average N concentrations were in the range of 1.12–1.38 and 0.84–0.89% over all fertilization treatments in the Scots pine study sites at Liperi and Ilomantsi, respectively. The corresponding ranges were 0.91–1.18 and 1.24–1.49% for the Norway spruce study sites at Savonranta and Juuka. The N concentration in the humus layer increased from the control to 150 kg N ha–1 and further to the 200 kg N ha–1 fertilization treatment, excluding the Scots pine study site at Ilomantsi. There, the N concentration was slightly higher in the control and 150 kg N ha–1 fertilization treatments. However, there were no statistically significant differences in the N concentration in the humus layer between fertilization treatments.
Both in Scots pine and Norway spruce study sites, there was a clear positive correlation between the measured (block) fertilizer dose and the N concentration in the needles. It was also clearly stronger than between the fertilizer dose and N concentration in the humus layer (Fig. 4). No correlation was found between the fertilizer dose and N concentration in the humus layer in Norway spruce study sites, unlike in Scots pine study sites. However, there was a strong positive correlation between N concentrations in the needles and humus layer both in Norway spruce and Scots pine study sites.
The realized fertilizer dose and the total volume growth over the study period correlated positively in both the Scots pine and Norway spruce study sites (Fig. 5). There was also a positive correlation between the volume growth and the N concentrations in the needles in the Scots pine and Norway spruce study sites (Fig. 5). A positive correlation between volume growth and N concentration in the humus layer was found only in the Norway spruce study sites (Figs. 4 and 5). However, the initial volume also significantly affected the volume growth (Fig. 5).

Fig. 5. Volume growth (ΔV) as a function of fertilizer dose (top left), initial volume of living trees at the end of the study period (top right) and measured concentrations of N in the needles (bottom left) and humus layer (bottom right) in the Scots pine study sites (Liperi and Ilomantsi together) and in the Norway spruce study sites (Savonranta and Juuka together). Data points represent average values from the three circular plots in each block (three replicates per treatment).
4 Discussion and conclusions
The spatial evenness of the fertilization was very good in the Scots pine study sites fertilized by ground spreading. The measured fertilizer dose differed from the target level by less than 10%, on average, excluding the Ilomantsi study site. There, the measured fertilizer dose was 39% higher than the target of 200 kg N ha–1. At the Norway spruce study sites fertilized by aerial spreading, the difference between the measured and target levels was higher, by up to 22%, excluding the Juuka study site. There, the measured fertilizer dose was 49% higher than the target of 150 kg N ha–1. The realized average fertilizer doses for the different fertilization treatments (target levels) differed statistically significantly from each other for all the study sites except Juuka. There, the measured fertilizer dose was, on average, equal for both fertilization treatments, which means a failure in the experimental setup.
During ground spreading, even minor swinging of the ground spreader can significantly affect the spreading evenness (Mäkelä and Mikkola 1987). The stand structure and the spreading method (airplane or helicopter) can affect the spatial evenness of aerial fertilization (Gustavsson 1972). In aerial spreading, the fertilizer granules may bounce off the dense crowns of Norway spruce before reaching the ground, causing spatial heterogeneity. Also, some amount of fertilizer may be retained in the tree crowns (Gustavsson 1972; Tiitinen 2014).
The results for the evenness of the fertilizer in the ground and aerial spreading are not fully comparable because differences in the direction of the fertilizer supply (horizontal versus vertical), stand structure and topography all affect how many fertilizer particles are collected by the textile funnels. We can only see the lumped effect of these factors, which may explain the quite large variation in fertilizer doses between the textile funnels, and between the circular study plots and the blocks. Overall, we used three to six textile funnels in each circular plot and, thus, a total of 9–18 textile funnels in each block (i.e. 27–36 in the fertilization treatments per study site). Issakainen and Moilanen (1981) stated that measuring the aerial spreading evenness requires a large number, at least 30, of textile funnels distributed evenly over the fertilized areas. Our setup revealed a substantial variation in spatial evenness in fertilization from aerial spreading, which can also be seen in the N concentrations in the needles and humus layer (Figs. 4 and 5).
In the Scots pine study sites at Liperi and Ilomantsi, N fertilization increased the average annual volume growth by 0.4–0.8 m3 ha–1 a–1 and 1.5–2.1 m3 ha–1 a–1 over the five growing seasons (four of those fertilized), compared to the unfertilized controls. However, significant differences in volume growth between the control and fertilized treatments were found only at the Ilomantsi study site. That site was also the most potential site for N fertilization in practical forestry in terms of stand development stage (i.e. lower age, smaller Dbh and higher stand density). At the Ilomantsi study site, the initial stand volume was also mostly even, facilitating a more accurate comparison between the fertilization treatments. Also, in previous studies, volume growth responses to N fertilization were higher in younger than in mature stands (Gustavsen and Lipas 1975; Kellomäki 2022).
Similarly to our findings, volume growth responses of 0.75–3.5 m3 ha–1 a–1 to a 150 kg N ha–1 fertilizer dose have been reported previously for Scots pine in Finnish experiments (Kukkola and Saramäki 1983; Saarsalmi and Mälkönen 2001). In Swedish experiments, Pettersson (1994) found volume growth responses of 0.2–2.5 m3 ha–1 a–1 over the 5 years after fertilization with 60–250 kg N ha–1 fertilizer doses for Scots pine stands with a wide range of initial volumes. The volume growth response of Scots pine has been found to be the highest in the third year after fertilization, then diminishing 6–8 years after fertilization (Kukkola and Saramäki 1983). Our data for Scots pine represent only the first four post-fertilization years, and so the volume growth response is likely to persist for a few more years.
In the Norway spruce study sites at Savonranta and Juuka, N fertilization increased the volume growth by 1.8–2.3 and 2.5–2.6 m3 ha–1 a–1, respectively, over four growing seasons (three of them fertilized). These values are in line with those of previous findings for Norway spruce (Pettersson 1994; Ilvesniemi et al. 2023). In the previous studies, the volume growth responses have been in a range of 0.4–3.5 m3 ha–1 a–1 for the first 4–5 years with a fertilizer doses of 60–250 kg N ha–1 for Norway spruce stands with a wide range of initial volumes (Pettersson 1994; Ilvesniemi et al. 2023). At the Juuka study site, there was a greater difference in the initial volume between the control and fertilization treatments than at the Savonranta study site. This may partly explain why the differences in the volume growth between the control and fertilization treatments were not statistically significant. Furthermore, this may also be related to the large within-treatment variation in the realized fertilizer dose (Fig. 2). At the Juuka study site, the 49% larger measured fertilizer dose than the target level of 150 kg ha–1 would explain the equal volume growth responses for these fertilized treatments. Overall, the spatially more uneven spread of fertilizer in the Norway spruce study sites compared to the Scots pine study sites could also partially be the result of the hillier topography at the Juuka and Savonranta study sites.
In previous studies, the volume growth response of Norway spruce stands with an initial volume growth of <7 m3 ha–1 a–1 has been reported to increase linearly with increasing fertilizer dose up to 200 kg N ha–1 (Gustavsen and Lipas 1975; Kukkola and Saramäki 1983). Our study sites were growing well already at the beginning of the experiment, which might have decreased the volume growth response to fertilization at a higher dose (Pettersson 1994). The volume growth response in Norway spruce typically starts with a delay in the second year after fertilization, reaches its peak after 4–5 years, and lasts up to 10 years (Kukkola and Saramäki 1983; Ilvesniemi et al. 2023). Higher fertilizer doses induce a longer-lasting volume growth response (Kukkola and Saramäki 1983). Therefore, we anticipate that the volume growth differences between the fertilizer treatments will increase in the coming years.
We found higher N concentrations in the needles and humus layer in the fertilized treatments than in the control treatment. The measured fertilizer dose and the N concentration in the needles were positively correlated in all the study sites (Fig. 5). The higher the N concentration in the needles, the higher the photosynthetic rate per unit leaf area (Evans 1989). This, together with a higher needle mass, increases the growth rate of trees (Kellomäki and Wang 1997a,b). We found a positive correlation between the volume growth, fertilizer dose and N concentrations in the needles in both the Scots pine and Norway spruce study sites (Fig. 5). We also found a strong positive correlation between N concentrations in the humus layer and the needles in both tree species. The humus layer is an important source of N for tree growth (Laurén et al. 2012). Increasing the N availability in the humus layer through fertilization increases tree growth because most of the fine roots of trees are located there (Kalela 1949; Helmisaari et al. 2007). In the control treatments, the N concentrations in the needles were at a sub-optimal diagnostic level (<1.5%) in the Scots pine study sites compared to the optimal level identified by Reinikainen et al. (1998). Whereas, in the fertilized treatments, they were at the optimal diagnostic level. In the Norway spruce study sites, the N concentrations in the needles remained at sub-optimal diagnostic levels (N < 1.3%) even with fertilization (Fig. 4).
The N fertilization of upland boreal forests offers a rapid way to increase wood production and the forest C sink and thus contribute to the mitigation of climate change. One additional cubic metre of stem wood can sequestrate about 250 kg C (with a wood density of 400 kg m3) in Scots pine and Norway spruce stands, corresponding to around 900 kg of carbon dioxide (CO2) (Väänänen et al. 2023). Additionally, C is stored in the branches, needles and roots. Their proportion is in the range of 30–50% of the whole tree biomass, depending on tree species, forest age and site fertility (Väänänen et al. 2023). Harmful environmental effects may also be kept at tolerable levels through tailored fertilization schemes in which nutrient concentrations match the nutrients needed for forest growth.
Our results represent an important contribution to forest fertilization research because, in previous experiments the fertilizers have been spread manually, resulting in high spatial evenness. We have shown that, in practical forestry, measuring the evenness of the spreading is difficult and the fertilizers seem to be spread unevenly. This uneven spreading is reflected in the spatial heterogeneity of N concentrations in the humus layer and needles, and eventually in the volume growth responses in aerial and ground spreading.
We will continue to monitor the development of the growth responses of the trees, and the factors contributing to these, in these unique fertilization experiments in the coming years. We expect that the differences in tree growth responses between fertilization treatments will increase over time. Future studies should also examine in more detail how to accurately measure the spatial evenness of fertilization and the factors affecting this during the ground and aerial spreading used in practical forestry. This information is necessary to be able to increase the spreading accuracy of fertilizers, and to ensure that the actual fertilizer dose per unit area is in line with the target fertilizer dose in precision forestry.
Declaration of openness of research materials, data, and code
Data (excel file, including separate sheets for metadata description and data) is available through the open research repository: https://doi.org/10.5281/zenodo.11066704.
Authors’ contributions
Conceptualisation (Heli Peltola, Olli Muhonen)
Data curation (Olli-Muhonen, Juha Nevalainen)
Formal analysis (Veli-Pekka Ikonen, Olli Muhonen, Heli Peltola, Laura Pikkarainen, Antti Kilpeläinen, Annamari Lauren, Marjo Palviainen)
Funding acquisition (Heli Peltola, Marjo Palviainen, Samuli Launiainen)
Investigation (Olli Muhonen, Heli Peltola, Annamari Laurén, Marjo Palviainen)
Methodology (Olli Muhonen, Heli Peltola, Annamari Laurén, Marjo Palviainen)
Project administration (Heli Peltola, Marjo Palviainen)
Resources (Heli Peltola, Marjo Palviainen)
Visualisation (Veli-Pekka Ikonen)
Writing – original draft (Olli Muhonen, Heli Peltola, Laura Pikkarainen, Annamari Laurén, Marjo Palviainen)
Writing – review and editing (All)
Acknowledgements
Jarmo Pennala and Risto Ikonen are thanked for assisting with the diverse field measurements and Johanna Jetsonen for participating in collecting the soil samples. Maini Mononen and Leena Kuusisto are thanked for assisting with the laboratory analyses at the School of Forest Sciences, University of Eastern Finland. Tornator, Yara, ForestVital, the University of Eastern Finland and the Research Council of Finland (formerly Academy of Finland) are acknowledged for their support in establishing these fertilization experiments. The text has been improved using proofreading services offered by Cambridge Proofreading LLC.
Funding
This research was funded by the Strategic Research Council of the Academy of Finland through the SRC FORBIO project (decision number 314224), and by the Research Council of Finland through the PREFER project (decision numbers 348096, 348102 and 348103) and the UNITE flagship (decision numbers 337127, 357906 and 359172).
References
Äijälä O, Koistinen A, Sved J, Vanhatalo K, Väisänen P (2019) Metsänhoidon suositukset. [Finnish forest management recommendations]. Metsätalouden kehittämiskeskus Tapion julkaisuja. ISBN 978-952-5632-75-0.
Armson KA (1972) Fertilizer distribution and sampling techniques in the aerial fertilization of forests. Fac For Univ Toronto Tech Rep 11: 1–27.
Ballard R, Will GM (1970) Distribution of aerially applied fertiliser in New Zealand forests. NZ J For Sci 1: 50–59.
Bergh J, Nilsson U, Allen HL, Johansson U, Fahlvik N (2014) Long-term responses of Scots pine and Norway spruce stands in Sweden to repeated fertilization and thinning. For Ecol Manag 320: 118–128. https://doi.org/10.1016/j.foreco.2014.02.016.
Bonner MTL, Castro D, Schneider AD, Sundström G, Hurry V, Street NR, Näsholm T (2019) Why does nitrogen addition to forest soils inhibit decomposition? Soil Biol Biochem 137, article id 107570. https://doi.org/10.1016/j.soilbio.2019.107570.
Cajander AK (1949) Forest types and their significance. Acta For Fenn 56: 1–72. https://doi.org/10.14214/aff.7396.
Coucheney E, Strömgren M, Lerch TZ, Herrmann AM (2013) Long-term fertilization of a boreal Norway spruce forest increases the temperature sensitivity of soil organic carbon mineralization. Ecol Evol 3: 5177–5188. https://doi.org/10.1002/ece3.895.
Evans JR (1989) Photosynthesis and nitrogen relationships in leaves of C3 plants. Oecologia 78: 9–19. https://doi.org/10.1007/BF00377192.
Finnish Meteorological Institute (2023) Open data – Finnish Meteorological Institute. https://en.ilmatieteenlaitos.fi/open-data. Accessed 27 February 2023.
Gustavsen H, Lipas E (1975) Effect of nitrogen dosage on fertilizer response. Folia For 246. http://urn.fi/URN:ISBN:951-40-0188-5.
Gustavsson R (1972) Faktorer som påverkar spridningresultattett vid skogsgödsling. [Factors affecting spreading results in forest fertilizing]. Skogshögskolan Inst F skogsteknik.
Håkansson C, Hedwall PO, Strömgren M, Axelsson M, Bergh J (2021) Effects of fertilization on soil CH4 and N2O fluxes in young Norway spruce stands. Forest Ecol Manag 499, article id 119610. https://doi.org/10.1016/j.foreco.2021.119610.
Hanssen KJ, Asplund J, Clarke N, Selmer R, Nybakken L (2020) Fertilization of Norway spruce forest with wood ash and nitrogen affected both tree growth and composition of chemical defence. Forestry 93: 589–600. https://doi.org/10.1093/forestry/cpz078.
Hedwall PO, Gong P, Ingerslev M, Bergh J (2014) Fertilization in northern forests – biological, economic and environmental constraints and possibilities. Scand J Forest Res 29: 301–311. https://doi.org/10.1080/02827581.2014.926096.
Helmisaari H-S, Derome J, Nöjd P, Kukkola M (2007) Fine root biomass in relation to site and stand characteristics in Norway spruce and Scots pine stands. Tree Physiol 27: 1493–1504. https://doi.org/10.1093/treephys/27.10.1493.
Högberg P (2007) Nitrogen impacts on forest carbon. Nature 447: 781–782. http://doi.org/10.1038-/447781.
Hyvönen R, Persson T, Andersson S, Olsson B, Ågren GI, Linder S (2008) Impact of long-term nitrogen addition on carbon stocks in trees and soils in Northern Europe. Biogeochem 89: 121–137. https://doi.org/10.1007/s10533-007-9121-3.
Ilvesniemi H, Lehto T, Smolander A, Salminen H, Kukkola M (2023) Puuston kasvuvasteet kivennäismailla. [Tree growth responses in mineral soils]. In: Lehto T, Ilvesniemi H (eds) Metsänlannoitus nyt ja tulevaisuudessa: synteesiraportti. Luonnonvara- ja biotalouden tutkimus 56/2023. Luonnonvarakeskus, Helsinki, pp 71–75. http://urn.fi/URN:ISBN:978-952-380-714-3.
Issakainen J, Moilanen M (1981) Lentolannoituksen levitystasaisuudesta ja työjäljen valvontamenetelmän kehittämisestä [Spreading evenness of aerial fertilization and development of work quality assessment]. Metsäntutkimuslaitoksen tiedonantoja 17: 1–20. http://urn.fi/URN:NBN:fi-metla-201207201907.
Jaakkola T, Mäkinen H, Saranpää P (2006) Wood density of Norway spruce: responses to timing and intensity of first commercial thinning and fertilisation. For Ecol Manag 237: 513–521. https://doi.org/10.1016/j.foreco.2006.09.083.
Janssens I, Dieleman W, Luyssaert S, Subke J-A, Reichstein M, Ceulemans R, Ciais P, Dolman AJ, Grace J, Matteucci G, Papale D, Piao SL, Schulze E-D, Tang J, Law BE (2010) Reduction of forest soil respiration in response to nitrogen deposition. Nat Geosci 3: 315–322. https://doi.org/10.1038/ngeo844.
Jetsonen J, Laurén A, Peltola H, Muhonen O, Nevalainen J, Ikonen V-P, Kilpeläinen A, Tuittila E-S, Männistö E, Kokkonen N, Palviainen M (2023) Effects of nitrogen fertilization on the ground vegetation cover and soil chemical properties in Scots pine and Norway spruce stands. Silva Fenn 58, article id 23058. https://doi.org/10.14214/sf.23058.
Jörgensen K, Granath G, Lindahl BD, Strengbom J (2021) Forest management to increase carbon sequestration in boreal Pinus sylvestris forests. Plant Soil 466: 165–178. https://doi.org/10.1007/s11104-021-05038-0.
Kalela E (1949) On the horizontal roots in pine and spruce stands I. Acta Forest Fenn 57: 1–79. https://doi.org/10.14214/aff.7397.
Kellomäki S (2022) Fertilization in management of site fertility. In: Kellomäki S (ed) Management of boreal forests: theories and applications for ecosystem services. Springer, Berlin, pp 437–464. https://doi.org/10.1007/978-3-030-88024-8_14.
Kellomäki S, Wang K-Y (1997a) Effects of long-term CO2 and temperature elevation on crown nitrogen distribution and daily photosynthetic performance of Scots pine. For Ecol Manag 99: 309–326. https://doi.org/10.1016/S0378-1127(97)00059-5.
Kellomäki S, Wang K-Y (1997b) Photosynthetic responses of Scots pine to elevated CO2 and nitrogen supply: results of a branch-in-bag experiment. Tree Physiol 17: 231–240. https://doi.org/10.1093/treephys/17.4.231.
Kukkola M, Saramäki J (1983) Growth response in repeatedly fertilized pine and spruce stands on mineral soils. Commun Inst For Fenn 114: 1–55. http://urn.fi/URN:ISBN:951-40-0622-4.
Laasasenaho J (1982) Taper curve and volume functions for pine, spruce and birch. Commun Inst For Fenn 108: 1–74. http://urn.fi/URN:ISBN:951-40-0589-9.
Laurén A, Lappalainen M, Saari P, Kukkonen JVK, Koivusalo H, Piirainen S, Setälä H, Sarjala T, Bylund D, Heinonen J, Nieminen M, Palviainen M, Finér L (2012) Nitrogen and carbon dynamics and the role of enchytraeid worms in decomposition of L, F and H layers of boreal mor. Water Air Soil Pollut 223: 3701–3719. https://doi.org/10.1007/s11270-012-1142-4.
Mäkelä J, Mikkola H (1987) Lannoitteen levityksen tasaisuus. [Fertilizer spreading evenness]. State Research Institute of Engineering in Agriculture and Forestry 47.
Mäkinen H, Hynynen J (2014) Wood density and tracheid properties of Scots pine: responses to repeated fertilization and timing of the first commercial thinning. Forestry 87: 437–447. https://doi.org/10.1093/forestry/cpu004.
Mäkipää R (1995) Effect of nitrogen input on carbon accumulation of boreal forest soils and ground vegetation. Forest Ecol Manag 79: 217–226. https://doi.org/10.1016/0378-1127(95)03601-6.
Maljanen M, Liimatainen M, Hytönen J, Martikainen PJ (2014) The effect of granulated wood-ash fertilization on soil properties and greenhouse gas (GHG) emissions in boreal peatland forests. Bor Environ Res 19: 295–309.
Marshall J, Peichl M, Tarvainen L, Lim H, Lundmark T, Näsholm T, Öquist M, Linder S (2021) A carbon-budget approach shows that reduced decomposition causes the nitrogen-induced increase in soil carbon in a boreal forest. Forest Ecol Manag 502, article id 119750. https://doi.org/10.1016/j.foreco.2021.119750.
Nilsen P (2001) Fertilization experiments on forest mineral soils: a review of the Norwegian results. Scand J For Res 16: 541–554. https://doi.org/10.1080/02827580152699376.
Nohrsted H-Ö (2001) Response of coniferous forest ecosystems on mineral soils to nutrient additions: a review of Swedish experiences. Scand J For Res 16: 555–573. https://doi.org/10.1080/02827580152699385.
Olsson P, Linder S, Giesler R, Högberg P (2005) Fertilization of boreal forest reduces both autotrophic and heterotrophic soil respiration. Global Change Biol 11: 1–9. https://doi.org/10.1111/j.1365-2486.2005.001033.x.
Paavilainen E, Virtanen J (1977) Effects of spreading method on forest fertilization results. Folia For 297: 1–15. http://urn.fi/URN:ISBN:951-40-0258-x.
Pettersson F (1994) Predictive functions for impact of nitrogen fertilization on growth over five years. The Forestry Research Institute of Sweden, Report 3.
Pettersson F, Högbom L (2004) Long-term growth effects following forest nitrogen fertilization in Pinus sylvestris and Picea abies stands in Sweden. Scand J Forest Res 19: 339–347. https://doi.org/10.1080/02827580410030136.
Reinikainen A, Veijalainen H, Nousiainen H (1998) Puiden ravinnepuutokset – metsänkasvattajan ravinneopas. [Nutrient deficiency in trees – guide for forest owner]. Metsäntutkimuslaitoksen tiedonantoja 688: 1–44. http://urn.fi/URN:ISBN:951-40-1629-7.
Saarsalmi A, Mälkönen E (2001) Forest fertilization research in Finland: a literature review. Scand J For Res 16: 514–535. https://doi.org/10.1080/02827580152699358.
Strengbom J, Nordin A (2008) Commercial forest fertilization causes long-term residual effects in ground vegetation of boreal forests. For Ecol Manag 256: 2175–2181. https://doi.org/10.1016/j.foreco.2008.08.009.
Tiitinen J (2014) Lannoitustasaisuus Metsähallituksen kangasmaiden lentolannoituksilla 2000-luvulla. [Spreading evenness in aerial fertilization at Metsähallitus in the 2000s]. Tampereen ammattikorkeakoulu.
Väänänen P, Smolander A, Ilvesniemi H, Laiho R, Lehto T (2023) Vaikutukset hiilinieluun. [Impacts to carbon sinks]. In: Lehto T, Ilvesniemi H (eds) Metsänlannoitus nyt ja tulevaisuudessa: Synteesiraportti. Luonnonvara- ja biotalouden tutkimus 56/2023. Luonnonvarakeskus, Helsinki, pp 62–67. http://urn.fi/URN:ISBN:978-952-380-714-3.
Virtanen J (1975) Lannoitustasaisuus metsänlannoituksessa. [Spreading evenness in forest fertilization]. Commun Inst For Fenn 86: 1–35. http://urn.fi/URN:ISBN:951-40-0169-9.
Total of 47 references.
