Yrjö Nuutinen  ,
Jari Miina,
Timo Saksa,
Dan Bergström,
Johanna Routa
,
Jari Miina,
Timo Saksa,
Dan Bergström,
Johanna Routa
Comparing the characteristics of boom-corridor and selectively thinned stands of Scots pine and birch
Nuutinen Y., Miina J., Saksa T., Bergström D., Routa J. (2021). Comparing the characteristics of boom-corridor and selectively thinned stands of Scots pine and birch. Silva Fennica vol. 55 no. 3 article id 10462. https://doi.org/10.14214/sf.10462
Highlights
- After boom-corridor thinning (BCT), the number of stems per hectare was higher than that after selective thinning. The number of future crop trees was at the same level
- The removal of the simulated intermediate thinnings and clearcutting in BCT treatments was 10–18% higher than in selective thinning. The saw log volumes were at the same level in both treatments.
Abstract
Young, dense forest in Finland and Sweden urgently need to receive first thinning. In such stands, conventional selective thinning methods make the harvester work time consuming and, thus, costly. To make small-sized trees economically competitive as raw material for bioenergy and biorefining, new harvesting technologies and/or thinning methods need to be developed. A potential solution is boom-corridor thinning (BCT), rendering effective cutting work. The aim of this study was to describe and compare the stand structure of two Scots pine stands (Pinus sylvestris L.) and one birch-dominated (Betula pendula Roth with natural downy birch, B. pubescens Ehrh.) stand after BCT and selective thinning at the first thinning phase. Furthermore, simulations were conducted to predict the future stand development after the first thinning treatments. The density of the growing stock was 16–46% higher after BCT treatment than after selective thinning because BCT stands included more small and supressed trees with a dbh < 100 mm. However, the numbers of future crop trees with a dbh > 140 mm per hectare were at the same level in both treatments. The stem volume removal per hectare did not differ between treatments. However, simulation of stand development and intermediate thinning and clearcutting revealed that the total removal volume was 10–18% higher in BCT stands compared to selectively thinned ones. The saw log volumes harvested did, however, not differ between treatments. This study shows that BCT generates stands with higher biodiversity compared to conventional thinning as higher levels of biomass removal can be reached throughout stand rotations.
Keywords
biomass;
forestry;
first thinning;
geometrical thinning;
systematic thinning
-
Nuutinen,
Natural Resources Institute Finland (Luke), Production systems, P.O. Box 68, FI-80101 Joensuu, Finland
E-mail
yrjo.nuutinen@luke.fi
- Miina, Natural Resources Institute Finland (Luke), Natural resources, P.O. Box 68, FI-80101 Joensuu, Finland E-mail jari.miina@luke.fi
- Saksa, Natural Resources Institute Finland (Luke), Natural resources, FI-77600 Suonenjoki, Finland E-mail timo.saksa@luke.fi
- Bergström, Swedish University of Agricultural Sciences (SLU), Dept of Forest Biomaterials and Technology, Section of Forest Operations, SE-90183 Umeå, Sweden E-mail dan.bergstrom@slu.se
- Routa, Natural Resources Institute Finland (Luke), Production systems, P.O. Box 68, FI-80101 Joensuu, Finland E-mail johanna.routa@luke.fi
Received 25 October 2020 Accepted 30 May 2021 Published 16 June 2021
Views 84359
Available at https://doi.org/10.14214/sf.10462 | Download PDF

Corrections
1 Introduction
In Finland, according to National Forest Inventory data, there is an urgent need for the first commercial thinning of at least 0.8 million ha and 0.5 million ha of young small-diameter energy wood forest stands (Korhonen et al. 2017). In Sweden, 16.4% (3.7 million ha) of the total productive forest land is classified as young forest stands characterised by a mean height above 1.3 m, with a high share of dominant trees with a diameter at breast height (dbh) below 10 cm (Skogsdata 2019). Thus, these forests will also have to be managed in the near future. In the Nordic countries, forests are usually thinned using selective thinning from below, where, primarily, the smallest, poorer and possibly damaged trees are removed (Mielikäinen et al. 1991; Mäkinen et al. 2006; Karlsson et al. 2012; Niemistö et al. 2018). Due to the high cost and low income associated with the first thinning, there is little motivation for forest owners to conduct the first thinning. Based on previous studies (Kuitto et al. 1994; Sirén 1998; Ryynänen and Rönkkö 2001; Kärhä et al. 2001, 2004; Oikari et al. 2008; Brunberg and Iwarsson-Wide 2013), small stem size, low removal per hectare, high number of remaining trees and dense undergrowth mean low harvester productivity and high harvesting costs. Nowadays, almost all forest cutting in Finland and Sweden is mechanised (Strandström 2018; Skogsdata 2019). Harvester operations are especially challenging and slow in unmanaged, dense young stands where pre-commercial thinning has been neglected. In addition, the lack of experienced forest machine operators is a restricting factor due to the high seasonality of harvests. To make small-sized trees economically competitive as raw material for bioenergy and biorefining, the costs of harvesting in young forest stands must be reduced, and the biomass yield per hectare must be high (Hakkila 2005). Instead of using the current method of selective thinning, there is a clear need to develop more cost-efficient, small-sized tree harvesting methods for unmanaged young stands (Bergström et al. 2010; Sängstuvall et al. 2011; Bergström and Di Fulvio 2014; Läspä and Nurmi 2018).
Depending on the main tree species, stand density and site type, the first commercial thinning is usually carried out in stands with a dominant height of 12–15 m (Äijälä et al. 2019). Precommercial thinning and first commercial thinning are the most important silvicultural operations, since their timing and intensity strongly affect the further development (e.g., structure, quality, growth) of the forest stand (Niemistö et al. 2018). Overall, young forests account for a substantial proportion of the boreal forest, and today’s management decisions regarding these forests will lay the foundation for future forestry (Witzell et al. 2019).
The cost-efficiency of harvesting small-diameter trees can be increased by improving harvesting conditions (e.g., delaying first thinning and preclearance of dense undergrowth), rationalising harvesting methods (e.g., integrated pulpwood and energy wood harvesting), training forest machine operators and by machine innovations and novel harvesting methods. So far, in the Nordic countries, the most successful technological innovation for small-diameter wood thinning has been multi-tree harvesting with a harvester and hauling the cut tree with a forwarder to a roadside storage area (Kärhä et al. 2005; Iwarsson Wide 2010). However, in these countries, the increasing productivity trend in timber harvesting has stopped throughout the 21st century (Luonnonvarakeskus 2019). In harvester work studies, there are up to 40% differences in productivity between experienced and inexperienced operators (Siren 1998; Ryynänen and Rönkkö 2001; Kariniemi 2006). These differences become even more pronounced as working conditions become more difficult (Ovaskainen et al. 2004; Väätäinen et al. 2005). Developing the harvester head technology alone is unlikely to provide sufficient cost savings.
A possible cost-efficient alternative for the future could be to develop systematic thinning methods, where trees are harvested in corridors, lines, rows or strips (Rummer 1993; Suadicani and Nordfjell 2003). The boom-corridor thinning (BCT) method in young stands is one kind of mechanised systematic thinning method (Bergström 2009; Sängstuvall et al. 2011; Jundén et al. 2013). In BCT, trees are harvested in corridors that are a few meters wide, aligned with the strip-road and at a length corresponding to the used crane’s reach (about 10 m). Several studies have stated that BCT is a potential harvesting operation method that allows for the flexible use of different thinning patterns (Bergström et al. 2007, 2010; Bergström and Di Fulvio 2014; Ahnlund Ulvcrona et al. 2017).
Ahnlund Ulvcrona et al. (2017) compared stand structures after BCT and selective thinning and showed that both treatments resulted in similar stand structures based on the number of possible future crop trees (>80 mm in diameter at breast height). However, BCT maintained a higher diversity of tree sizes as well as more stems per hectare, including deciduous species, than the selective thinning approaches. Witzell et al. (2019) concluded that BCT may enable the early outtake of forest biomass for e.g. bioenergy or biorefining, while simultaneously maintaining the stand structure’s vertical heterogeneity and thereby supporting biodiversity.
Systematic thinning results in reduced growth (volume and/or basal area) in Scots pine (Bucht and Elfving 1977; Pettersson 1986; Mäkinen et al. 2006) and Norway spruce stands (Mäkinen et al. 2006) as compared to selective thinning. Bucht (1981) identified two growth-reducing factors associated with corridor harvests: the area effect, where increment losses are due to the unexploited corridor area, and the selectivity effect, where losses are associated with not retaining the most vigorous and fastest growing trees in the stand. The effect of corridors on the growth of trees was investigated by Mäkinen et al. (2006). Five years after thinning, in both pine and spruce stands, tree growth had improved along the corridors only in a zone within less than 2 meters away from the corridors. However, the increase in growth of the edge trees of the 4–5 m-wide corridors compensated for 40% of the loss of growth caused by the area effect of the corridors. Karlsson et al. (2015) concluded that high biomass removal from dense Scots pine stands early in rotation periods, for example by applying BCT methods, might provide substantial economic benefits for forest owners, but appropriate general decision tools are needed to maximise profit. Besides increasing the growth of remaining trees, selective (quality) thinning is aimed at improving stem quality by removing low-quality stems, especially in Scots pine stands where straight stems with small branches and vital crowns are left to grow (Niemistö et al. 2018). Strictly performed systematic corridor harvests are done without tree selection, and thus, also low-quality stems are retained on untreated areas between corridors. However, tree selection can be performed with some degree of selectivity when performing boom-corridor thinning (semi-selective BCT), (cf Ahnlund Ulvcrona et al. 2017).
The spatial distribution of the remaining trees after BCT differs from that after a selective thinning. Thus, it is important that after BCT, there is a sufficient number of trees that are both suitable for use as future crop trees and are well-distributed over the area. In pine stands, high-quality crop trees are slightly smaller than the dominant ones; these so-called “codominant trees” with narrow crowns and thin branches are usually the best quality stems of a stand (Lämsä et al. 1990; Huuskonen et al. 2014).
The aim of this study was to describe and compare the stand characteristics and spatial patterns of Scots pine and birch-dominated stands after boom-corridor and selective thinning at the first thinning phase. The hypothesis of our study was that there are no major differences between the volume of removal per hectare of the studied treatments. In the future, the thinning experiments established in this study will be assessed for long-term growth and timber quality effects. Simulations have been conducted to predict the future development of the experimental plots in Scots pine stands, using a distance-dependent stand growth simulator. In the simulations, stand management followed the silvicultural recommendations applied in privately owned forests in Finland (Äijälä et al. 2019).
2 Material and methods
2.1 Description of sites and treatments
The thinning treatments were established in a direct-seeded Scots pine (Pinus sylvestris L.) stand in Suonenjoki (seeded pine stand) (62°38´N, 27°31´E), Northern Savo, in a planted pine stand in Konnevesi (planted pine stand) (62°46´N, 26°17´E), Central Finland, and in a planted silver birch (Betula pendula Roth mixed with natural downy birch, B. pubescens Ehrh.) stand in Kontiolahti (planted birch stand) (62°42´N, 29°55´E), North Karelia. According to the Finnish site type classification (Cajander 1949), the pine stands were growing on a medium fertile site (Myrtillus type) in the planted pine stand and on a rather poor site (Vaccinium type) in the seeded pine stand. The planted birch stand was growing on a fertile site (Oxalis-Myrtillus type). At the time of measurement, the ages of the pine stands were 35 and 24 years in the seeded pine stand and the planted pine stand, respectively. The planted birch stand was 25 years old.
The experiment in the seeded pine stand was established in May 2018 and in the planted pine stand and planted birch stand in September 2018. In each stand, the thinning treatments were performed on rectangular plots of 20 × 50 m (1000 m2), except for two plots in the planted pine stand of 20 × 40 m and 20 × 43 m (Table 1). Prior to treatments, the characteristics of the growing stock were measured on two rectangular sample plots of 5 × 20 m (100 m2) systematically located on each treatment plot. All trees on these sample plots were measured in terms of tree species and dbh (mm); for every fourth tree, heigh (dm) was measured.
| Table 1. Stand characteristics before selective (Sel) and boom-corridor (BCT) thinning treatments. Dbh = diameter at breast height (1.3 m). The thinning treatments are described in Table 2. View in new window/tab. |
Before thinning, the seeded pine stand had a typical even-aged and single-canopy-layer structure without significant undergrowth (dbh < 70 mm), and the proportion of the basal area of pine was over 90% (Table 1). In the planted pine stand, the proportion of pine, by number, was 81%, and the remaining tree species were mainly birch. The sparse birch undergrowth in this area did not hinder the harvester work. Based on one-way analysis of variance, no statistically significant differences in pre-treatment stand variables were found, although in the planted birch stand, the stand basal area and volume were higher on the selective thinning plots than on BCT plots (Table 1). The proportion of the trees with a dbh of 100–160 mm varied from 59 to 71% in the seeded pine stand, from 59 to 70% in the planted pine stand and from 40 to 50% in the planted birch stand.
The selective and BCT treatments applied in the experiments are described in Table 2. The thinning treatments for the experiments were carried out in the following chronological order:
- Seeded pine stand: Sel1, BCTp, BCTf, BCTsemi1
- Planted pine stand: Sel1, BCTsemi1, BCTsel
- Planted birch stand: Sel2, BCTsemi2, BCTsemi3
| Table 2. Definitions of thinning treatments in the experiments. In all treatments, the width of the strip road was between 4.0–4.5 m, and the strip roads were pre-marked in the centre of the plot. In selective thinning (Sel) treatments, the areas between strip roads were thinned from below, where primarily, the smallest, poorer and possibly damaged trees were removed. In systematic boom-corridor (BCTp, BCTf) treatments, 2.5-m-wide corridors, with 7 m between the machine position, were harvested. In all BCT treatments, the areas between the corridors were left untreated. | |
| Treatment | Definition |
| Sel1 | Selective thinning. Pre-clearing of undergrowth was not needed. |
| Sel2 | Selective thinning, pre-cleared. The undergrowth hindering harvester work was removed before test cutting. |
| BCTp | Completely systematic perpendicular boom-corridor thinning. Pre-clearing of undergrowth was not needed. Corridors 90o from each machine position were harvested. The trees to be removed from the corridors were marked with a sign. |
| BCTf | Completely systematic fan-shaped boom-corridor thinning. Pre-clearing of undergrowth was not needed. Corridors 30o from each machine position were harvested. The opposite corridors of the machine positions were staggered at 2 m. The trees to be removed from the corridors were marked with a sign. |
| BCTsemi1 | Semi-selective boom-corridor thinning. Pre-clearing of undergrowth was not needed. In the middle of the plot, the advisory corridor locations on opposite sides of the strip road were marked. The width and distance of the corridors were, on average, the same as in BCTp and BCTf. The operator chose the exact location of the corridors based on the standing trees. The trees to be removed from the corridors were not marked. |
| BCTsemi2 | Semi-selective boom-corridor thinning, pre-cleared. The undergrowth hindering harvester work was removed before test cutting. In the middle of the plot, the advisory corridor locations on opposite sides of the strip road were marked. The width and distance of the corridors were, on average, the same as in BCTp and BCTf. The operator chose the exact location of the corridors based on the standing trees. The trees to be removed from the corridors were not marked. |
| BCTsemi3 | Semi-selective boom-corridor thinning, pre-cleared. The undergrowth hindering harvester work was removed before test cutting. In the middle of the plot, the advisory corridor locations on opposite sides of the strip road were marked. The width and distance of the corridors were, on average, the same as in BCTp and BCTf. The operator chose the exact location of the corridors based on the standing trees. The trees to be removed from the corridors were not marked. |
| BCTsel | Selective boom-corridor thinning. Pre-clearing of undergrowth was not needed. The width and distance of the corridors were, on average, the same as in BCTp and BCTf. The operator independently chose the location of the corridors based on the standing trees. |
After thinning, all remaining trees were mapped and measured by species and dbh. The Cartesian coordinates of trees were determined by a distance from a reference point and an angle from a reference direction (north) (Fig. 1).
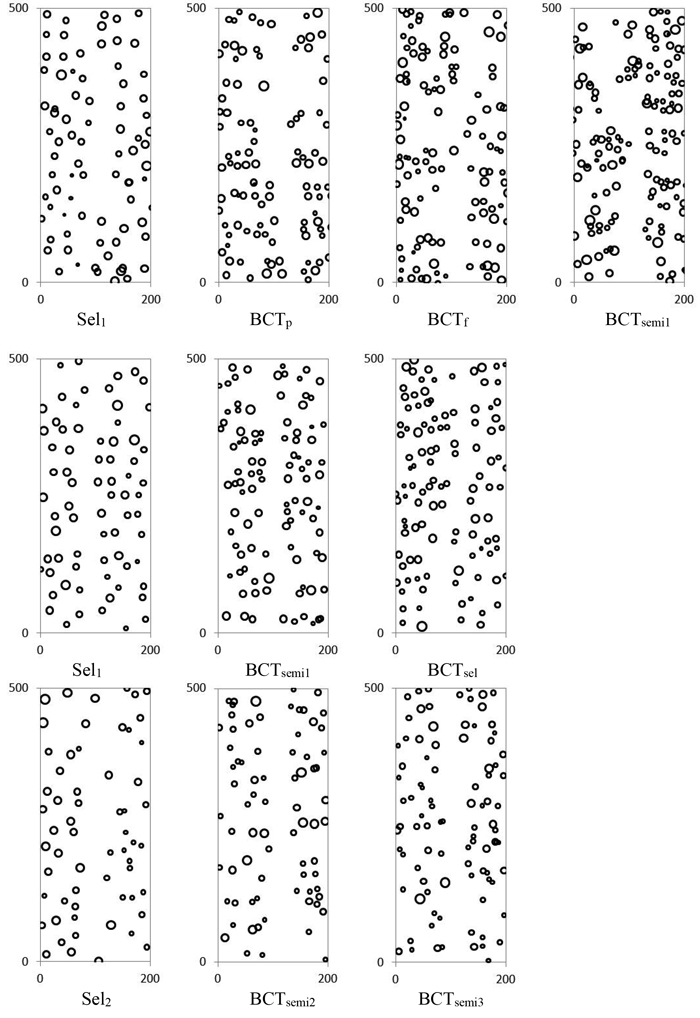
Fig. 1. Examples of tree maps of plots on which selective (Sel) and boom-corridor (BCT) thinning treatments were performed in the pine stands in the seeded pine stand (top) and planted pine stand (middle) and in the planted birch stand (down). The strip road was placed approximately in the middle of the shorter sides of the plot. The width of the circle is proportional to the tree diameter at breast height. The thinning treatments are described in Table 2.
2.2 Methods
Species- and stand-wise models were used to predict the unmeasured tree heights. The type of the height model was Näslund’s (1936) curve: h = 1.3 + dbh2/(a + bdbh)2, where h is tree height (m), dbh is diameter at breast height (cm) and a and b are parameters to be estimated. The height models were fitted separately for Scots pine, Norway spruce (Picea abies (L.) H. Karst.) and birch for each experiment (stand). In the seeded pine stand, no observations on birch height were available, and thus, the height model for pine was applied to predict the heights of birches (11 trees). In the planted birch stand, a common model was fitted for pines and spruces due to the few species-wise observations. The non-linear height models were fitted by the NLR procedure in IBM SPSS Statistics 25 (IBM Corp. Released 2017). Stem volumes were calculated by species-wise volume functions (Laasasenaho 1982) based on dbh and height. Stand characteristics, such as the number of stems per hectare, stand basal area, volume, mean diameter, height, stem volume as well as tree species proportions, were calculated for each treatment plot both before and after thinning. The stand characteristics and diameter distributions were compared among the boom-corridor and selective thinning treatments.
The effect of thinning treatments on the spatial distribution of remaining trees was also studied. The clustering or regularity of the locations of trees after thinning was examined by the Clark-Evans test (Clark and Evans 1954). The test of aggregation for a spatial point pattern of trees was performed with the statistical software R version 3.5.2 by using the Clark-Evans test function in the package statspat (R Core Team 2018). The Clark-Evans index R is the average of the nearest-neighbour distances for randomly sampled points divided by the expected distance to the nearest neighbour under a Poisson (random) process. The index R is dimensionless; the value R = 1 indicates a completely random pattern, R > 1 suggests regularity and R < 1 clustering. The null hypothesis of complete spatial randomness at the 0.05 level was tested by using Monte Carlo simulation, Donnelly edge correction and a two-sided test.
After the treatments, simulations were conducted to predict the future development of the trees on the treatment plots in the seeded pine stand and planted pine stand, using a distance-dependent stand growth simulator (Pukkala et al. 1998). The diameter and height increments of pines and spruces were predicted by using the models of Pukkala et al. (1998). A distance-dependent growth model was not available for birch, and thus, the development and management of the planted birch stand was not simulated. A birch mixture in the simulations of pine stands was considered as pines.
In the simulations, stand management (the number, timing and intensity of thinnings and rotation length) followed the silvicultural recommendations applied in privately owned forests in Finland (Äijälä et al. 2019). Removed trees were divided into timber assortments by using the taper curve functions from Laasasenaho (1982). The minimum top diameter of saw logs was 17 cm for pine and 18 cm for spruce, and that of pulpwood was 8 cm. No deductions due to defects were made, i.e., the timber assortment volumes were based on tree dimensions only.
The statistical significance of the differences between the thinning treatments in the measured stand characteristics (both before and after thinning) and simulated removals was studied using one-way analysis of variance (IBM Corp. Released 2017). Pairwise multiple comparisons between the thinning treatments were performed using the LSD (least significant difference) Post Hoc test because the data were homogeneous (according to the Levene’s test of homogeneity of variances). If the level of significance of a statistical analysis was less than 0.05, the difference was considered significant.
3 Results
3.1 Stand structure after thinning
After the thinning of the seeded pine stand, the proportion of trees with a dbh of 100–160 mm was on average 74% (522 stems per hectare) in selective thinning (Sel1). In boom-corridor thinning BCTp, it was 64% (582 stems per hectare), in BCTf 71% (686 stems per hectare) and in BCTsemi1 59% (582 stems per hectare). Respectively, the proportions of trees with a dbh of 60–100 mm were 3, 15, 12 and 17% (Fig. 2).
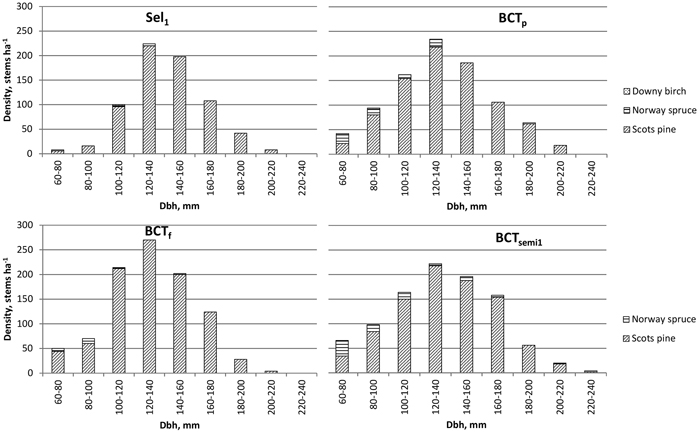
Fig. 2. Average diameter distribution of remaining trees on all plots after selective (Sel) and boom-corridor (BCT) thinning treatments in the pine stand in the seeded pine stand. The thinning treatments are defined in Table 2. View larger in new window/tab.
In the planted pine stand, the proportion of trees with a dbh of 100–160 mm in Sel1 was on average 61% (498 stems per hectare), in BCTsemi1 60% (585 stems per hectare) and in BCTsel 58% (538 stems per hectare). Respectively, the proportions of trees with a dbh of 60–100 mm were 10, 15 and 17%. (Fig. 3).
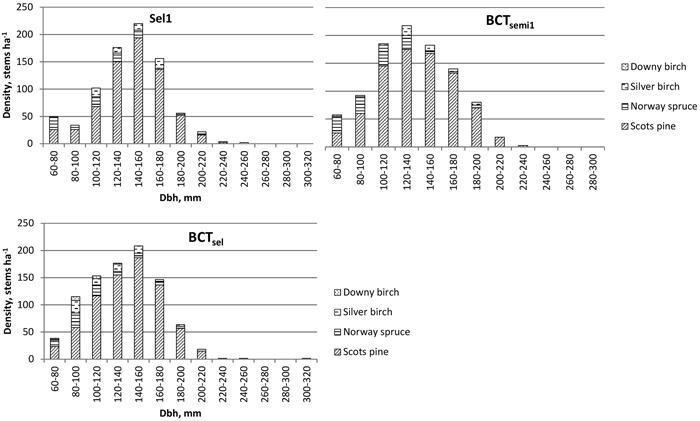
Fig. 3. Average diameter distribution of remaining trees on all plots after selective (Sel) and boom-corridor (BCT) thinning treatments in the pine stand in the planted pine stand. The thinning treatments are defined in Table 2. View larger in new window/tab.
In the planted birch stand, the proportion of trees with a dbh of 100–160 mm in Sel2 was on average 71% (416 stems per hectare), in BCTsemi2 50% (400 stems per hectare) and in BCTsemi3 47% (410 stems per hectare). Respectively, the proportions of trees with a dbh of 60–100 mm were 16, 44 and 48% (Fig. 4).
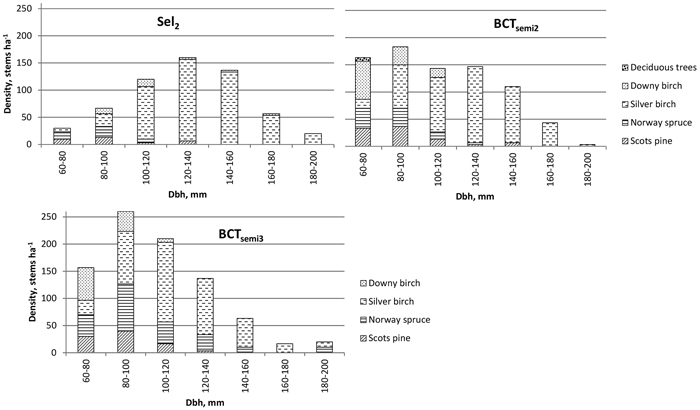
Fig. 4. Average diameter distribution of remaining trees on all plots after selective (Sel) and boom-corridor (BCT) thinning treatments in the birch stand in the planted birch stand. The thinning treatments are defined in Table 2. View larger in new window/tab.
In the seeded pine stand and planted pine stand experiments, in BCT and selective thinning treatments, the number and proportion of remaining dominant trees with a dbh of 140 mm or more were, on average, 410 and 43% and 408 and 53% stems per ha, respectively (Figs. 2 and 4). In the planted birch stand experiment, in BCT and selective thinning treatments, the number and proportion of remaining dominant trees with a dbh of 140 mm or more were, on average 201 and 25% and 213 and 36%, respectively (Fig. 4).
Compared to selective thinning, there were significant differences (p < 0.05) in the stand characteristics of boom-corridor thinned plots (Table 3). For example, the BCTs resulted in, on average, a 16–46% higher number of stems per ha compared to selective thinning. In theseeded pine stand, the stand basal area and volume after boom-corridor treatments were significantly higher than those after selective thinning. In the birch stand, the mean diameter and volume of remaining trees were significantly higher on selectively thinned plots that on boom-corridor thinned plots.
| Table 3. Stand characteristics after selective (Sel) and boom-corridor (BCT) thinning treatments. Dbh = diameter at breast height (1.3 m). The thinning treatments are described in Table 2. View in new window/tab. |
For each experiment, the spatial distribution of trees after selective thinning was regular, i.e., the Clark-Evans index R was significantly (p < 0.05) greater than 1 (Table 4). After BCT, the regular spatial distribution of trees was also observed, but most commonly, the spatial pattern of trees was random. The locations of removed trees were not measured, and thus, the pre-treatment spatial distribution of trees is unknown.
| Table 4. Clark-Evans index R and a two-sided test on the clustering (R < 1) or regularity (R > 1; p < 0.01 in bold) of the spatial distribution of remaining trees on selectively (Sel) and boom-corridor (BCT) thinned plots. The thinning treatments are described in Table 2. | ||||||||
| Experiment | Clark-Evans index R after thinning treatment | |||||||
| R | p-value | R | p-value | R | p-value | R | p-value | |
| Seeded pine stand | Sel1 | BCTp | BCTf | BCTsemi1 | ||||
| Plot 1 | 1.35 | <0.01 | 1.08 | 0.14 | 1.06 | 0.22 | 1.01 | 0.97 |
| Plot 2 | 1.30 | <0.01 | 1.03 | 0.65 | 1.06 | 0.30 | 1.05 | 0.38 |
| Plot 3 | 1.32 | <0.01 | 1.05 | 0.41 | 1.02 | 0.70 | 1.18 | <0.05 |
| Plot 4 | 1.16 | <0.05 | 1.04 | 0.55 | 1.08 | 0.19 | 1.13 | <0.05 |
| Plot 5 | 1.20 | <0.01 | 0.94 | 0.35 | 1.00 | 0.95 | 0.98 | 0.72 |
| Planted pine stand | Sel1 | BCTsemi1 | BCTsel | |||||
| Plot 1 | 1.32 | <0.01 | 1.07 | 0.19 | 1.18 | <0.01 | ||
| Plot 2 | 1.33 | <0.01 | 1.11 | 0.10 | 1.21 | <0.01 | ||
| Plot 3 | 1.25 | <0.01 | 1.22 | <0.01 | 1.12 | <0.05 | ||
| Plot 4 | 1.16 | 0.01 | 1.10 | 0.06 | 1.17 | <0.01 | ||
| Plot 5 | 1.23 | <0.01 | -- | 1.09 | 0.11 | |||
| Plot 6 | -- | -- | 1.10 | 0.13 | ||||
| Planted birch stand | Sel2 | BCTsemi2 | BCTsemi3 | |||||
| Plot 1 | 1.30 | <0.01 | 1.13 | 0.05 | 1.04 | 0.50 | ||
| Plot 2 | 1.24 | <0.01 | 1.07 | 0.28 | 1.06 | 0.31 | ||
| Plot 3 | 1.29 | <0.01 | 1.09 | 0.14 | 1.08 | 0.14 | ||
Selective thinning (Sel1 and Sel2) increased the mean stem volume by 15–20% compared to the mean stem volume before thinning (Table 5). In the fully systematic BCT treatments (BCTp and BCTf) in the seeded pine stand, the mean stem volume slightly decreased, whereas in semi-systematic BCT (BCTsemi2 and BCTsemi3), the mean stem volume slightly increased. The selective BCT treatment (BCTsel) in the planted pine stand increased the mean stem volume by 15%.
| Table 5. Relative mean stem volume (without top and branches) of the removal of selective thinning (Sel) and boom-corridor thinning (BCT) and relative mean stem volume of trees remaining in Sel and BCT in comparison with the mean stem volume before thinning. The thinning treatments are described in Table 2. | ||||||||||
| No. of plots | Density of removed (stems ha–1) | Volume of removal (m3 ha–1) | Mean stem volume of removal (dm3) | Relative mean stem volume of removal 1 (%) | Relative mean stem volume of growing stock 2 (%) | |||||
| Experiment | Treatment | Mean | ±SE | Mean | ±SE | Mean | ±SE | |||
| Seeded pine stand 3 | Sel1 | 5 | 1028 | 63.1 | 65 | 1.9 | 64 | 3.8 | 100 | 115 |
| BCTp | 5 | 802 | 70.7 | 68 | 4.1 | 85 | 3.2 | 119 | 98 | |
| BCTf | 5 | 836 | 57.3 | 66 | 4.6 | 79 | 4.3 | 122 | 97 | |
| BCTsemi1 | 5 | 776 | 70.2 | 64 | 2.3 | 84 | 6.5 | 119 | 95 | |
| Planted pine stand 3 | Sel1 | 5 | 834 | 62.1 | 56 | 4.5 | 67 | 2.1 | 100 | 120 |
| BCTsemi1 | 4 | 710 | 44.5 | 56 | 4.8 | 79 | 3.6 | 113 | 103 | |
| BCTsel | 6 | 630 | 49.3 | 41 | 3.3 | 66 | 2.0 | 102 | 115 | |
| Planted birch stand 4 | Sel2 | 3 | 2393 | 99.1 | 92 | 10.2 | 39 | 3.5 | 100 | 120 |
| BCTsemi2 | 3 | 1563 | 128.1 | 62 | 8.1 | 41 | 8.1 | 108 | 102 | |
| BCTsemi3 | 3 | 1770 | 106.9 | 69 | 4.5 | 39 | 2.3 | 117 | 107 | |
| 1 Ratios of stem volumes of removal of thinning treatments where the reference value (100) is the mean stem volume of selective thinning. 2 Relative mean stem volume remained in treatments by comparison with the mean stem volume before thinning. The reference value (100) is the mean stem volume of each treatment before thinning. 3 dbh ≥ 70 mm. 4 dbh 30–69 mm & dbh ≥ 70 mm. | ||||||||||
3.2 Removal in thinning
In the seeded pine stand, the removal volume in selective thinning and BCT treatments varied only slightly (Table 5). However, the average stem volume of removals in BCT treatments was 30% higher than in selective thinning (Sel1), and respectively, the number of trees (dbh ≥ 70 mm) removed in BCT was 22% lower than that in selective thinning (Sel1). In the planted birch stand, the number of trees with a dbh ≥ 70 mm removed in BCTsemi2 was 21% lower than in selective thinning (Sel2) and in BCTsemi3 32% lower; respectively, the number of trees with a dbh < 70 mm that were removed was 39 and 24% lower (Table 5). In the planted pine stand and planted birch stand, the average stem volume removal of BCT treatments was 8 and 3% higher than in selective thinning. The relative mean stem volume in BCT treatments was on average 14% higher than in selective thinning (Table 5). In the seeded pine stand, planted pine stand and planted birch stand, the proportion of trees (dbh ≥ 70 mm) left to grow in BCT treatments was on average 55, 60 and 55%; in selective thinning, it was 43, 50 and 39%, respectively (Tables 1 and 3).
3.3 Simulated development of remaining trees
The future development and management of remaining trees on the treatment plots in the seeded pine stand and planted pine stand were simulated until the end of the rotation. The subsequent selective thinning from below removed smaller trees and, simultaneously, a minimum allowed distance of 1 m between remaining trees was applied. In the seeded pine stand, all treatment plots were thinned to the same remaining stand basal area 20 years after the first thinning, and the clearcutting was simulated 35 years after the first thinning. In the planted pine stand, depending on the number of stems per ha, one or two selective thinnings were done before the clearcutting 30 years after the first thinning.
In the seeded pine stand, the total removals of BCT treatments in the second thinning were significantly higher (23–53%) than in selective thinning (Fig. 5). The total removal of the second thinning and clearcutting on boom-corridor thinned (BCTsemi1) plots was significantly higher (10%) than that on selectively thinned plots. In the planted pine stand, the total pulpwood removal of the simulated thinnings and clearcutting on boom-corridor thinned (BCTsemi1) plots was significantly higher (18%) than that on selectively thinned plots (Fig. 6). In the seeded pine stand and planted pine stand experiments, the first thinning treatment did not have a significant effect on the saw log removals of the simulated thinnings and clearcutting.
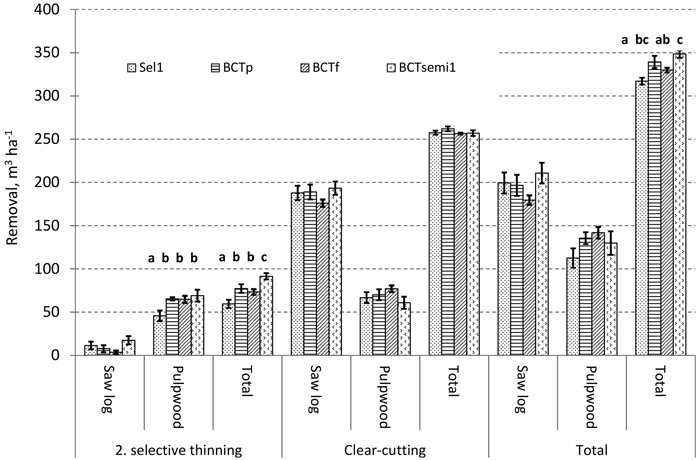
Fig. 5. Simulated removals (Mean ± SE) of the second selective thinning and clearcutting after the first thinning treatments on the treatment plots in the seeded pine stand. The thinning treatments are described in Table 2. Removals marked with different letters are significantly different (p < 0.05).
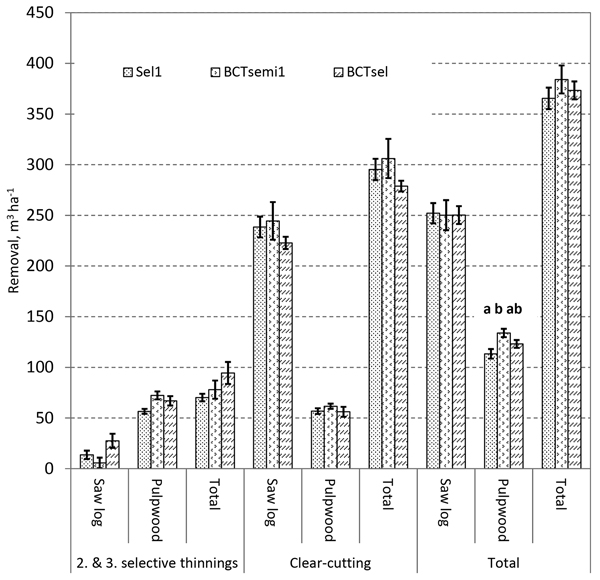
Fig. 6. Simulated removals (Mean ± SE) of the second and third selective thinning and clearcutting after the first thinning treatments on the treatment plots in the planted pine stand. The thinning treatments are described in Table 2. Removals marked with different letters are significantly different (p < 0.05).
4 Discussion
Thinning experiments were established in two Scots pine stands and one birch-dominated stand to assess the long-term growth and timber quality effects of boom-corridor (BCT) and selective thinnings (Sel) done at the first commercial thinning phase. In this study, the post-thinning stand characteristics and spatial patterns, as well as the simulated development of the stands, were described and compared. Tree growth and quality will be studied by follow-up measurements.
All treatment plots within the experiment were thinned to the same remaining stand basal area, and consequently, the number of remaining stems per ha in the BCT treatments was on average 16–46% higher than in selective thinning. After selective thinning and BCT, the number of remaining trees was in accordance with the forest management recommendations applied in Finland (Äijälä et al. 2019). The higher number of remaining stems per ha in BCT was expected due to the systematic thinning in BCT, which removes, with the same intensity, large and small trees. Selective thinning was done as thinning from below, which focuses on the removal of suppressed and subdominant trees.
In Sweden, Ahnlund Ulvcrona et al. (2017) established small-diameter Norway spruce- and Scots pine- dominated experiments at 6–10 m mean height. They also found that BCT with 1-m- (BCT1m) and 2-m-wide corridors (BCT2m) resulted in a higher stem number per hectare than selective thinning; the difference was 3.4–5.0-fold. However, the difference in the number of dominant future crop trees (dbh > 80 mm) was not as high: in selective thinning, 662 remaining trees per hectare and in BCT1m and BCT2m, 812 and 829 remaining trees per hectare, respectively.
In our experiments, the completely systematic BCT methods (BCTp and BCTf) evenly removed trees from the size distribution, in which case the average stem volumes before and after thinning were similar. The semi-selective boom-corridor thinning methods (BCTsemi1, BCTsemi2 and BCTsemi3) included advisory pre-marked corridor locations wherein the effect of BCT on the average stem volume of growing stock varied from –5 to +7%. The selective BCT (BCTsel) in the planted pine stand, where the operator had planned the corridor system, increased the average stem volume by 15%. Correspondingly, in selective thinning, the average stem volume was increased by 20%. Thus, it seemed that in selective BCT, it may be possible to combine the benefits of selective thinning (e.g., tree quality) and BCT.
In our study, selective thinning increased the stem size of the growing stock significantly more compared to BCT treatments because in selective thinning, primarily, the smallest trees were removed, whereas BCT evenly removed trees from the whole size distribution. In the study by Isomäki and Väisänen (1980), the mean diameter was 2.5–3% higher in selectively thinned plots. Respectively, in the study by Ahnlund Ulvcrona et al. (2017), selective thinning increased the mean diameter of standing trees by 4–36% compared to BCT. The reason for the larger increase of the mean diameter in the study of Ahnlund Ulvcrona et al. (2017) was that their experimental stands were dense and unmanaged small-diameter energy wood stands, whereas in the experiments by Isomäki and Väisänen (1980), stands were well-managed first-thinning stands, similar to the stands in this study.
In our study, the removal volumes per hectare of BCT and selective thinning were at the same level. However, in BCT, fewer and larger trees were removed as compared to selective thinning. In the study by Isomäki and Väisänen (1980), the removal per hectare of BCT was one third larger than that in selective thinning. However, in their study, the average diameter of removed trees did not differ significantly between the treatments.
In the second simulated thinning, the removals after BCT were significantly higher than that after selective thinning in the seeded pine stand, but not in the planted pine stand. This difference can be explained by the fact that the number of remaining trees after BCT was higher than after selective thinning, especially in the seeded pine stand. In Finland, the higher thinning removal is a factor that improves the profitability of harvesting, especially in small-diameter first thinnings (Kärhä et al. 2001; Oikari et al. 2008).
The saw log volumes harvested in intermediate thinnings and clearcutting were at the same level after selectively and BCT first-thinned plots. In the long-term field study by Mäkinen et al. (2006), the share of saw log volumes in the pine experiments was 43 % for selective thinning and 38% for BCT; for the spruce experiments, the values were 57 and 53%, respectively. However, it should be noted that Mäkinen et al. (2006) only monitored growth after one motor-manual first thinning, which does not correspond to current mechanical harvesting where the thinning is done two or three times during the forest rotation time. In our simulations, quality defects were not considered, and thus, the simulation results should be interpreted with caution. Our simulations were conducted in managed Scots pine stands, and therefore, the simulation results cannot be applied on, for example, unmanaged stands with different stand structure and earlier stand development.
The post-thinning stand characteristics and the simulated development of remaining trees indicated that, from the silvicultural point of view, the BCT methods applied in this study are feasible in pine and birch stands at the first commercial thinning phase. Sufficient dominant and co-dominant crop trees were left growing in BCT, and later, in the subsequent selective thinning, the spatial arrangement of trees changed towards a more regular spacing.
Based on the results of this and earlier studies, we compared selective thinning and BCT done at the first commercial thinning phase (Table 6). In our study, the corridor system with strip roads removed about half of the standing trees. Thus, such a systematic thinning is easier to perform compared to selective thinning and, likely, renders harvester operators to perform similar thinning intensities. Based on the simulated development of remaining trees in this study, the saw log production after boom-corridor thinning and selective thinning was at the same level. Furthermore, we found that in the simulations, the volume removal per hectare of BCT was significantly higher than that in selective thinning. Also, the relative stem volume of removal in BCT treatments was significantly higher than that in selective thinning, which leads us to infer that the BCT method increases the average volume of removed trees. Both higher removal per hectare and larger size of removed trees increase the profitability of BCT harvesting. In the study of Karlsson et al. (2015), no significant differences in tree mortality between BCT and selective thinnings were found. However, the question arises whether BCT jeopardises the quality of saw logs, especially in pine stands. We agree with Mäkinen et al. (2006) that in future studies, the effects of thinning methods on wood quality and stem damage need to be clarified.
| Table 6. Comparison of selective thinning (Sel) and boom-corridor thinning (BCT) done at the first thinning phase. | ||
| Selective thinning | Boom-corridor thinning | |
| Thinning intensity | Thinning intensity varies according to the operator. | Thinning intensity will vary less if the corridor system is designed right. |
| Thinning method | In thinning below, primarily the smallest and poor-quality trees are removed. Quality thinning especially in pine stands. | Does BCT endanger the quality thinning? |
| Stem damage and consequent tree mortality | Will occur especially when the trees are felled to an un-thinned stand area. Depends on the operator and stand structure. | Tree processing takes place in the corridors, increasing stem damage. |
| Soil damage | The tops and branches are processed to the strip road to reduce soil damage. | Are the logging residues sufficiently obtained to the strip road? |
| Cutting and forwarding | Small stem size and low removal per hectare will result in low productivity and high harvesting costs. | The cost-efficiency of cutting and forwarding probably increases. |
| Sequential thinning | Removed trees are larger and more even-sized compared to BCT. | The thinning removal per hectare is higher than in selective thinning stands. |
| Wind and snow damage | Can be reduced by the timing and intensity of the thinning. | Does BCT increase damage risk? |
| Biodiversity | Risk to produce monoculture if the only aim is to maximise saw timber production. Too strong pre-clearing of undergrowth decreases diversity. | BCT gives the opportunity to grow two-storied or uneven forests. BCT creates suitable thickets and game habitats. |
| Pre-clearing | High-quality harvester thinning requires pre-clearing. | Integrated harvesting of energy and pulpwood enables harvester thinning without pre-clearing. |
According to Ahnlund Ulvcrona et al. (2017) and Witzell et al. (2019), BCT maintained a higher diversity of tree sizes and species (i.e., structural heterogeneity) which results in increased stand biodiversity and provides an opportunity to grow uneven-structured forests. Also, according to Puettmann et al. (2009), selective thinning aims to homogenise stand structure, density and composition, and respectively, BCT allows the development of vertical heterogeneity and, possibly, different age classes. The BCT is possible to conduct without cost-intensive pre-clearing and therefore it has the potential to maintain habitats for several canopy-associated organisms (Röder at al. 2010). However, the corridor thinning patterns create gaps that may efficiently capture snow and thereby increase the risk of snow damage (Valinger et al. 1993) and mimic windthrow effects (Cristian et al. 1996). However, when harvested using the single-tree harvesting method, the logging damage resulting from BCT was lower than that in selective thinning (Lilleberg 1991). Furthermore, Lilleberg (1995) emphasised that the thinning method strongly influences the harvesting costs associated with the first thinning as well as the value added by the harvested pulpwood.
5 Conclusions
The first results from the application of boom-corridor thinning (BCT) in the management of young pine and birch stands are promising. Before the first commercial thinning, the density of the dominant trees varied from 1600 to 2000 trees per hectare, and the height and spatial structures of the experimental stands were homogeneous. In BCT, the operator removed all trees from strip roads and boom-corridors in a fan-shaped orientation or perpendicular to the strip roads. Depending on the standing trees, the width of and distance between corridors were about 2–2.5 m and 4–5 m, respectively. Constructing the strip roads and corridors removed about half the trees present, resulting in 800–1000 remaining trees per hectare. In BCT, the processing of trees takes place at the boom-corridor and strip road, whereas in selective thinning, debranching and crosscutting are done at the strip roads and in the areas between the strip roads.
This study reveals that, compared to conventional selective thinning in young dense boreal stands:
- after BCT, the number of stems per hectare was higher, although the number of future crop trees was at the same level,
- the removal of the simulated intermediate thinnings and clearcutting in BCT treatments was 10–18% higher, and the saw log volumes were at the same level in both treatments,
- the BCT method increased the average volume of removed trees,
- the increased removal per hectare and the size of removed trees increase cost-efficiency of cutting and forwarding,
- in unmanaged young stands, BCT can be conducted without cost-intensive pre-clearing of the undergrowth, which creates post-stands with higher biodiversity, promoting the development of uneven forests.
In the future, more experiments similar to those in this study need to be established under various stand and site conditions, especially in unmanaged, dense young stands with a mix of tree species and a heterogeneous size structure. Future research should investigate the possible growth increase of corridor edge trees as well as the effects of corridor thinning on forest cover and diversity.
Further studies should determine the selection criteria for stands where BCT is feasible. These criteria must take into account the profitability of harvesting and the development of the remaining trees. Finally, taking BCT into actual use requires the cooperation of forest owners, forest companies, contractors as well as research and education organisations. Special consideration should be directed to the stand structure after the second thinning when selective thinning is conducted. The likely positive effects of BCT on the profitability of forwarding have not been studied yet, requiring further studies in this field.
Acknowledgements
This work was supported by Luke’s SILVITECH – Novel silvicultural technology solutions for bio-based industry (grant number 41007-00096400), and the Bio Based Industries Joint Undertaking under the European Union’s Horizon 2020 research and innovation program TECH4EFFECT – Techniques and Technologies for Effective Wood Procurement–project (grant number 720757), and EFFORTE – Efficient forestry for sustainable and cost-competitive bio-based industry project (grant number 720712).
References
Ahnlund Ulvcrona K, Bergström D, Bergsten U (2017) Stand structure after thinning in 1–2 m wide corridors in young dense stands. Silva Fenn 51, article id 1563. https://doi.org/10.14214/sf.1563.
Äijälä O, Koistinen A, Sved J, Vanhatalo K, Väisänen P (2019) Metsänhoidon suositukset. [Forest management recommendations]. Tapion julkaisuja.
Belbo H (2011) Efficiency of accumulating felling heads and harvesting heads in mechanized thinning of small diameter trees. Doctoral Thesis, Linnaeus University Dissertations 66/2011.
Bergström D (2009) Techniques and systems for boom-corridor thinning in young dense forests. Swedish University of Agricultural Sciences, Doctoral Thesis, Acta Universatis Agriculturae Sueciae 2009:87.
Bergström D, di Fulvio F (2014) Comparison of the cost and energy efficiencies of present and future biomass supply systems for young dense forests. Scandinavian Journal of Forest Research 29: 793–812. https://doi.org/10.1080/02827581.2014.976590.
Bergström D, Bergsten U, Nordfjell T (2007) Simulation of geometric thinning systems and their time requirements for young forests. Silva Fenn 41: 137–147. https://doi.org/10.14214/sf.311.
Bergström D, Bergsten U, Nordfjell T (2010) Comparison of boom-corridor thinning and thinning from below harvesting methods in young dense Scots pine stands. Silva Fenn 44: 669–679. https://doi.org/10.14214/sf.134.
Brunberg T, Iwarsson-Wide M (2013) Underlag för prestationshöjning vid flerträdshantering gallring. [Criteria for improving the efficiency of multitree handling in first thinning]. Arbetsrapport från Skogforsk nr. 796.
Brunberg T, Iwarsson Wide M (2016) Multi-tree handling increases productivity. In: Palmer C, Eliasson L, Iwarsson Wide M (eds) Forest energy for a sustainable future. Skogforsk, Uppsala Science Park, Sweden, pp 60–61.
Bucht S (1981) The influence of some different thinning patterns on the development of Scots pine stands. Swedish University of Agricultural Sciences, Report No. 4.
Bucht S, Elfving B (1977) Thinning response and increment in a strip-thinned stand. Sveriges Skogsvårdsförbunds Tidskrift 75: 323–345.
Cajander AK (1949) Forest types and their significance. Acta For Fenn 56. https://doi.org/10.14214/aff.7396.
Christian DP, Reuvers-House M, Hanowski JM, Niemi GJ, Blake JG, Berguson WE (1996) Effects of mechanical strip thinning of aspen on small mammals and breeding birds in northern Minnesota, U.S.A. Can J For Res 26: 1284–1294. https://doi.org/10.1139/x26-143.
Clark PJ, Evans FC (1954) Distance to nearest neighbour as a measure of spatial relationships in populations. Ecology 35: 445–453. https://doi.org/10.2307/1931034.
Hakkila P (2005) Fuel from early thinnings. Int J For Eng 16: 11–14. https://doi.org/10.1080/14942119.2005.10702503.
Huuskonen S, Hakala S, Mäkinen H, Hynynen J, Varmola M (2014) Factors influencing the branchiness of young Scots pine trees. Forestry 87: 257–265. https://doi.org/10.1093/forestry/cpt057.
IBM Corp. Released (2017) IBM SPSS Statistics for Windows, Version 25.0. IBM Corp, Armonk, NY.
Isomäki A, Väisänen J (1980) Harvennustavan vaikutus kasvatettavaan puustoon ja harvennuskertymään. [Thinning method and its influence on the remaining growing stock and on the thinning yield]. Folia For 450. http://urn.fi/URN:ISBN:951-40-0474-4.
Iwarsson Wide M (2010) Technology and methods for logging in young stands. In: Thorsén Å, Björheden R, Eliasson L (eds) Efficient forest fuels supply systems. Skogforsk, Uppsala Science Park, Sweden, pp 56–59.
Jundén L, Bergström D, Servin M, Bergsten U (2013) Simulation of boom-corridor thinning using a double-crane system and different levels of automation. Int J For Eng 24: 16–23. https://doi.org/10.1080/14942119.2013.798131.
Kärhä K (ed) (2001) Harvennuspuun koneelliset korjuuvaihtoehdot. HARKO-projektin 1999–2001 loppuraportti. [Alternative harvesting systems in mechanized thinning]. Työtehoseuran julkaisuja 382.
Kärhä K, Rönkkö E, Gumse S-I (2004) Productivity and cutting costs of thinning harvesters. Int J For Eng 15: 43–56. https://doi.org/10.1080/14942119.2004.10702496.
Kärhä K, Jouhiaho A, Mutikainen A, Mattila S (2005) Mechanized energy wood harvesting from early thinnings. Int J For Eng 16: 15–26. https://doi.org/10.1080/14942119.2005.10702504.
Kariniemi A (2006) Kuljettajakeskeinen hakkuukonetyön malli – työn suorituksen kognitiivinen tarkastelu. [Operator-specific model for mechanical harvesting – cognitive approach to work peformance]. Helsingin yliopiston metsävarojen käytön julkaisuja 38. http://hdl.handle.net/1975/443.
Karlsson L, Bergsten U, Ulvcrona T, Elfving B (2012) Long-term effects of growth and yield of corridor thinning in young Pinus sylvestris stands. Scand J For Res 28: 28–37. https://doi.org/10.1080/02827581.2012.702222.
Karlsson L, Nyström K, Bergström D, Bergsten U (2015) Development of Scots pine stands after first biomass thinning with implications on management profitability over rotation. Scand J For Res 30: 416–428. https://doi.org/10.1080/02827581.2015.1023351.
Korhonen KT, Ihalainen A, Ahola A, Heikkinen J, Henttonen HM, Hotanen J-P, Nevalainen S, Pitkänen J, Strandström M, Viiri H (2017) Suomen metsät 2009–2013 ja niiden kehitys 1921–2013. [Finnish forests 2009–2013 and their development 1921–2013]. Luonnonvara- ja biotalouden tutkimus 59/2017, Natural Resources Institute Finland (Luke), Helsinki. http://urn.fi/URN:ISBN:978-952-326-467-0.
Kuitto P-J, Keskinen S, Lindroos J, Oijala T, Rajamäki J, Räsänen T, Terävä J (1994) Puutavaran koneellinen hakkuu ja metsäkuljetus. [Mechanized cutting and forest haulage]. Metsätehon tiedotus 410.
Laasasenaho J (1982) Taper curve and volume functions for pine, spruce and birch. Commun Inst For Fenn 108. http://urn.fi/URN:ISBN:951-40-0589-9.
Lämsä P, Kellomäki S, Väisänen H (1990) Nuorten mäntyjen oksikkuuden riippuvuus puuston rakenteesta ja kasvupaikan viljavuudesta. [Branchiness of young Scots pines as related to stand structure and site fertility]. Folia For 746. http://urn.fi/URN:ISBN:951-40-1092-2.
Läspä O, Nurmi J (2018) Geometrical thinning in energy wood harvesting. Int J For Eng 29: 171–178. https://doi.org/10.1080/14942119.2018.1493845.
Lilleberg R (1991) Harvennustapa ja puiden joukkokäsittely ensiharvennusmännikön koneellisessa hakkuussa. [The thinning method and multi-tree handling in mechanized first thinning of pine stands]. Metsätehon tiedotus 406.
Lilleberg R (1995) Harvennustapa männikön ensiharvennuksessa. [Thinning alternatives in first thinning of pine]. Metsätehon katsaus 3/1995.
Luonnonvarakeskus (2019) Ruoka- ja luonnonvaratilastojen e-vuosikirja. [Natural Resources Institute Finland. Statistical bulletin of food and natural resource]. Luonnonvara- ja biotalouden tutkimus 86/2019. http://urn.fi/URN:ISBN:978-952-326-880-7.
Mäkinen H, Isomäki A, Hongisto T (2006) Effect of half-systematic thinning on the increment of Scots pine and Norway spruce in Finland. Forestry 79: 103–121. https://doi.org/10.1093/forestry/cpi061.
Mielikäinen K, Valkonen S (1991) Harvennustavan vaikutus varttuneen metsikön tuotokseen ja tuottoihin Etelä-Suomessa. [Effect of thinning method on the yield of middle-aged stands in southern Finland]. Folia For 776: 1–22. http://urn.fi/URN:ISBN:951-40-1167-8.
Näslund M (1936) Skogsförsöksanstaltens gallringsförsök i tallskog. [Forest research institute’s thinning experiments in pine forests]. Meddelanden från Statens Skogsförsöksanstalt 29.
Niemistö P, Kilpeläinen H, Poutiainen E (2018) Effect of first thinning type and age on growth, stem quality and financial performance of a Scots pine stand in Finland. Silva Fenn 52, article id 7816. https://doi.org/10.14214/sf.7816.
Oikari M, Kärhä K, Palander T, Pajuoja H, Ovaskainen H (2008) Puunkorjuun tehostaminen nuorista metsistä. [Increasing the cost-efficiency of wood harvesting from young stands in Finland]. Metsätehon katsaus 36. http://www.metsateho.fi/puunkorjuun-tehostaminen-nuorissa-metsissa. Accessed 14 April 2020.
Ovaskainen H, Uusitalo J, Väätäinen K (2004) Characteristics and significance of a harvester operators’ working technique in thinnings. Int J For Eng 15: 67–77. https://doi.org/10.1080/14942119.2004.10702498.
Pettersson N (1986) Line thinning in young natural regenerated pine stands. Swedish University of Agricultural Sciences, Report no. 17.
Puettmann KJ, Messier C, Coates KD (2014) Managing forests as complex adaptive systems. Introductory concepts and applications. In: Messier C, Puettmann KJ, Coates KD (eds) Managing forests as complex adaptive systems: building resilience to the challenge of global change. Routledge Taylor & Francis, Oxford, UK, pp 3–16.
Pukkala T, Miina J, Kurttila M, Kolström T (1998) A spatial yield model for optimizing the thinning regime of mixed stands of Pinus sylvestris and Picea abies. Scand J For Res 13: 31–42. https://doi.org/10.1080/02827589809382959.
R Core Team (2018) R: a language and environment for statistical computing. R Foundation for Statistical Computing, Vienna. https://www.gbif.org/tool/81287/r-a-language-and-environment-for-statistical-computing. Accessed 10 Oct 2020.
Röder J, Bässler C, Brandl R, Dvořak L, Floren A, Goßner MM, Gruppe A, Jarzabek-Müller A, Vojtech O, Wagner C, Müller J (2010) Arthropod species richness in the Norway spruce (Picea abies (L.) Karst.) canopy along an elevation gradient. For Ecol Manage 259: 1513–1521. https://doi.org/10.1016/j.foreco.2010.01.027.
Rummer R-B (1993) Thinning with the Gafner Tri-Trac feller/buncher: a case study. Southern Forest Experiment Station, USDA Forest Service, Research Paper SO-273.
Ryynänen S, Rönkkö E (2001) Harvennusharvestereiden tuottavuus ja kustannukset. [Productivity and expenses associated with thinning harvesters]. Työtehoseuran julkaisuja 381.
Sängstuvall L, Bergström D, Lämås T, Nordfjell T (2011) Simulation of harvester productivity in selective and boom-corridor thinning of young forests. Scand J For Res 27: 56–73. https://doi.org/10.1080/02827581.2011.628335.
Siren M (1998) Hakkuukonetyö, sen korjuujälki ja puustovaurioiden ennustaminen. [One-grip harvester operation, it’s silvicultural result and possibilities to predict tree damage]. Metsäntutkimuslaitoksen tiedonantoja 694. http://urn.fi/URN:ISBN:951-40-1635-1.
Skogsdata 2019 (2019) Sveriges officiella statistik. Institutionen för skoglig resurshållning, SLU Umeå. [Forest statistics 2019. Official Statistics of Sweden, Swedish University of Agricultural Sciences Umeå]. https://www.slu.se/globalassets/ew/org/centrb/rt/dokument/skogsdata/skogsdata_2019_webb.pdf. Accessed 10 Oct 2020.
Strandström M (2018) Puunkorjuu ja kaukokuljetus vuonna 2017. [Logging and long-distance transport during year 2017]. Metsätehon tuloskalvosarja 8a/2018.
Suadicani K, Nordfjell T (2003) Operational aspects of row and selective thinning in the establishing of a shelterwood in a 50-year-old Norway spruce stand. Int J For Eng 14: 25–37. https://doi.org/10.1080/14942119.2003.10702467.
Väätäinen K, Ovaskainen H, Ranta P, Ala-Fossi A (2005) Hakkuukoneenkuljettajan hiljaisen tiedon merkitys hakkuutulokseen työpistetasolla. [Significance of harvester operator’s tacit knowledge on working performance in working location]. Metsäntutkimuslaitoksen tiedonantoja 937. http://urn.fi/URN:ISBN:951-40-1950-4.
Valinger E, Lundqvist L, Bondesson L (1993) Assessing the risk of snow and wind damage from tree physical characteristics. Forestry 66: 249–260. https://doi.org/10.1093/forestry/66.3.249.
Witzell J, Bergström D, Bergsten U (2019) Variable corridor thinning – a cost-effective key to provision of multiple ecosystem services from young boreal conifer forests? Scand J For Res 34: 497–507. https://doi.org/10.1080/02827581.2019.1596304.
Total of 55 references.
